I hope everyone had a great Christmas and let me be the first to wish you a Happy New Year!
I am excited to see what the new year brings and I look forward to “charting” the path forward with each of you!
Two quick things today as we get ready to close out the end of the year:
Don’t forget that you have until midnight on December 31st to take advantage of the “15% discount for life” for anyone who signs up for an annual subscription. Starting January 1st, the “Weekly Chart Review” will only be available to paid subscribers.
Here are a few quick thoughts on the S&P 500 chart as we close out the year.
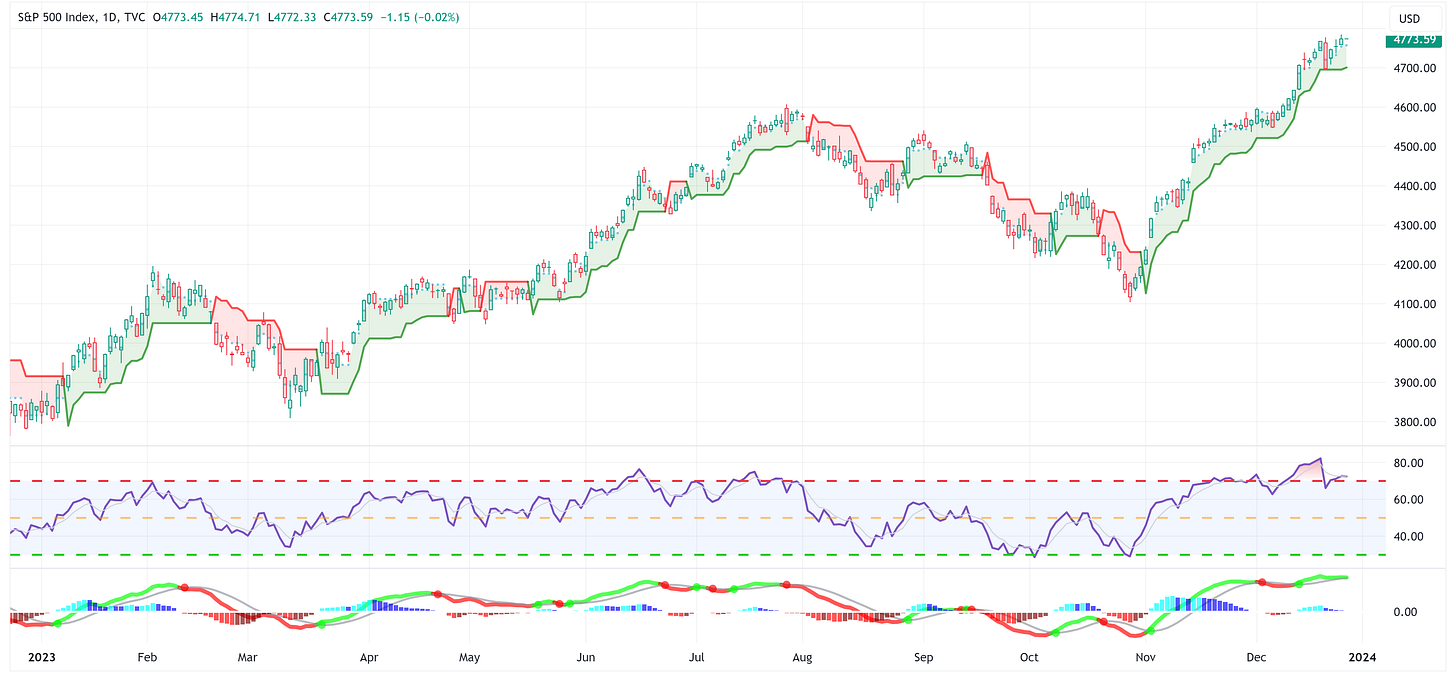
First, let’s start by recognizing the incredible run that the S&P 500 has had since the beginning of November.
It never even contemplated breaking below the trailing stop loss that I have overlaid on the chart.
Note: all else being equal, if you stay on the “correct” side of the trailing stop loss, you’ll save yourself a lot of headaches.
Second, the march higher from the beginning of November was fast and furious which created price gaps that I contend will eventually get filled.
The S&P 500 would need to trade down to ~4,000 to fill all five of these price gaps.
Unfortunately, price gaps do not provide timing; therefore, these price gaps could be filled next week, next month, or next year. We simply do not know but they will get filled eventually.
Third, the S&P 500 is less than 1.00% away from creating a new all-time high.
If I were a betting man, I would bet that “the powers that be” would like to see the S&P 500 print a new all-time high before year-end or shortly thereafter.
The horizontal blue line marks the previous all-time high.
Fourth, a word of caution.
On December 19th, the Relative Strength Index (RSI) for the S&P 500 closed at 82.18.
Note: typically, any reading above 70 is classified as “overbought”.
I have noted on the chart below (yellow circles) the last two times (2018 & 2020) the RSI closed above 82.
After closing above 82 in 2018, the S&P 500 declined -11.84% over the course of 10 trading days (01/26/18 - 02/09/18).
After closing above 82 in 2020, the S&P 500 declined -10.55% over the course of 15 trading days (09/02/20 - 09/24/20).
Ironically, or maybe not, just before these declines:
The S&P 500 had a multi-month move higher in price without breaking the trailing stop loss (similar to today).
The peak was a new all-time high for the S&P 500 (similar to today???).
Will this happen again, I don’t know, but it’s worth considering.
I would watch for the MACD sell signal (red dot in the bottom panel of the charts above) as it was the clue the last two times that the selloff had begun.
Here is a zoomed-in look at the current MACD panel. The MACD sell signal (“red dot”) will be triggered once the green line crosses below the gray line.
Note: the vertical red dotted line denotes where the RSI achieved its high print of 82.18.
It has truly been a joy bringing you these insights each week over the last year.
I hope to see you in the new year as a paid subscriber so that together we can discover new ways to take advantage of what the market presents us!
Happy New Year!


Hi Nizzyneck,
I use TradingView for all of my charts ad there is an indicator in their system by the name of: "CDC ATR Trailing Stop V2.1 (2013)". I use the default settings.
Hope this helps!
Take care,
Jim
Great write up. Anyone know the name of that stop loss indicator? Pretty please, anyone?