
The Market Map
Nine Consecutive Weeks...

Hey everyone — it’s Jim.
I hope you had a great weekend!
Let’s jump right into this week’s newsletter…
SGR - Turn Signal
Let’s take a look at one of the Top Performing and one of the Worst Performing stocks in the S&P 500 last week.
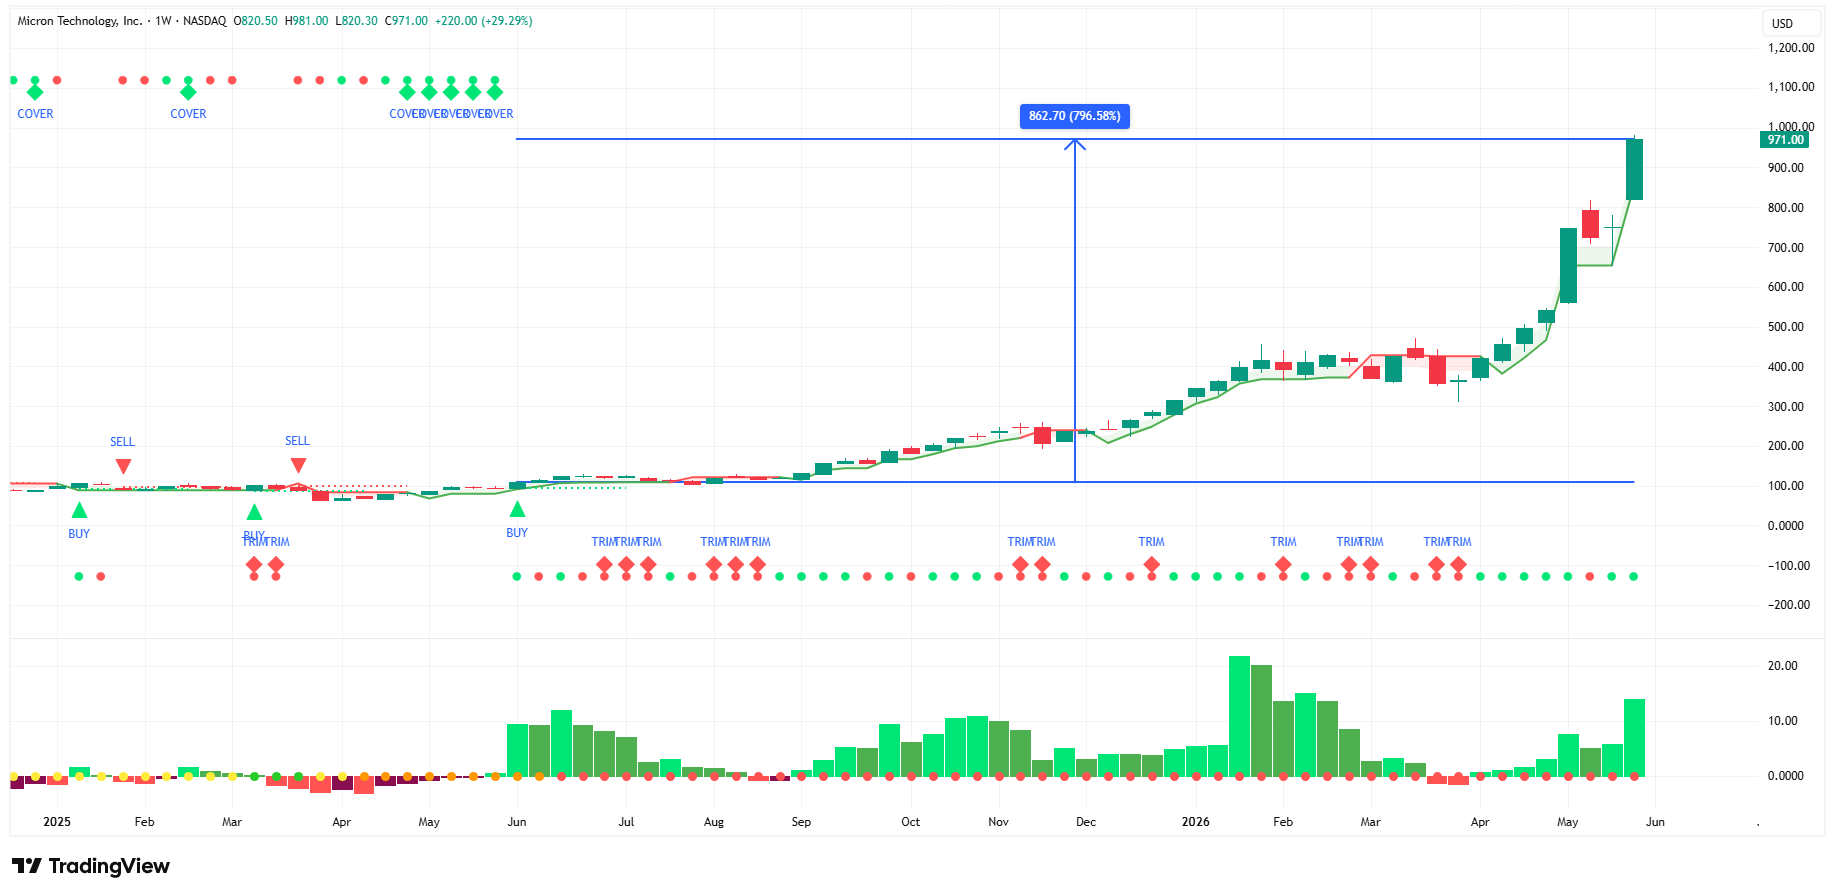
Top Performer:
Micron Technology (MU) returned 29.29% last week.
The SGR - Turn Signal initiated a “Buy” signal for MU on June 6, 2025.
Since then, MU has returned 796.58%.
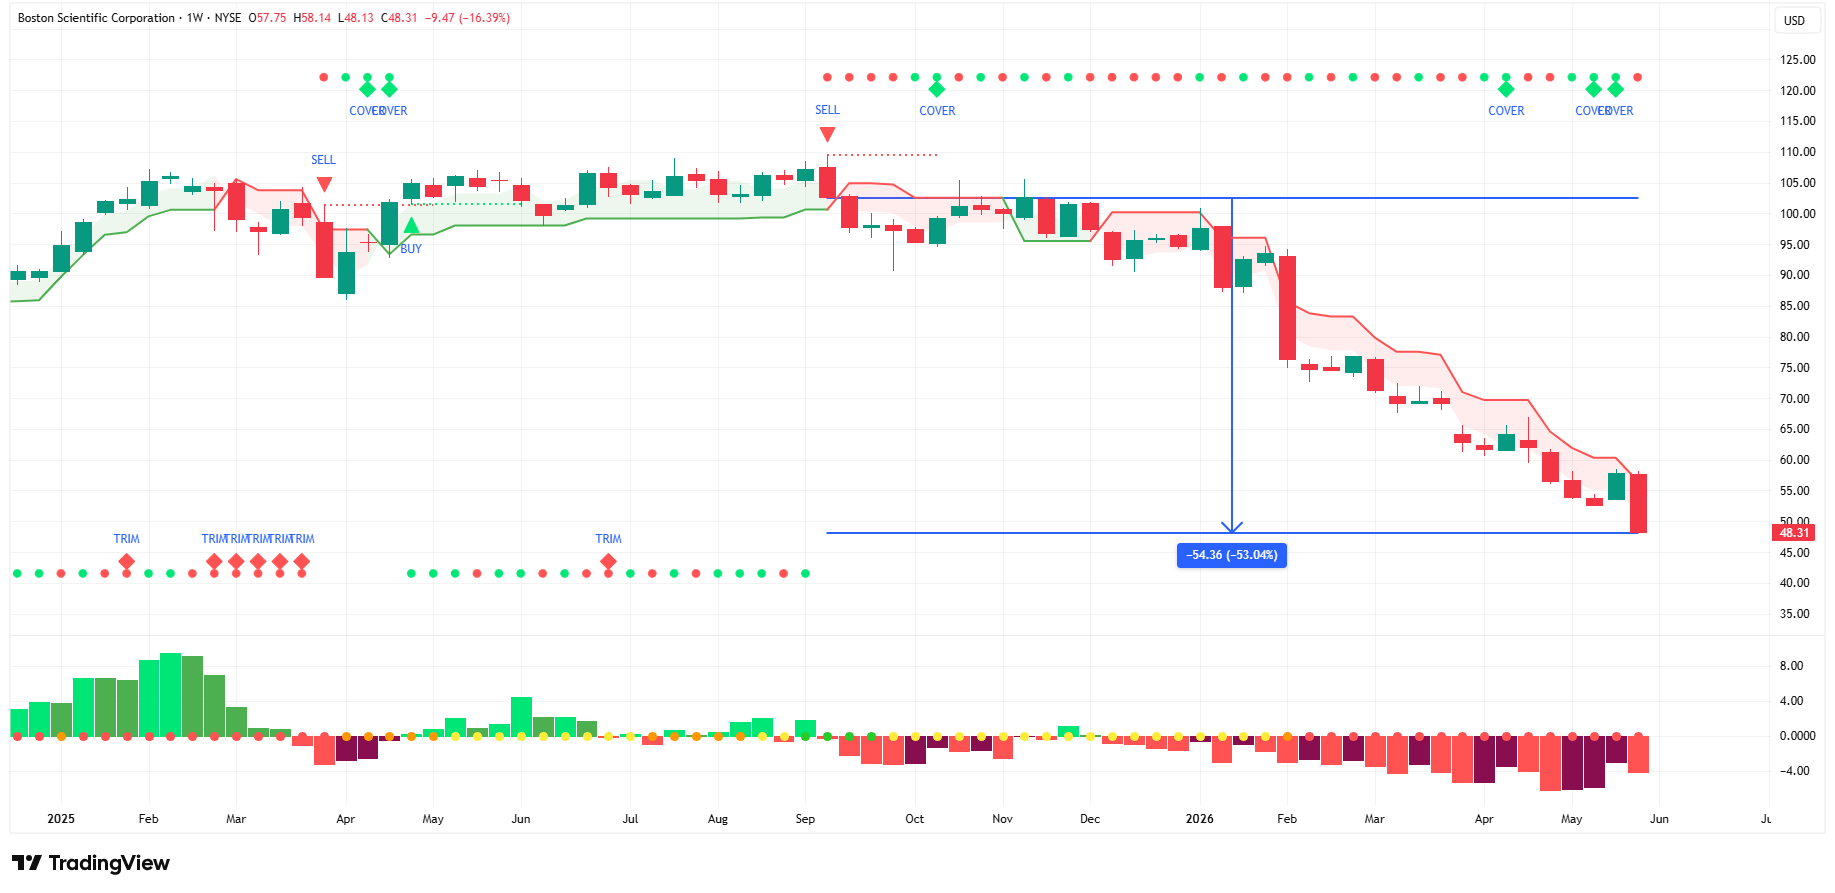
Worst Performer:
Boston Scientific Corporation (BSX) returned -16.39% last week.
The SGR - Turn Signal initiated a “Sell” signal for BSX on September 12, 2025.
Since then, BSX has returned -53.04%.
Do you have a system in place to give you this kind of intel to keep you on the right side of the trade?
If not, consider joining our free live webinar on Tuesday, June 2nd at 7:00 pm, where you can learn more about the SGR - Turn Signal and how you can get access to it.
👉 Click here to grab your seat: Webinar Registration
The Market Map
Each week, we break down the S&P 500 using our proprietary systematic process, which we call “The Market Map.”
The Market Map is an analysis of market structure. Understanding market structure can provide clues as to where the market may be heading next.
To do this, we start by analyzing the bigger picture (weekly chart) and then look for confirming evidence by shifting to a lower time frame (4-hour chart).
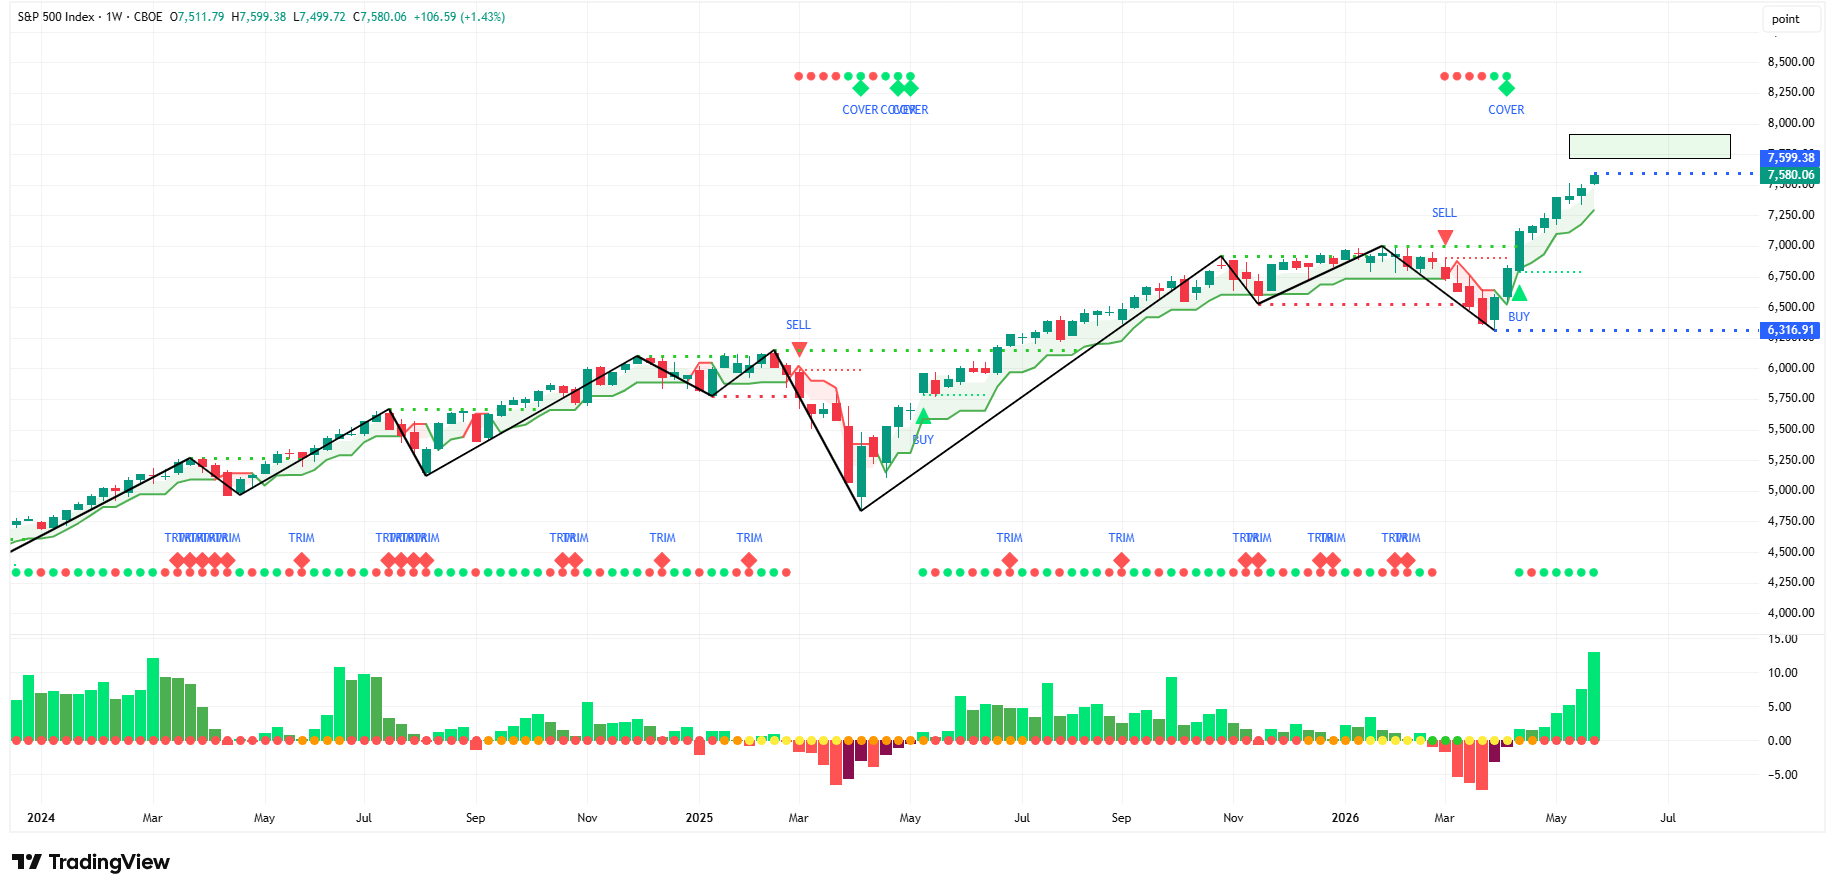
Weekly Chart
If it ain’t broke, don’t fix it.
“The S&P 500 continues to maintain a bullish structure.
Therefore, we should expect the S&P 500 to continue pushing higher in the short- to medium-term.
My technical work suggests a target of 7,700 - 7,900 (green box) for the S&P 500.”
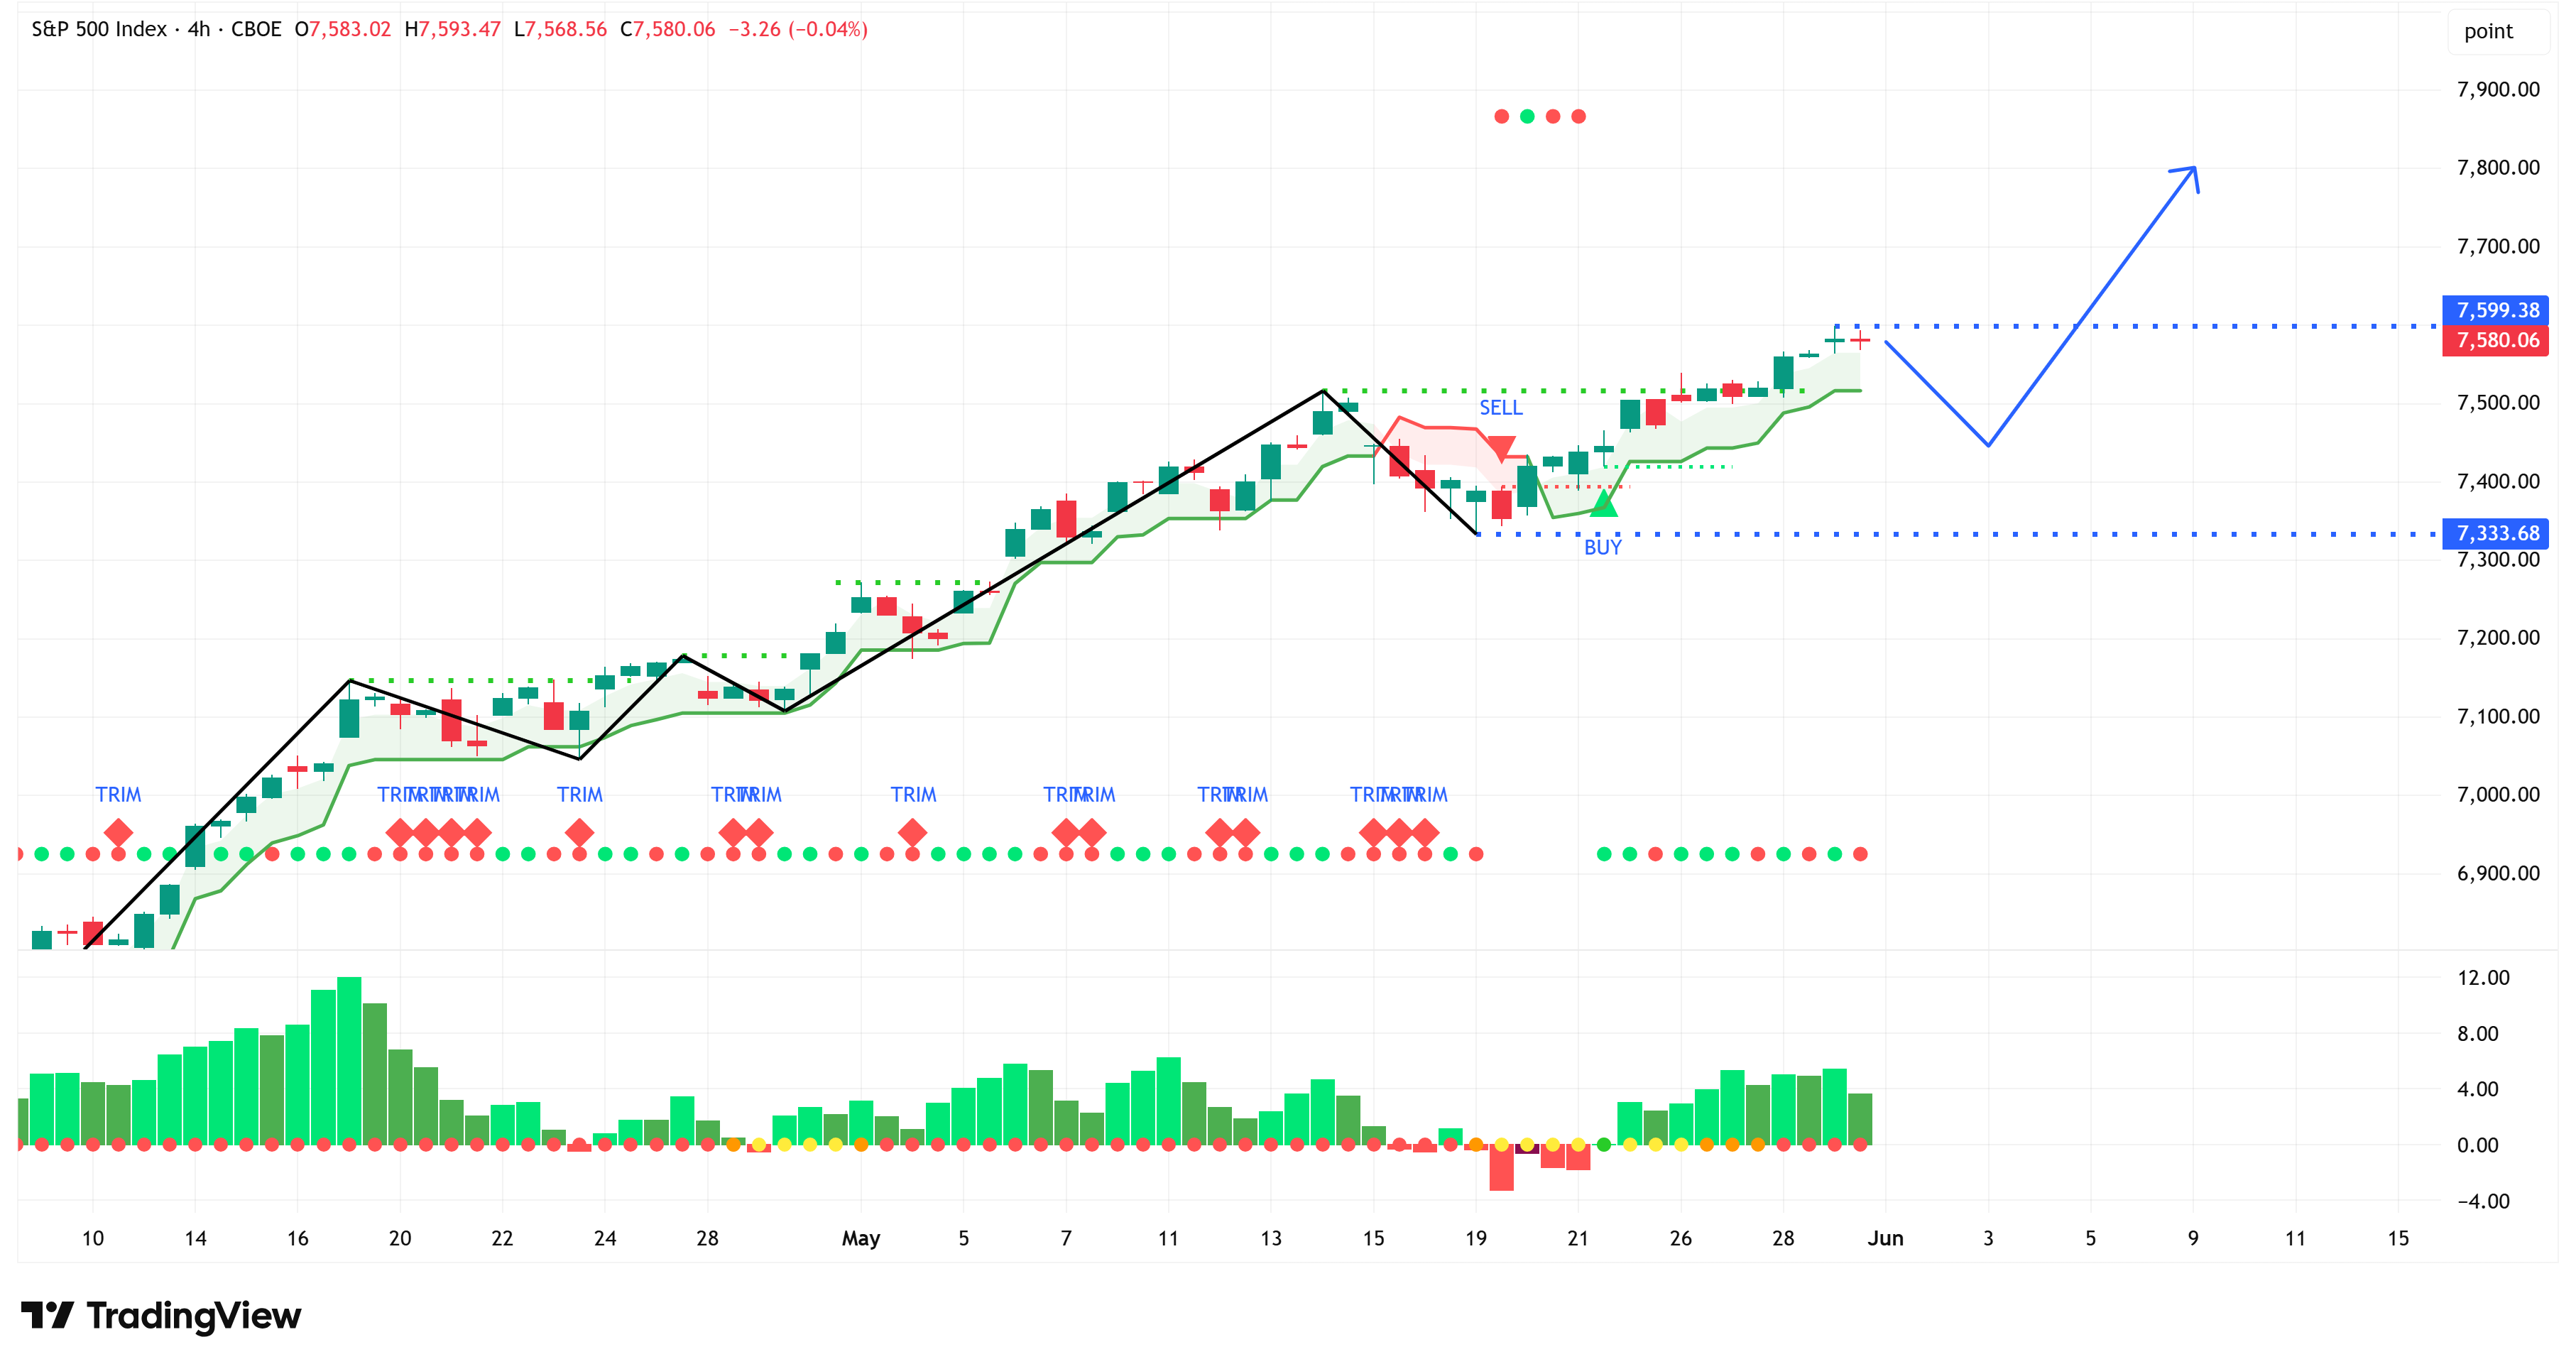
4-Hour Chart
Structure remains bullish. All else being equal, assume a continued move higher.
Summary
Still a very bullish setup across the board.
You’ll see below that I talk about the fact that we’ve had nine consecutive positive weeks for the S&P 500.
Typically, that would suggest that we should expect a pullback at some point (and I believe we should), but that doesn’t mean it has to be this week.
I still think the target is somewhere in the range of 7,700 - 7,900.
The key level to watch to the downside is now 7,333.
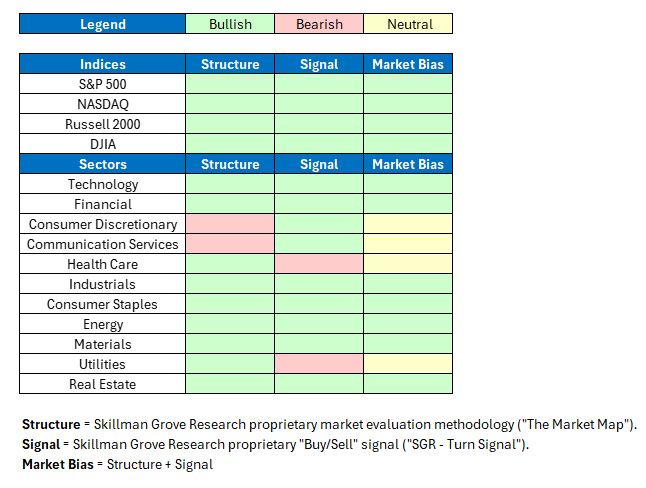
Market Bias
When we combine our structural analysis (“The Market Map”) with our signal analysis (“SGR - Turn Signal”), we create what we call the “Market Bias.”
The Market Bias tells us the possible direction (bullish 🟢, bearish 🔴, or neutral 🟡) of each market over the short- to medium-term.
Note: We use the weekly chart for this analysis to smooth out the day-to-day price volatility.
Here’s a quick snapshot of our Market Bias analysis for the major US indices and sectors.
There were no changes on a week-over-week basis.
Would you like to see our Market Bias for even more asset classes so that you can stay on the right side of the market?
If so, in our paid section below, we detail 30+ securities/charts each week.
The charts include various indices, equity sectors, US Treasuries, currencies, commodities, and fixed income.
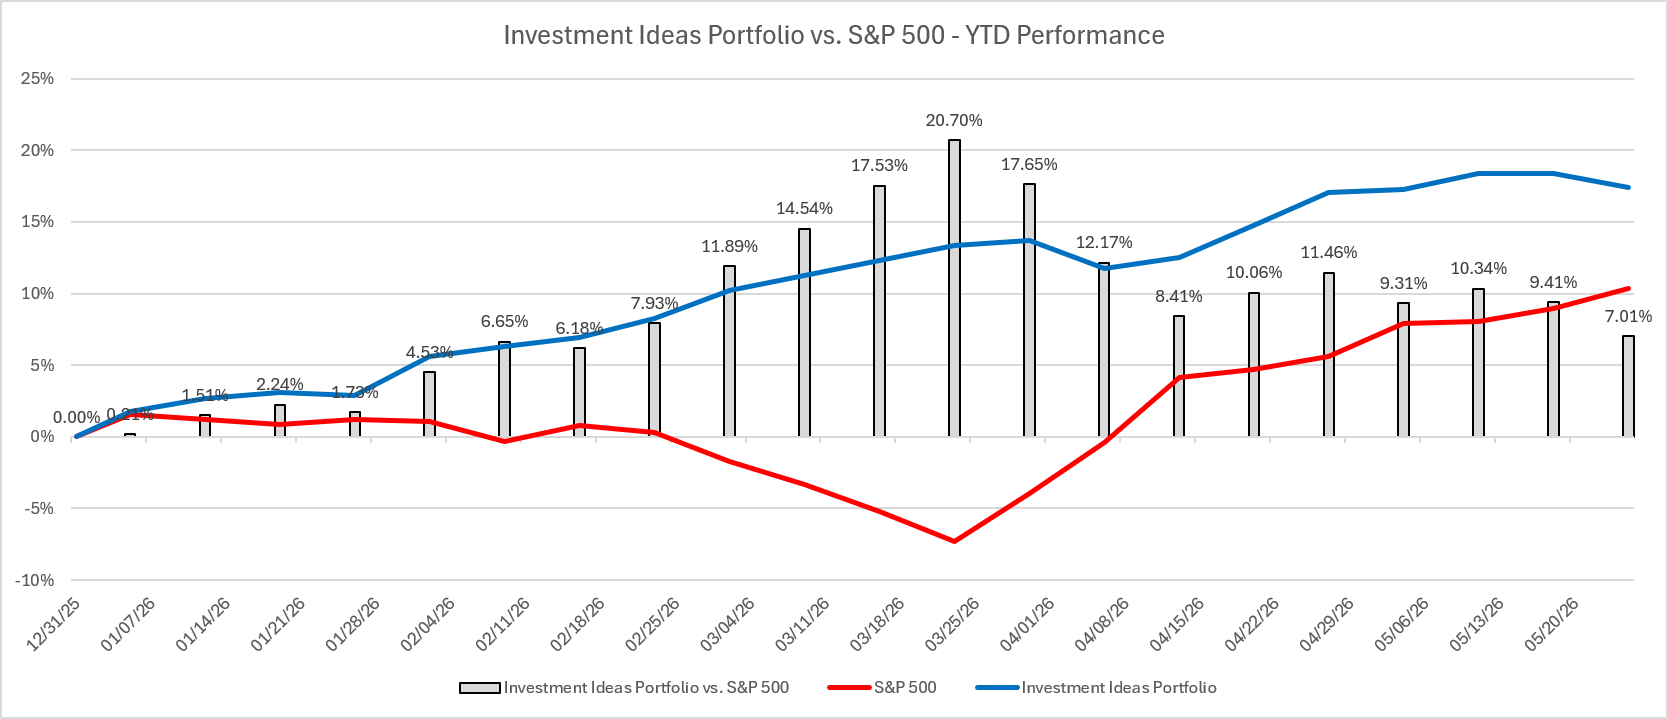
Investment Ideas
In addition to the 30+ securities/charts noted above, each week, we use our “Market Bias” methodology to sift through more than 150 securities to create a portfolio of our best “Investment Ideas”.
Year-to-date, our “Investment Ideas” portfolio has returned 17.38% and has outperformed the S&P 500 by 7.01%.
Would you like access to our “Investment Ideas” portfolio so you can see our buys and sells in real-time?
If so, consider becoming a paid subscriber by clicking the link below.
Nine Consecutive Weeks…
There’s been a lot of talk over the last week about the fact that the S&P 500 has risen for 9 consecutive weeks.
This is the 11th time this has occurred since the S&P 500’s formal beginning in 1957, or roughly once every 6 years.
Here are the 11 occurrences:
Mar 1957 - Jun 1957 (13 weeks)
Aug 1958 - Oct 1958 (9 weeks)
Dec 1960 - Jan 1961 (9 weeks)
Mar 1963 - May 1963 (10 weeks)
Jul 1963 - Sep 1963 (9 weeks)
Nov 1963 - Jan 1964 (9 weeks)
Sep 1985 - Dec 1985 (12 weeks)
Jul 1989 - Aug 1989 (9 weeks)
Nov 2003 - Jan 2004 (9 weeks)
Oct 2023 - Dec 2023 (9 weeks)
Mar 2026 - Current (9 weeks)
Notice that only 3 of those occurrences (13 weeks, 10 weeks, and 12 weeks) extended beyond 9 weeks.
The key question is what happened afterwards…
