


Weekly Chart Review
The Election Trade...

One of the goals of this newsletter is to be as apolitical as possible. With that said, every four years we have an election in this country that gets billed as “the most important election of our lifetime” so I don’t feel like we can ignore it.
A few observations as it pertains to this election in particular, and I would qualify all of these statements with an “in my opinion…”
Our country appears to be more divided now than at any other time in recent history.
Therefore, no matter the outcome, 50% of the country will likely be very upset about said outcome.
Unless one party wins so convincingly that there’s no debating it, the other party will not be convinced of the outcome.
Therefore, the results of the election will likely be contested either formally (i.e. in the court system) or less formally (i.e., in the streets) or both.
A highly contested election with 50% of the nation already very upset about the loss (I can hear the cries now “It was stolen…”) will lead to uncertainty for the markets.
Markets typically do not like uncertainty. If we have only three options: buy, sell, or do nothing; my experience suggests that in moments of high uncertainty, people tend to skew towards doing nothing or selling.
Net/net, uncertainty tends to lead to a sideways or lower market.
Does that mean you should go out and sell everything in advance of the election and sit in cash, absolutely not, but you should be prepared for a period that might get a little bumpy.
Negative Divergence
In last week’s newsletter (read it here), I presented the following chart:
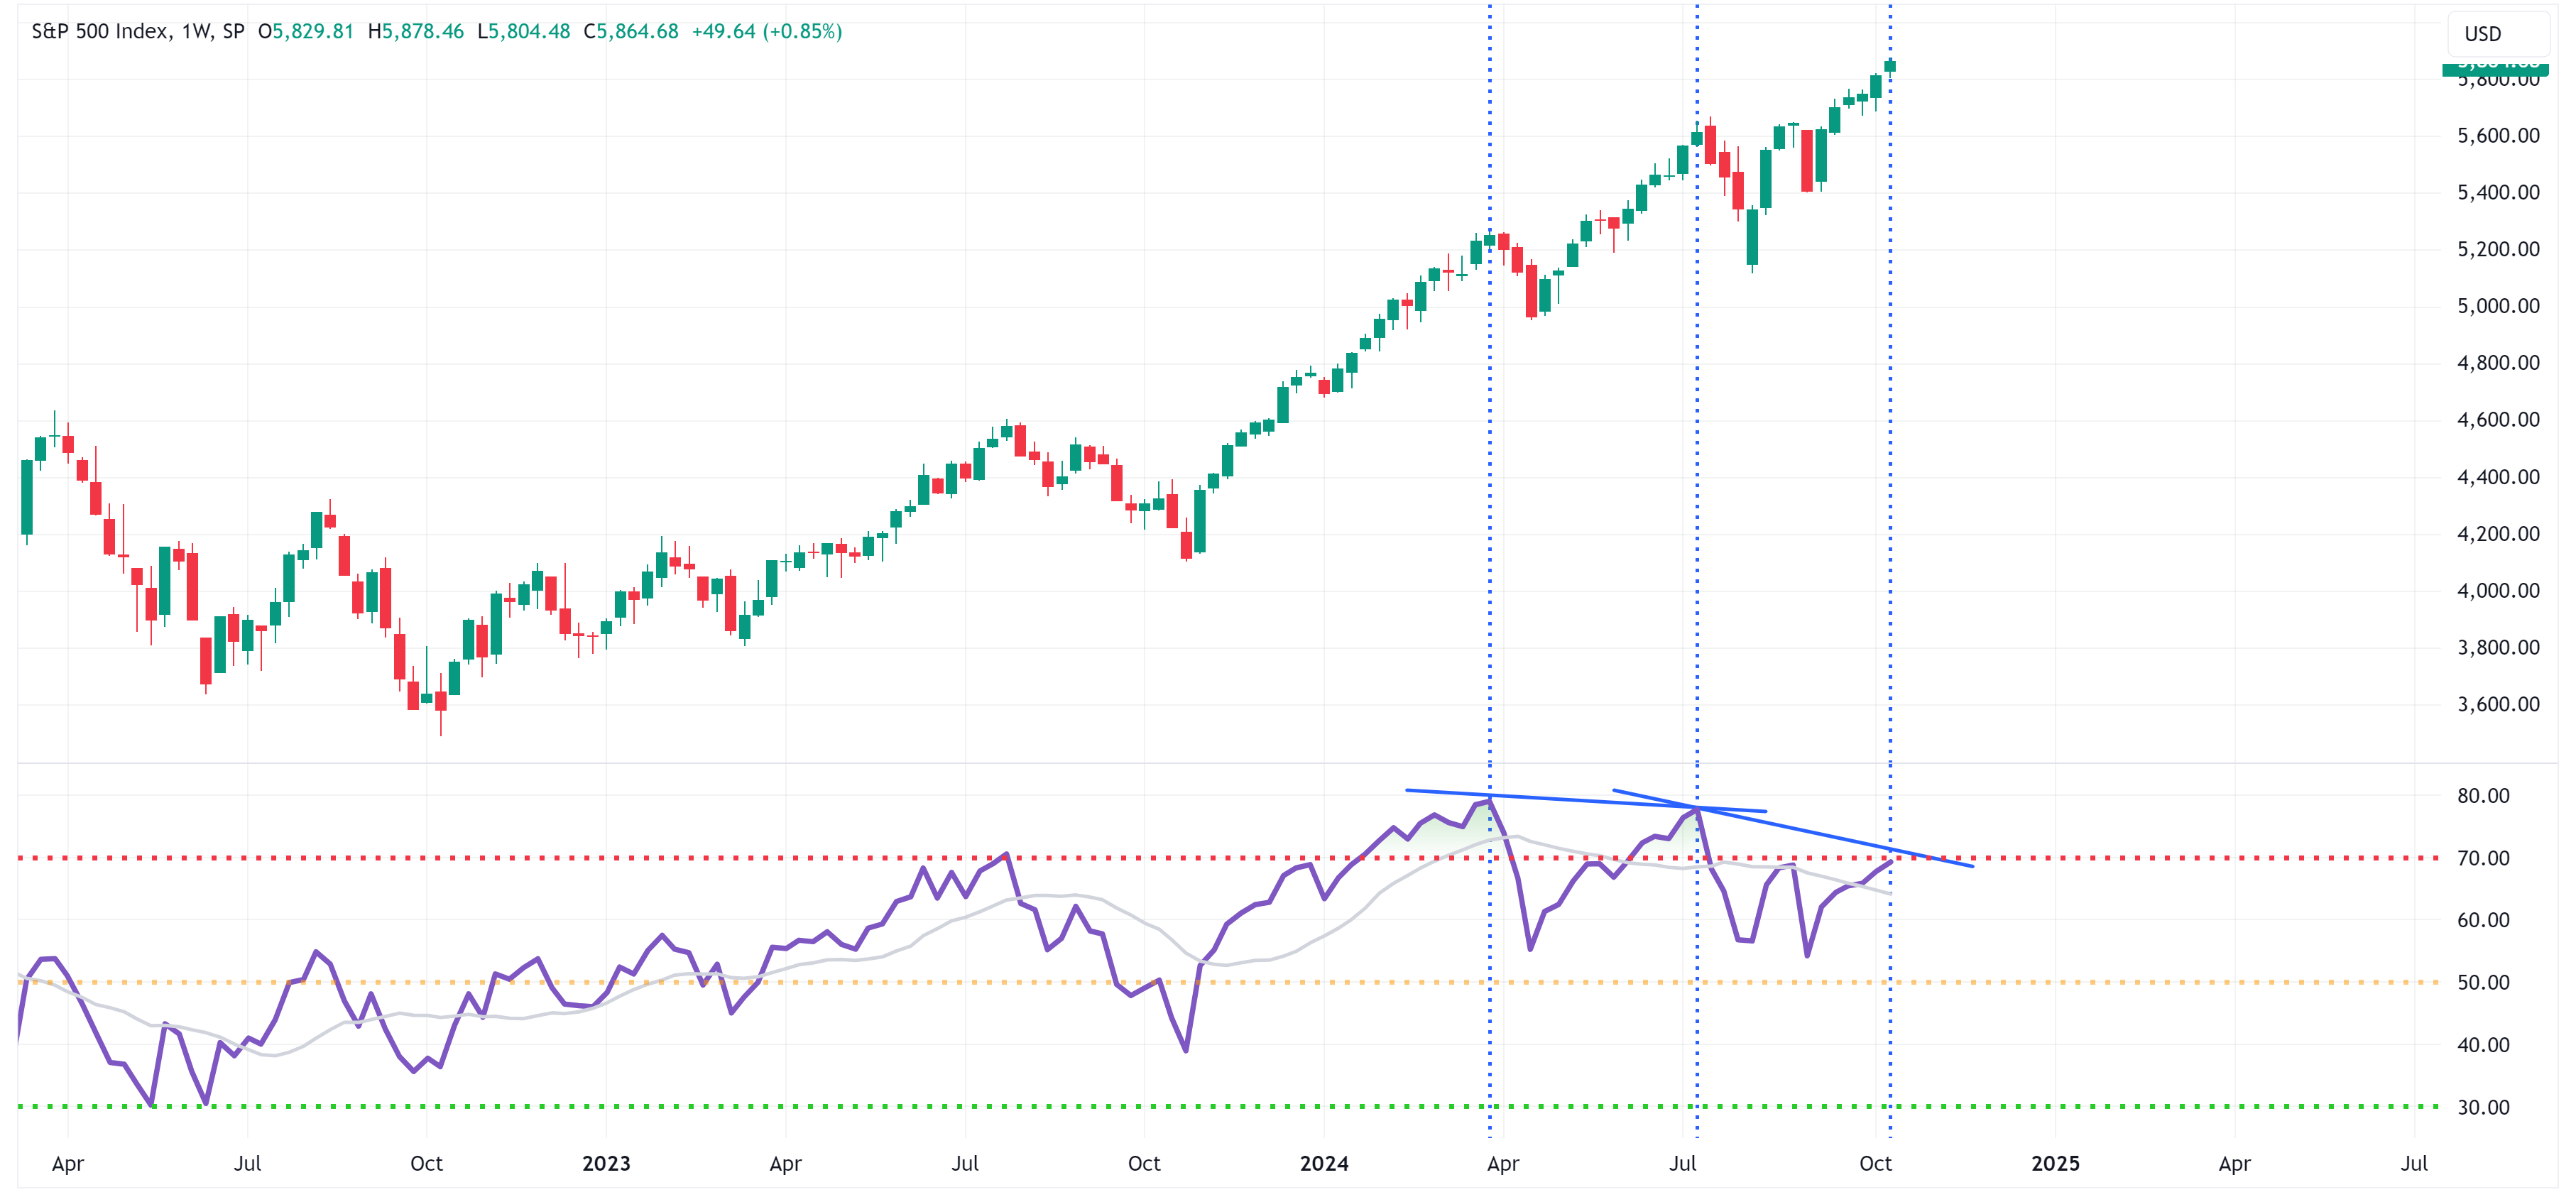
And made the following comments in reference to the chart above and how similar it looks to 2007:
“From a technical standpoint, the “topping pattern” we saw in 2007 was foreshadowed by a negative divergence pattern on the Relative Strength Index (bottom panel).
Fast forward to 2024, and we’re seeing a very similar pattern. It is worth noting that this pattern is not complete and could “bust” but I think it is worth keeping on our radar.”
Well, that pattern did not “bust” (see yellow circle) and instead turned lower similar to how it did in 2007.
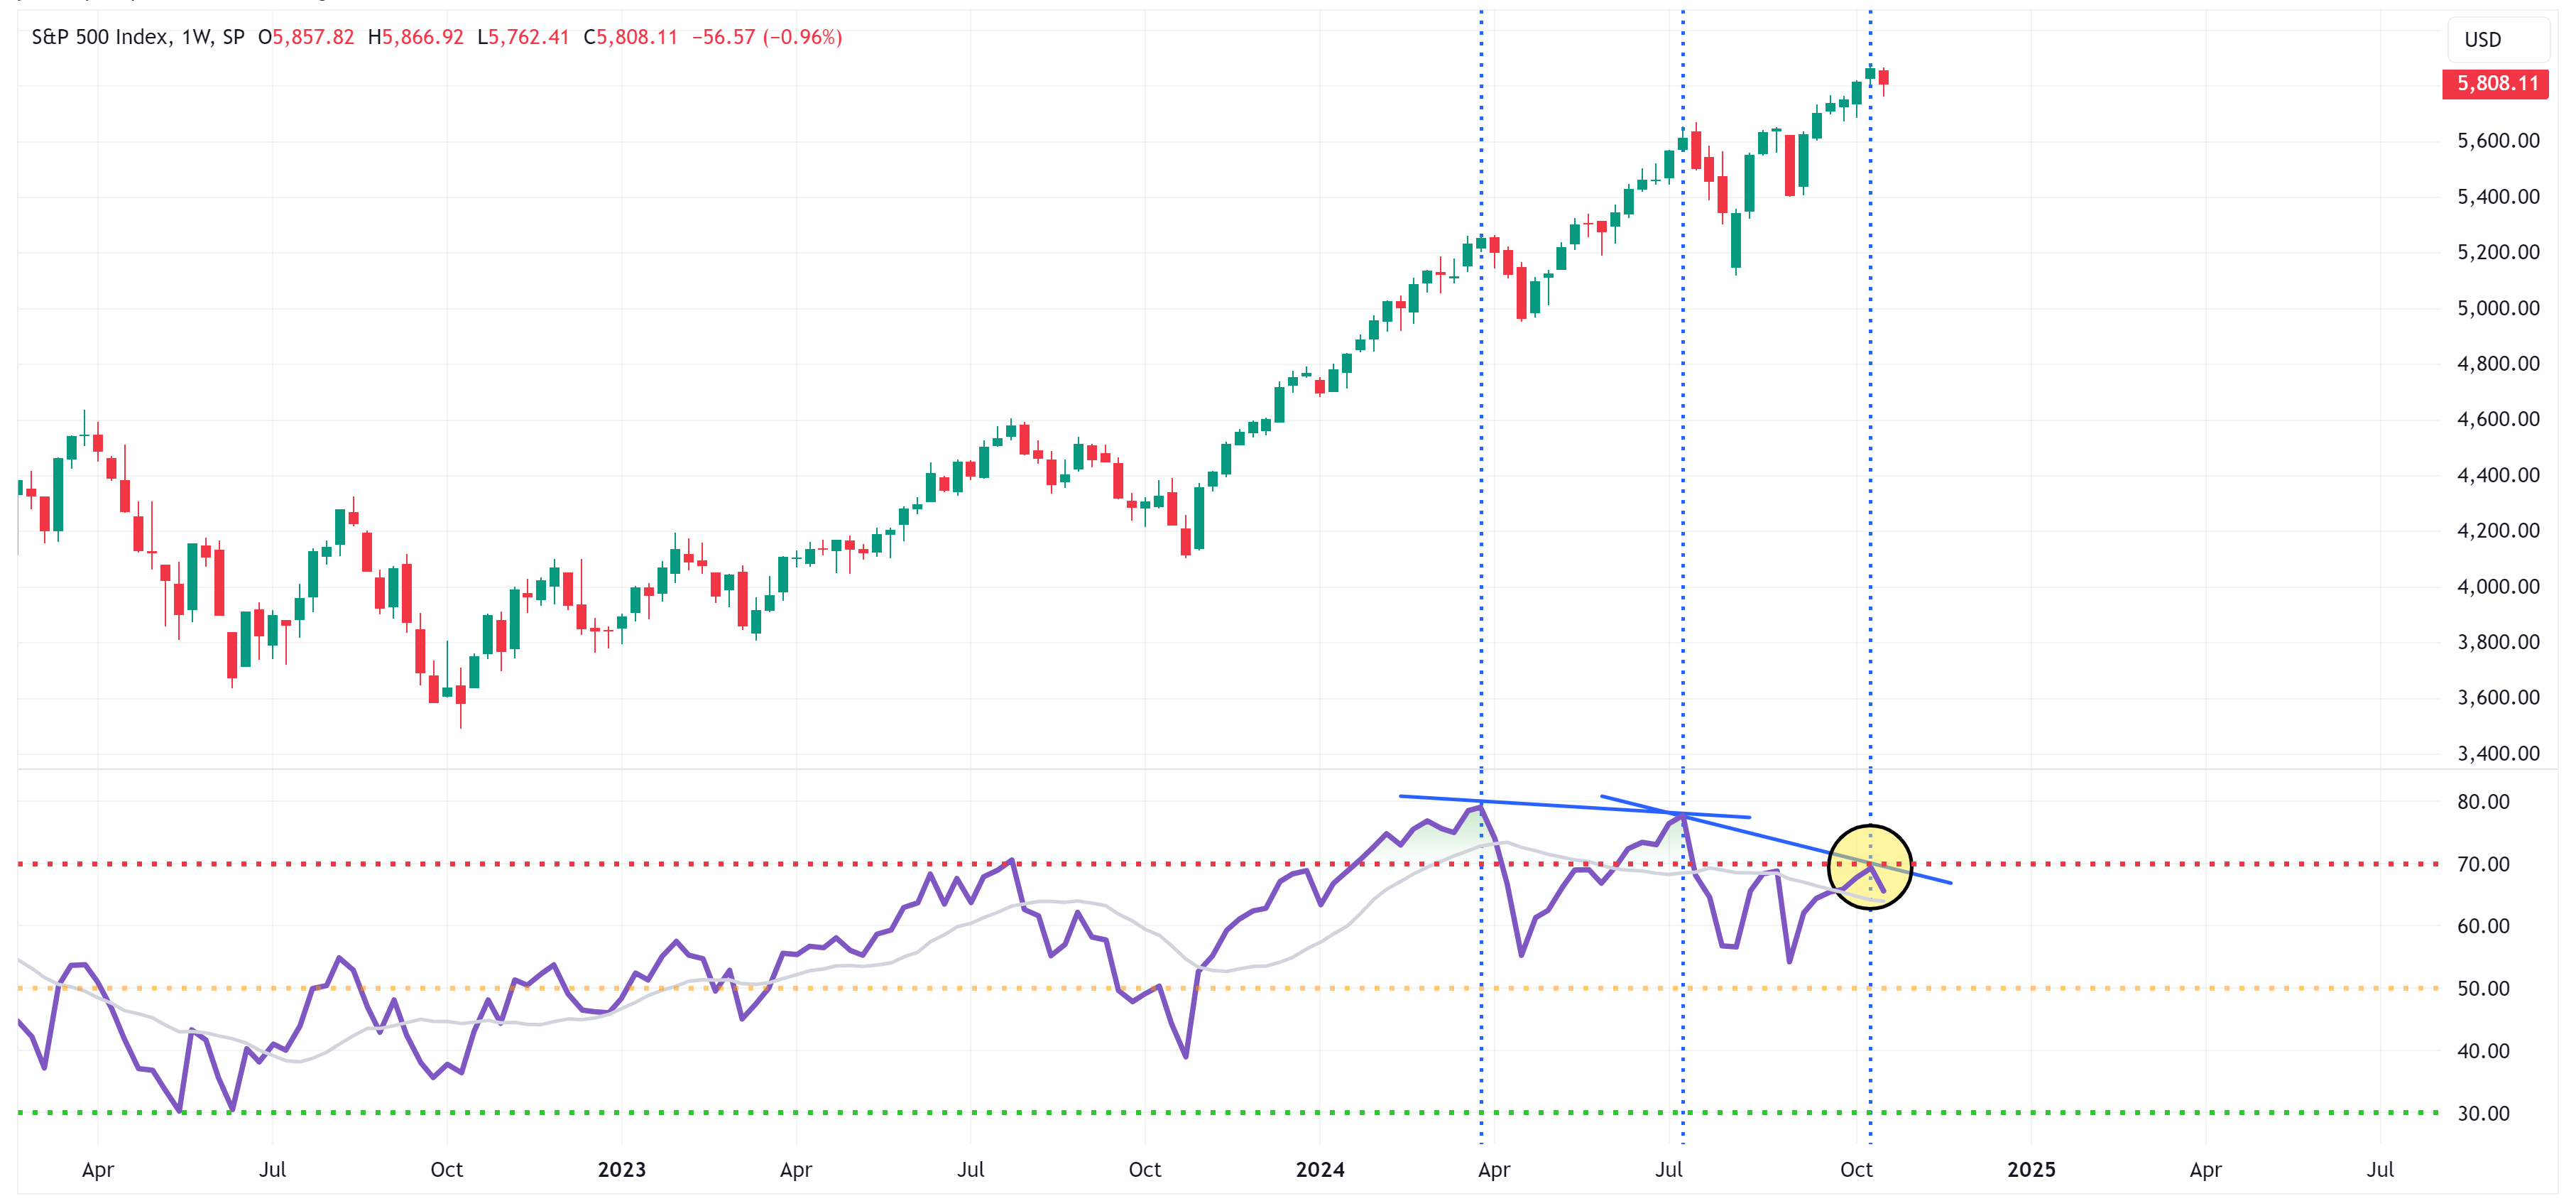
As a reminder, here is the chart from 2007 and recall, October 2007 ultimately became the top of the market which didn’t bottom until March 2009.

Are we destined for a repeat of 2007, I have no idea, but the similarities I highlighted in last week’s newsletter, coupled with the election “uncertainty” highlighted above are enough to have my antenna up.
TLT to ride out the storm?
Long-time readers know I have been a fan of TLT for some time now. With that said, it hasn’t performed all that well since September.
Ironically, or maybe not, we saw similar price action for TLT from September 2007 to October 2007 (see the yellow circle in chart below).
After that (i.e., once the S&P 500 peaked), TLT generally moved with a positive slope through the market lows of March 2009.

Fast forward to today (see chart below), and we have a very similar multi-week move lower from September to October.
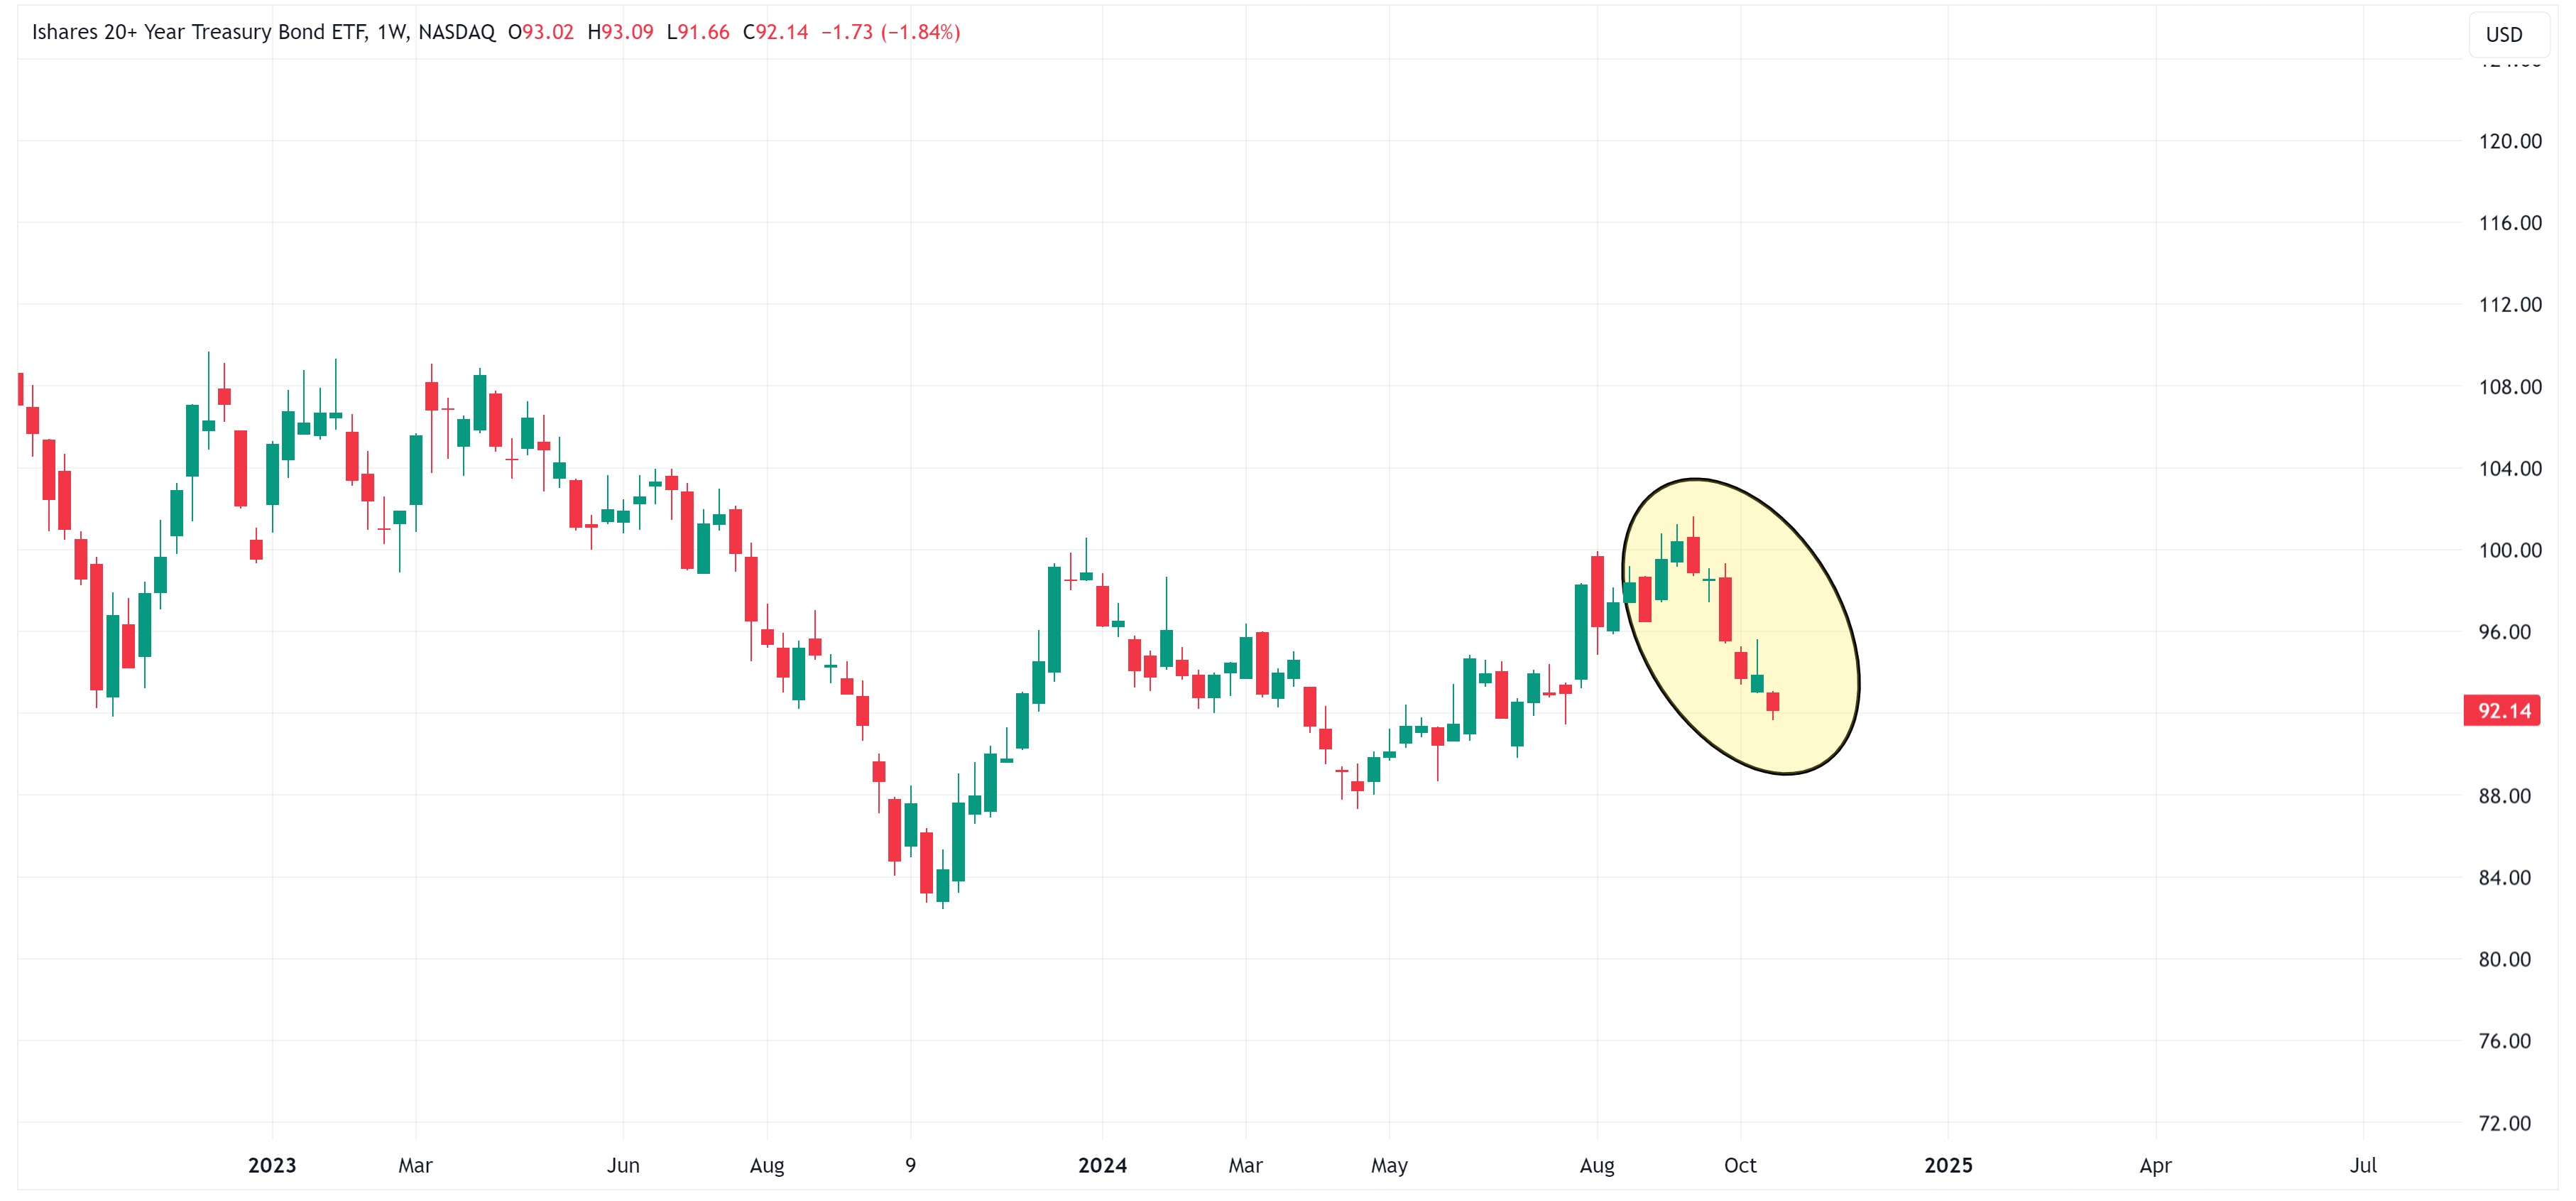
Will TLT move higher in the coming weeks/months/years? Impossible to know but the similarities between 2007 and 2024 continue to stack up.
Keep reading with a 7-day free trial
Subscribe to Skillman Grove Research to keep reading this post and get 7 days of free access to the full post archives.