In the Weekly Chart Review from last week, I noted the following:
“Given the magnitude of the decline last week, I wouldn’t be surprised to see a short-term reflexive rally this week but that is 100% contingent on how the Silicon Valley Bank situation plays out.”
We got our short-term reflexive rally last week as the S&P 500 was up 1.43% for the week.
I went on to say:
“With that said, for it to be a meaningful reversal (i.e., one that has legs to continue), the S&P 500 has to start by closing above the blue trend line…”
You’ll notice in the chart below that the S&P 500 did close above the blue trend line but just barely (note the yellow circle and dashed red lines).
Ideally, you want to see the blue trend line become support which would mean that the weekly price action never trades below the blue trend line and instead bounces off it every time it gets close.
Regardless, we closed above the blue trend line so you have to call this a win for the bulls as it pertains to the weekly chart.
The other thing I noted in last week’s post was:
“Further, the S&P 500 needs to negate the current H&S pattern by closing above the right shoulder…In a situation like this, it is not uncommon to see a rally back to the neckline before heading lower again so watch for that potential outcome over the next week or two.”
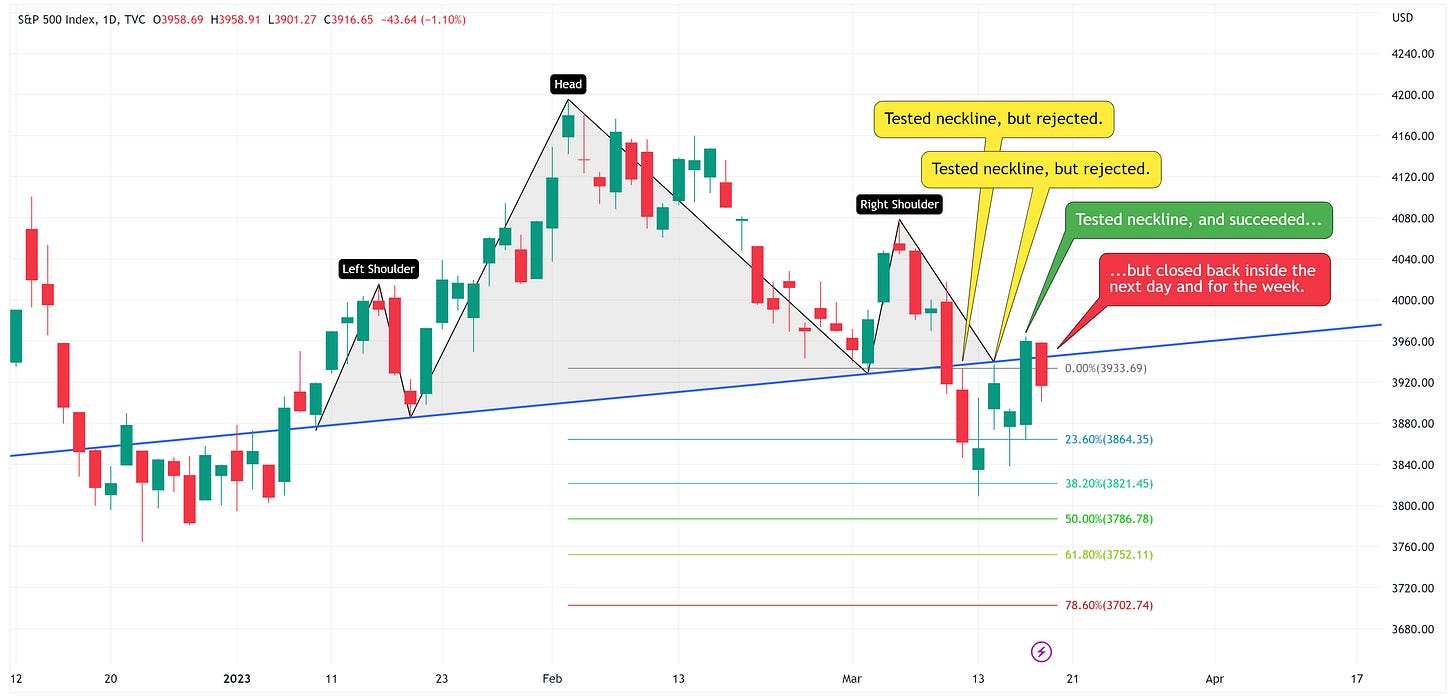
Recall, we turned to the daily chart (see below) to analyze the H&S pattern.
Notice how the neckline continues to provide resistance and the one time it was breached, the S&P 500 traded back inside it the very next day. Ideally, you want to see the neckline breached and then have it become support going forward. Thus far, that has not happened so this is a net negative for the bulls.
Putting it all together, on the weekly chart we have a close just above the blue trend line (net positive), and on the daily chart, we have a neckline that is giving us trouble (net negative).
What do we do with these conflicting reports? This is where I like to look at the weekly Heikin Ashi chart to see what the overarching trend is telling us.
Note that last week’s candle did not have an upper wick. This would suggest that the overarching downtrend remains strong and/or is gaining strength. Further, note that last week’s candle closed inside the blue trend line thus suggesting that the trend line did not provide support which opens the door for a further move lower.
I would reiterate what I said last week in reference to the weekly Heikin Ashi chart:
“At a minimum, I would wait for a “green candle” on the Heikin Ashi weekly chart before I considered getting long again.”
With that said, there are pockets of strength in various places.
US Treasuries rallied across the curve last week. This has set up what appears to be a nice inverse H&S pattern for TLT. With that said, the FOMC meets this week which has the ability to dramatically change the outlook for US Treasuries so be mindful of this event.
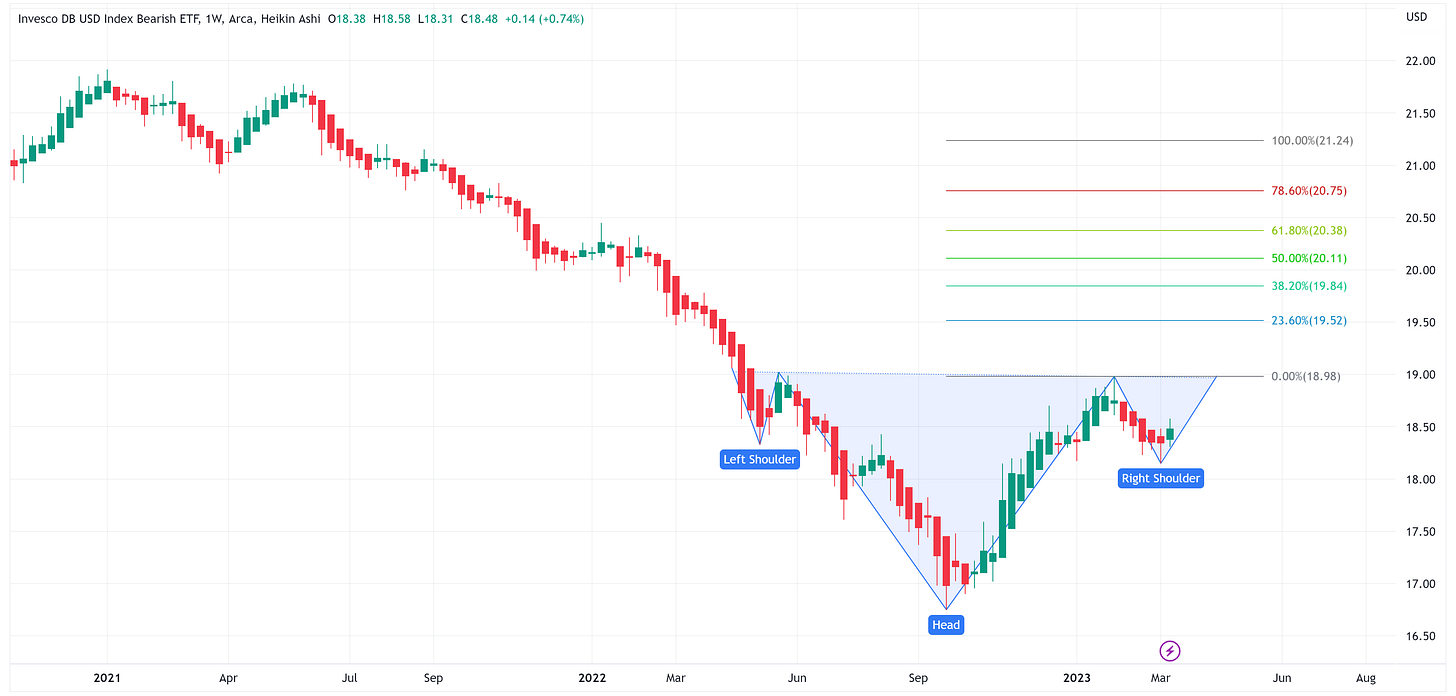
It may be a little early, but the weakness in USD is providing a nice potential setup for an inverse H&S pattern for UDN.
Gold appears to be forming a multi-year “Cup & Handle” that if fulfilled calls for a target of ~2,912 or ~45% higher than current levels. We’ve had a couple of false breakouts in the past so don’t get too excited, too early.
Lastly, falling US Treasury yields often lead to a rally in the technology sector. If we look at QQQ, we see several bullish signals (see chart below).
With that said, don’t overstay your welcome on this potential rally as we saw a very similar occurrence after the Bear Stearns failure in 2008 (see below) where QQQ rallied by 23.29% only to decline by -50.50% shortly thereafter.
As I noted in my recent piece on the anniversary of the Bear Stearns failure, it’s not uncommon to have pockets of short-term rallies after an event like Silicon Valley Bank’s failure but be mindful of the fact that these bank failures (will Credit Suisse fail this weekend?) are signs that things are starting to “break” and suggest the lows have not been established for this cycle.


