
Weekly Chart Review
Inflation Expectations...

Hey everyone, it’s Jim.
I hope you had a great weekend!
Let’s jump right into this week’s newsletter…
In this week’s newsletter:
Stay Informed
Key Macro Events From Last Week (ICYMI)
Key Macro Events To Watch This Week
The Market Map
S&P 500
Deep Dive
Inflation Expectations…
S&P 500 Fair Value Model
The Market Map - Extended Analysis
Major US Indices
11 Major US Equity Sectors
US Treasuries
Currencies
Commodities
Fixed Income
Stay Informed
Key Macro Events From Last Week (ICYMI)
Here are the key data releases from last week:
📈 Consumer Price Index (CPI) – June (released July 15)
Headline CPI rose 0.3% month-over-month, increasing further from the modest 0.1% increase in May. June’s release was the largest monthly gain since January, driven by housing and energy costs. (Link)
Year-over-year inflation climbed to 2.7%, up from 2.4% in May and slightly above the 2.6% consensus forecast. (Link)
Core CPI (excluding food & energy) rose 0.2% MoM, versus 0.1% prior, with noticeable pass-through effects from new tariffs—rising prices in household goods and appliances. (Link)
🏭 Producer Price Index (PPI) – June (released July 16)
Final‑demand PPI was flat MoM, moderating from a 0.3% increase in May. (Link)
Core PPI (less food, energy & trade services) also unchanged, after a modest 0.1% rise in May; annual PPI advanced 2.3% YoY.
Goods prices were supported by higher energy and communication equipment costs, while service inflation eased slightly.
🛍 Retail Sales – June (released July 16)
Retail sales surged 0.6% MoM, rebounding from a decline in May, signaling continued consumer strength. (Link)
Johnson Redbook data showed a 5.2% YoY increase in year-to-date July sales, supported by strong e-commerce and post–Prime Day promos. (Link)
📄 Jobless Claims (week ending July 12, released July 17)
Initial jobless claims fell by 7,000 to 221,000, well below expectations (~235,000), indicating stable labor market conditions. (Link)
Continuing claims edged up to 1.956 million, hinting that hiring remains cautious in some sectors. (Link)
Despite overall strength, manufacturing layoffs ticked higher, partly due to trade policy uncertainty.
🧠 University of Michigan Consumer Sentiment – July (preliminary, mid‑July survey)
Sentiment rose to 61.8, its highest in five months (June: 60.7), yet still ~16% below December 2024 levels. (Link)
Year‑ahead inflation expectations declined to 4.4%, and long-term expectations dropped to 3.6%—both lowest since February. (Link)
Concerns over tariffs and inflation tempered confidence gains, though some easing of these worries was noted. (Link)
🔍 Additional market-moving story: Housing Starts & Manufacturing
Housing starts rebounded 4.6% in June, suggesting resilience in residential construction.
Empire State Manufacturing Index jumped to +5.5 in July from -16 in June, a strong sign of improving factory sentiment.
Taken together, the data suggest a resilient U.S. economy: inflation remains moderately elevated, consumer spending is strong, and the jobs market is steady.
Key Macro Events To Watch This Week
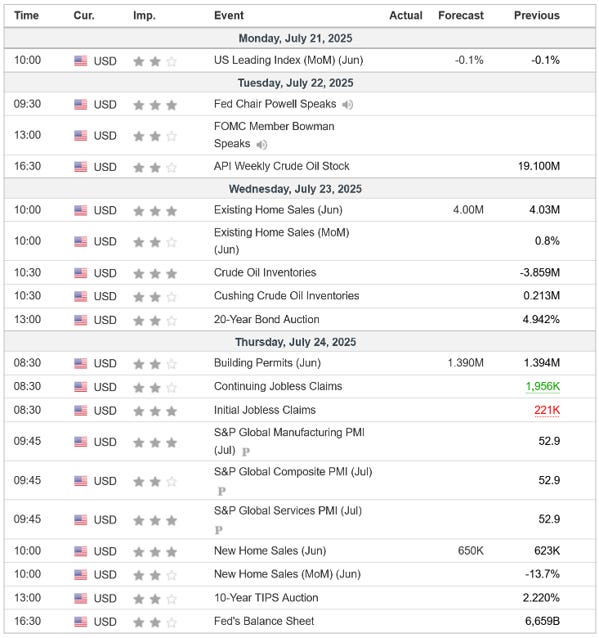
Here are the most important U.S. economic data releases for July 21–25, along with why each matters:
📊 Monday, July 21 – Leading Economic Indicators (June)
The Conference Board’s index gives an overall gauge of economic momentum.
Helpful for anticipating recession risk or acceleration in the business cycle.
📊 Tuesday, July 22 – Richmond Fed Manufacturing Index (July)
A key regional snapshot of factory sector health in the Fifth Federal Reserve District.
May signal early trends ahead of national PMIs—any surprise strength or weakness could sway market expectations for manufacturing momentum.
🏠 Wednesday, July 23 – Existing Home Sales (June)
Measures closed sales of previously owned homes, reflecting consumer confidence and interest-rate sensitivity in housing.
After recent housing resilience, a dip or rally here could impact forecasts for residential construction and inflation.
🏡 Thursday, July 24 – New Home Sales (June)
Complements existing‑home data by capturing builder activity and future residential investment.
Strong or weak months help gauge the housing market’s contribution to GDP and inflation trends.
🛠 Friday, July 25 – Durable Goods Orders (June, Preliminary)
A leading indicator for business investment in equipment and machinery.
Vital for understanding capex trends and whether inflation is broadening into more economic sectors.
🗣 Other Events to Watch
Tech Earnings & Fed Speech: Though not data releases, investors will also monitor Tesla and Alphabet Q2 earnings, and a speech from Chair Powell on bank regulation—signals that could alter sentiment before the Fed’s July 29–30 meeting.
The Market Map - S&P 500
We use this section each week to “Map the Market” using our proprietary, systematic methodology to gauge a) the current trend of the market and b) where the market may be heading over the medium term.
Most of our readers are longer-term investors, so we focus on the weekly charts; however, our methodology can be used on any timeframe.
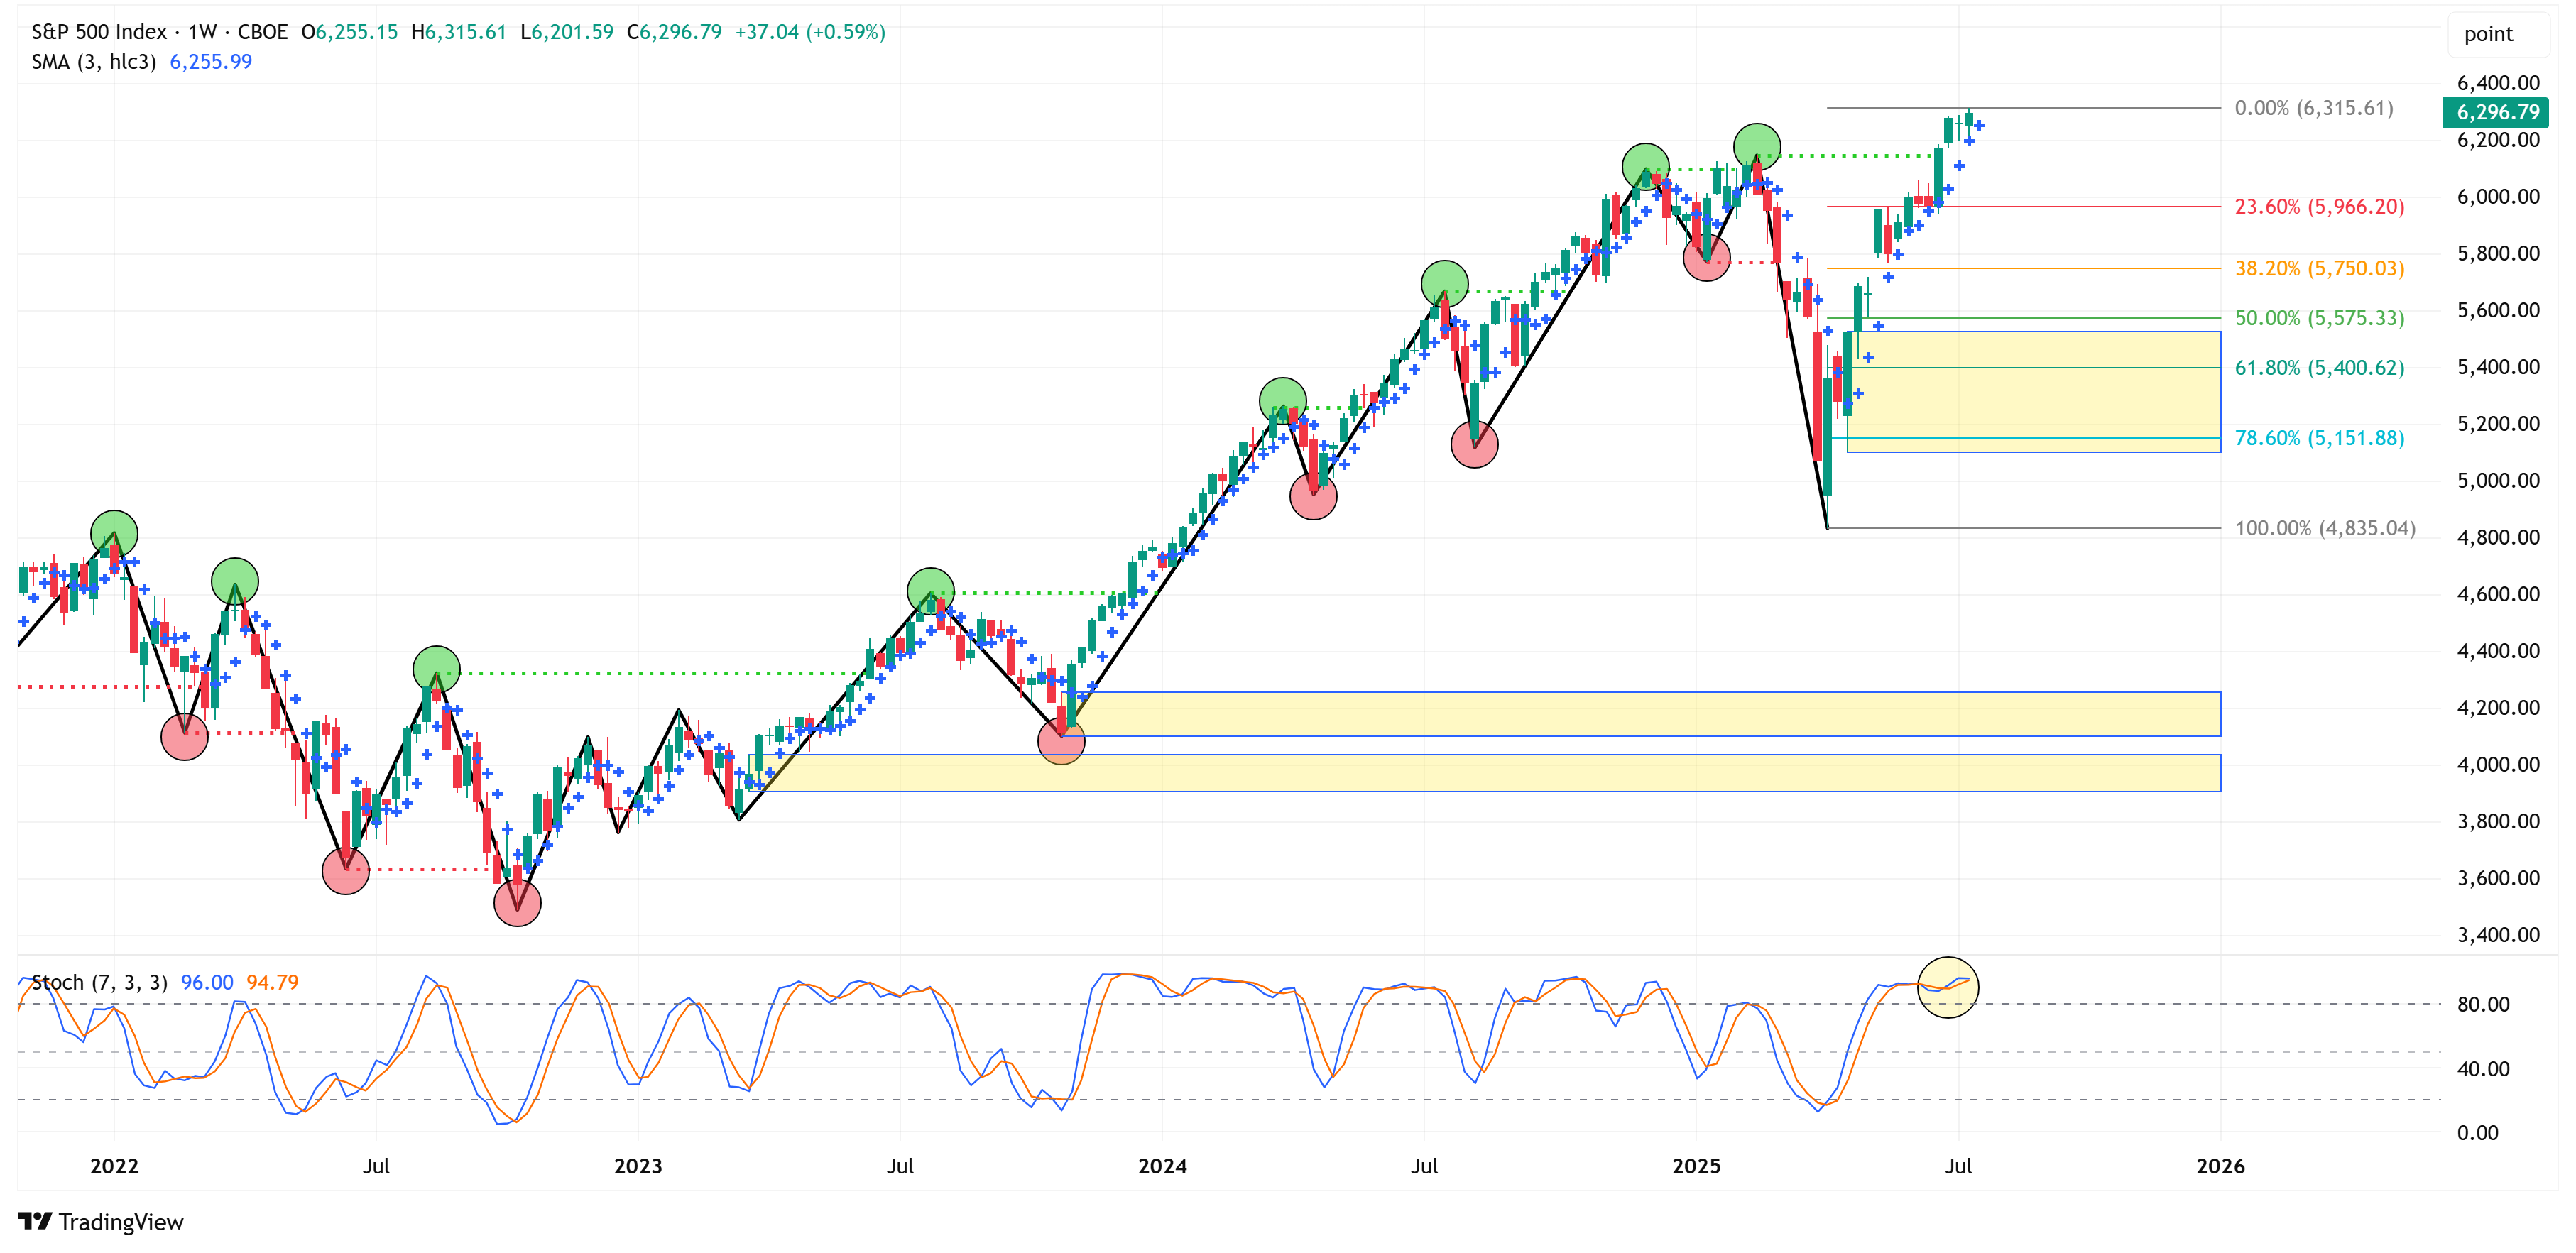
Let’s start by looking at the weekly chart.
The S&P 500 ended the week higher by 0.59% after trading at new all-time highs intra-week.
The weekly chart remains bullish.
As we discussed last week, the first sign of weakness for the S&P 500 will be when we get a weekly close “below the dot”. For this week, that would mean a close below 6,255.99.
Until this happens, the assumption is a continued move higher.
Let’s turn now to the 4-hour chart to see if we can get an early look at any possible trend changes.
So far, the trend remains bullish, but a close below 6,201.00 would shift the trend to bearish on the 4-hour chart.
It is also worth noting that the bottom panel stochastic has started to roll over. The last two times this happened (yellow circles), the downturn didn’t amount to much, but it’s certainly not as encouraging as the move higher from oversold conditions like we saw in the two green circles back in May and June.
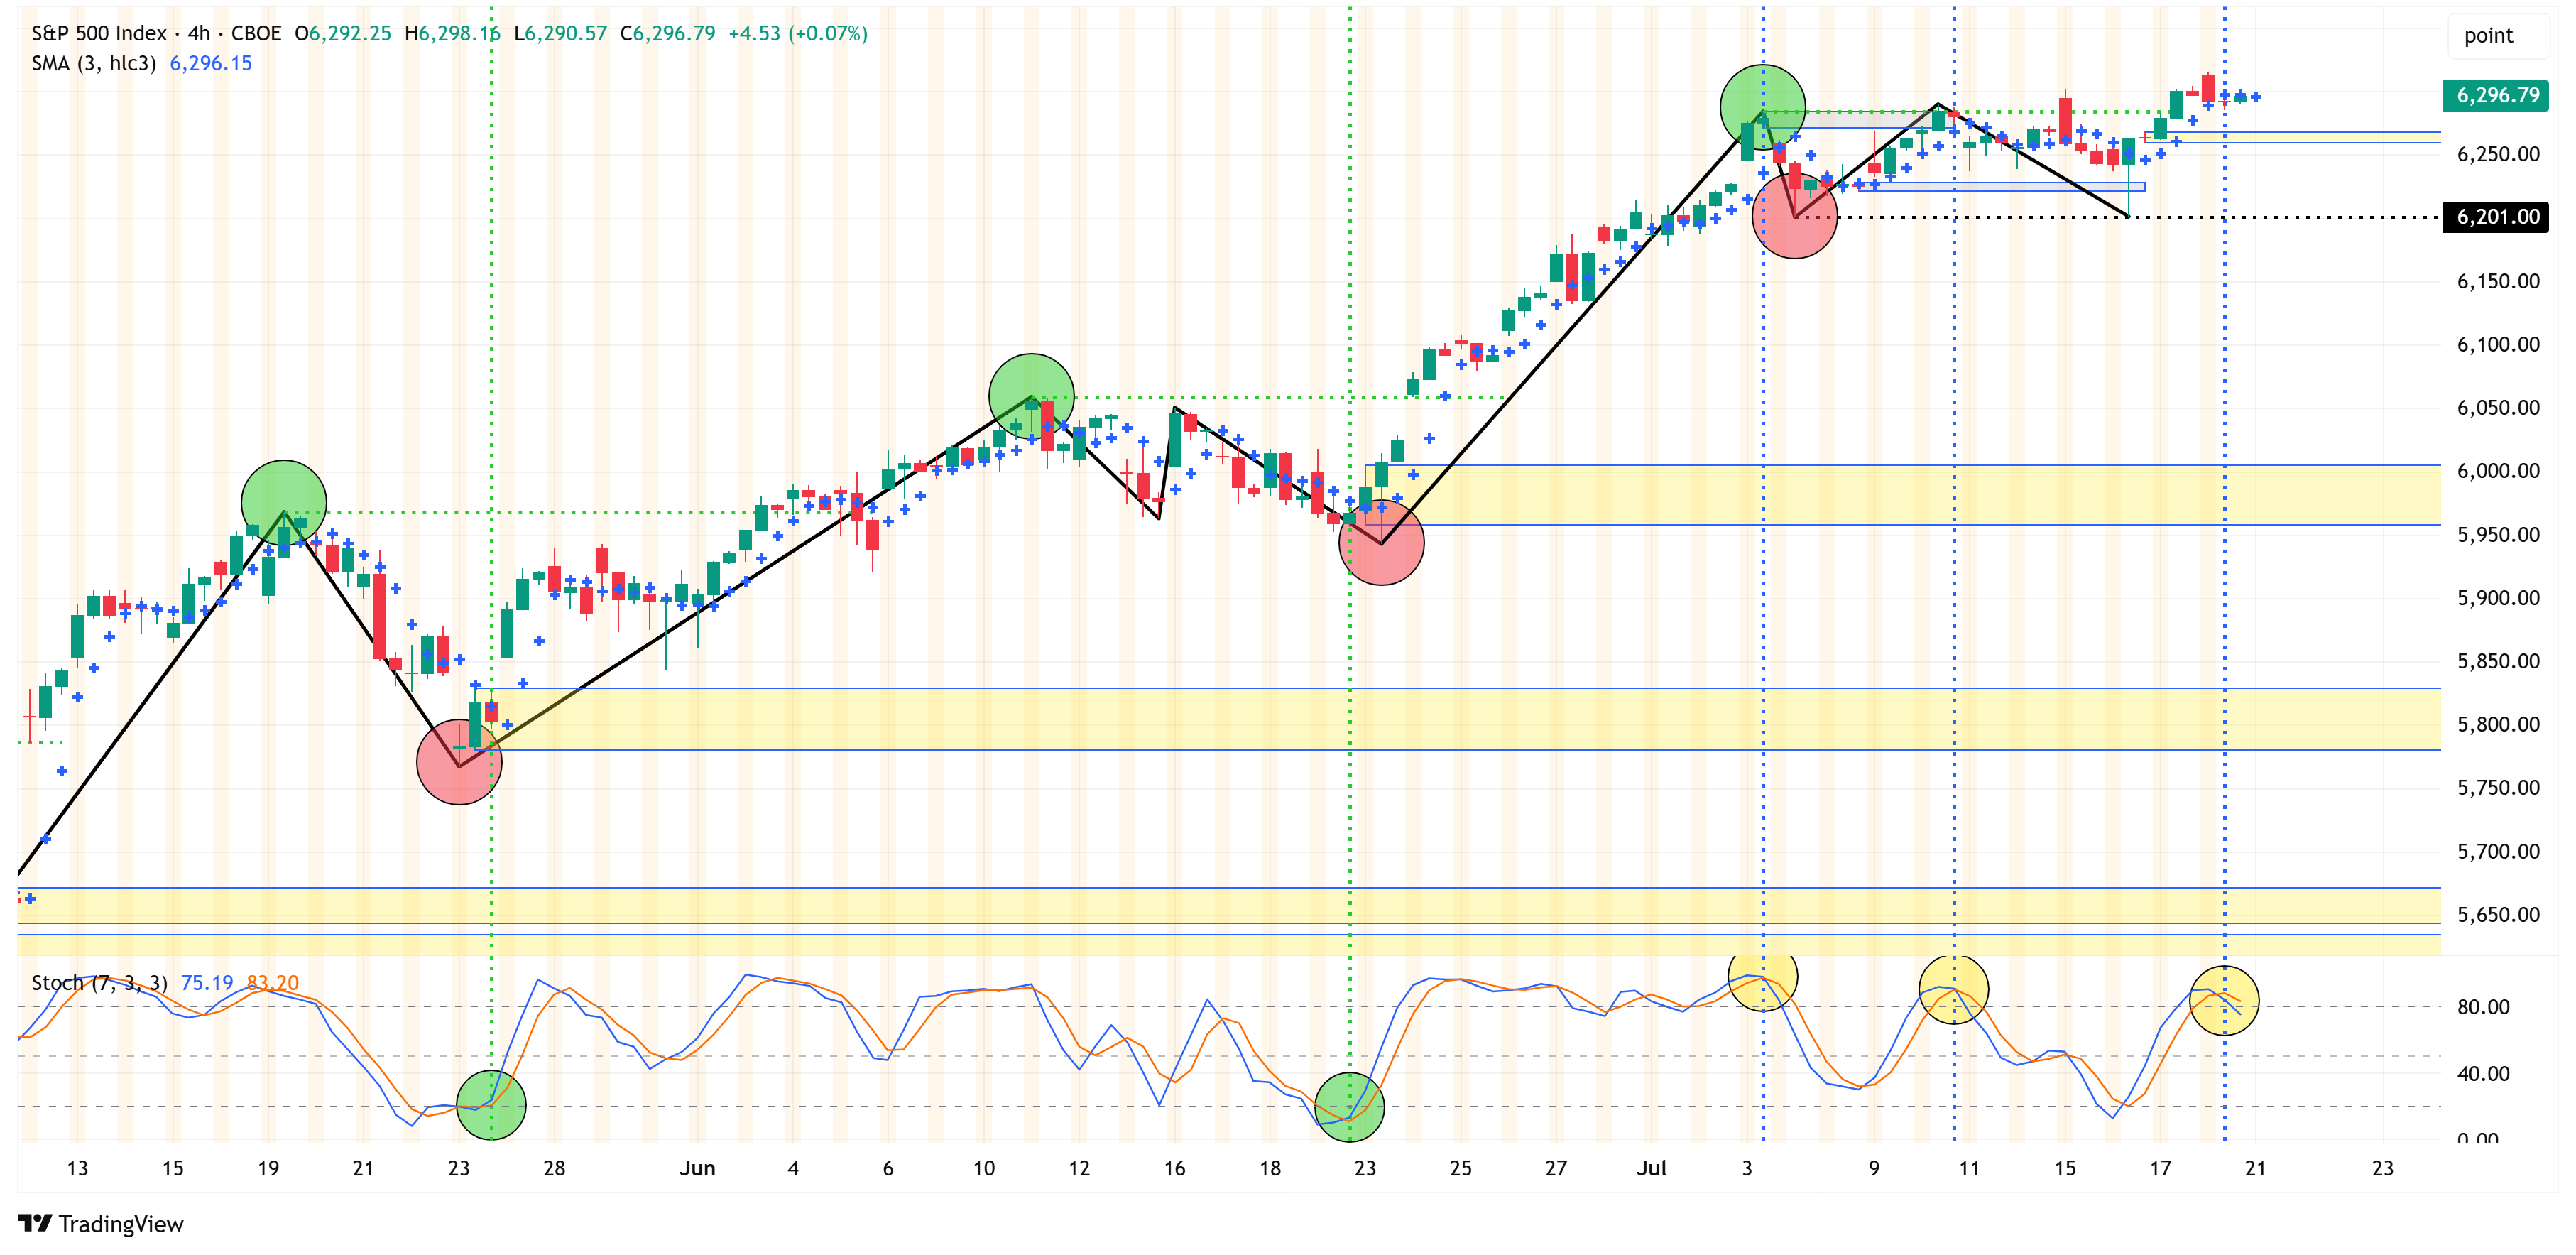
To summarize, the S&P 500 remains bullish on both the 4-hour and weekly charts. However, a close below 6,201.00 on the 4-hour chart and a weekly close below 6,255.99 will begin the shift towards a more corrective turn in the market.
Deep Dive
Inflation Expectations…
Coming into last week, everyone was focused on CPI as our most recent gauge of inflation expectations.
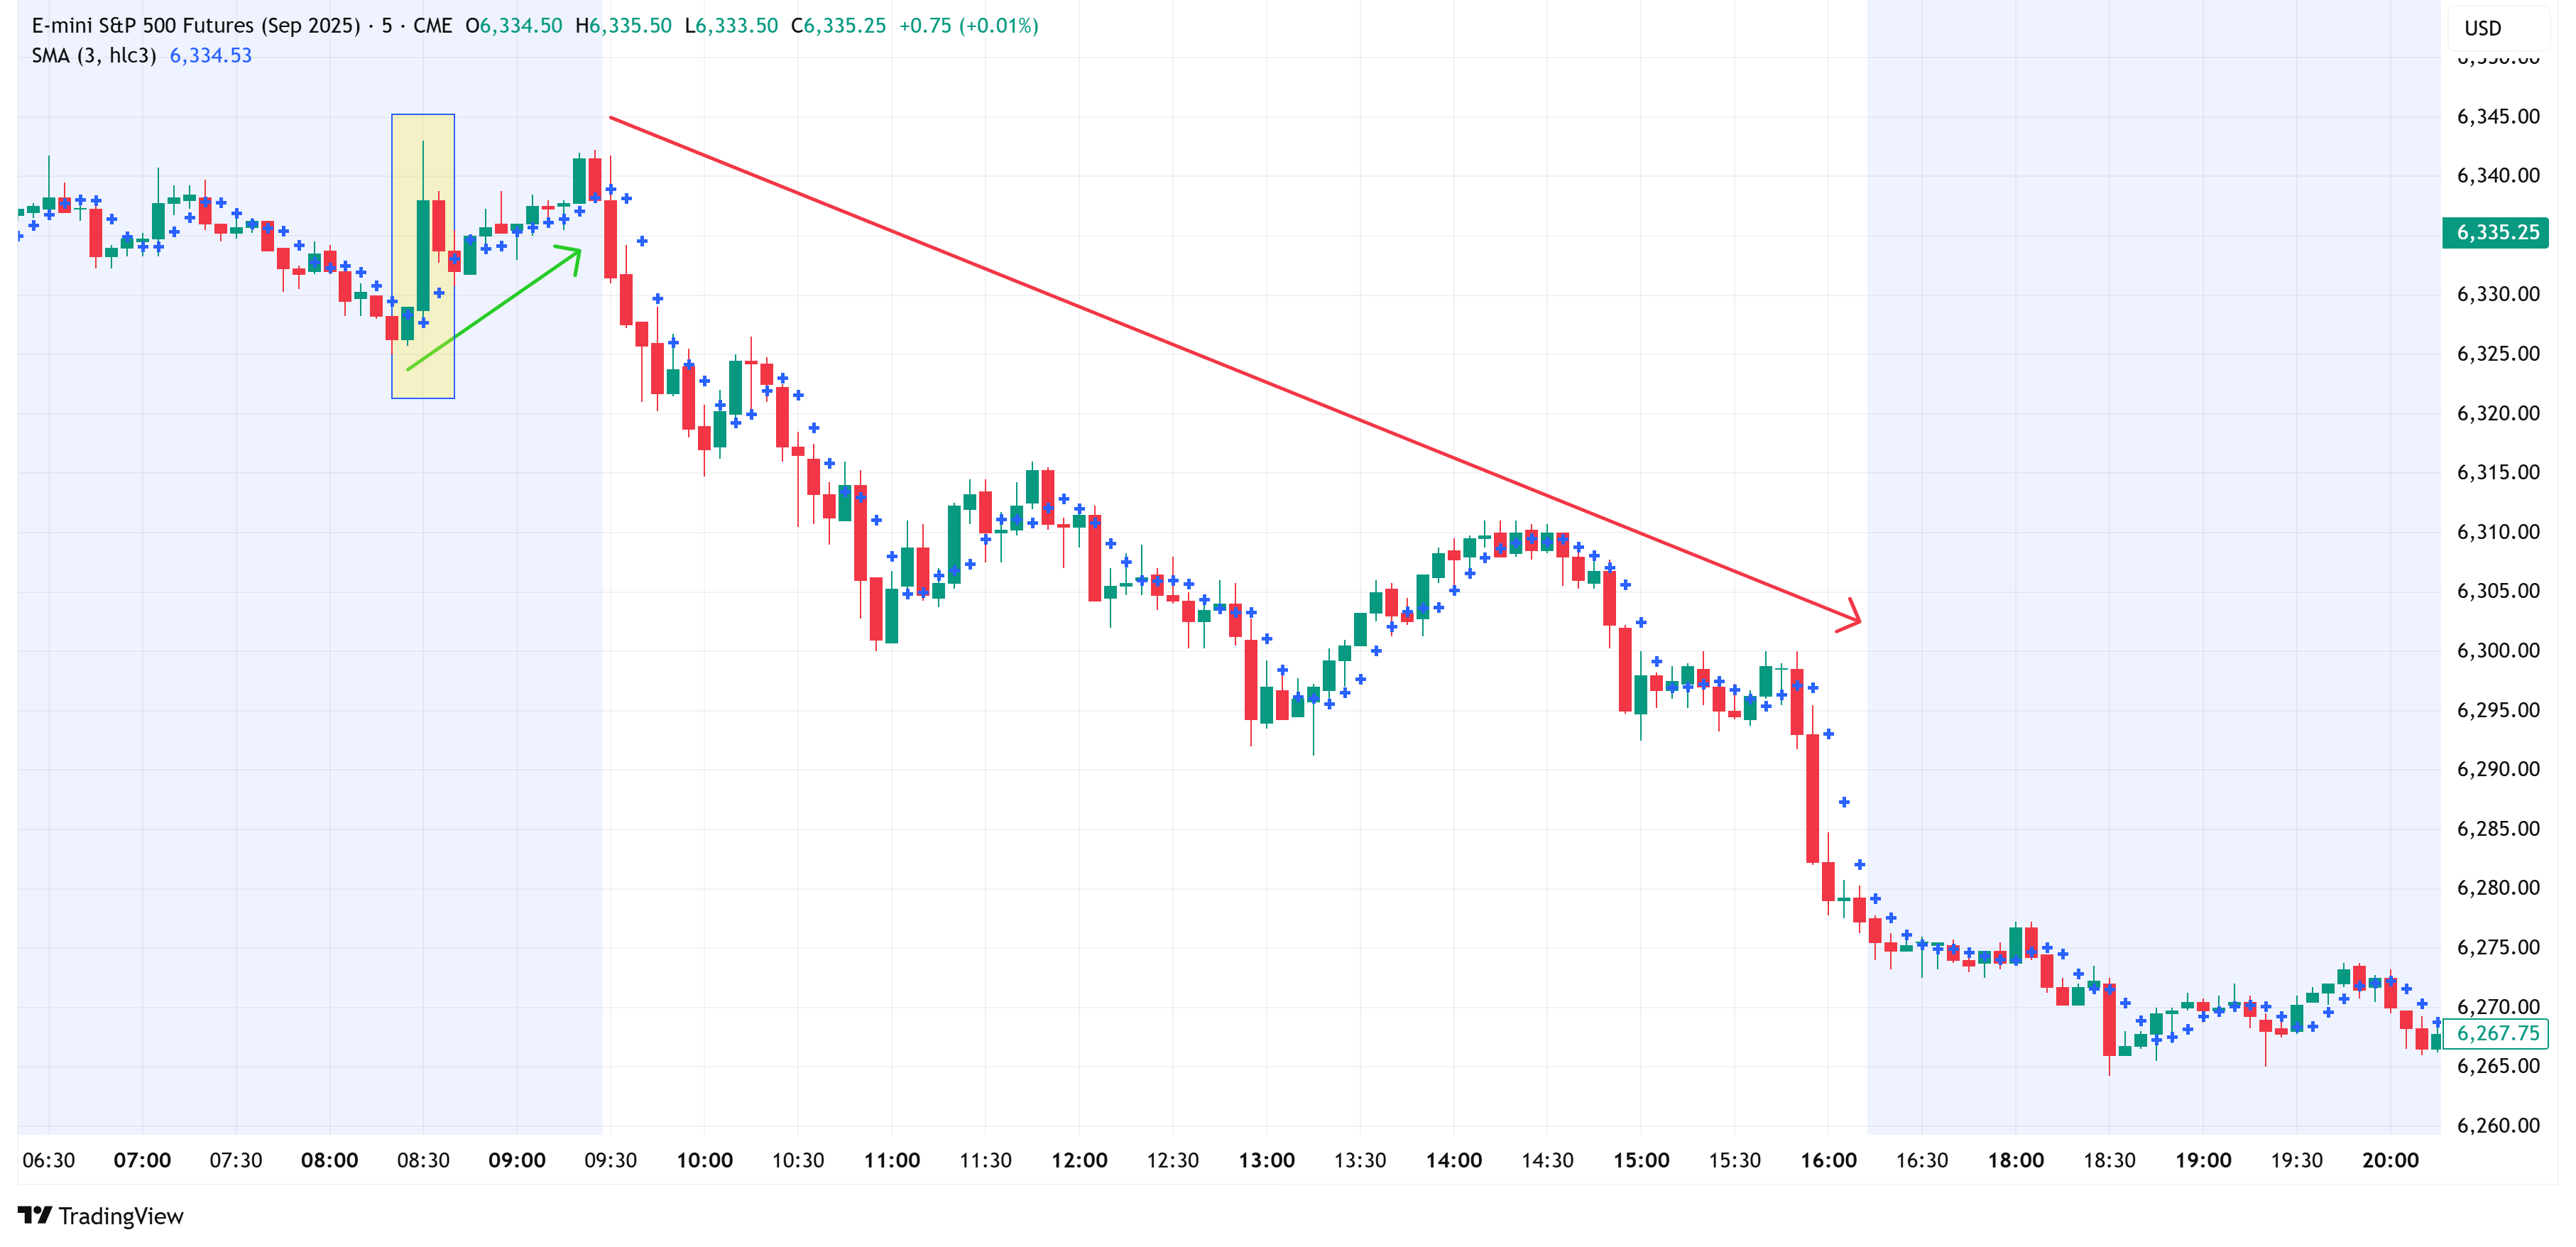
On Tuesday, headline CPI for June came in at 2.7% vs. an expectation of 2.6% and higher than May’s reading of 2.4%.
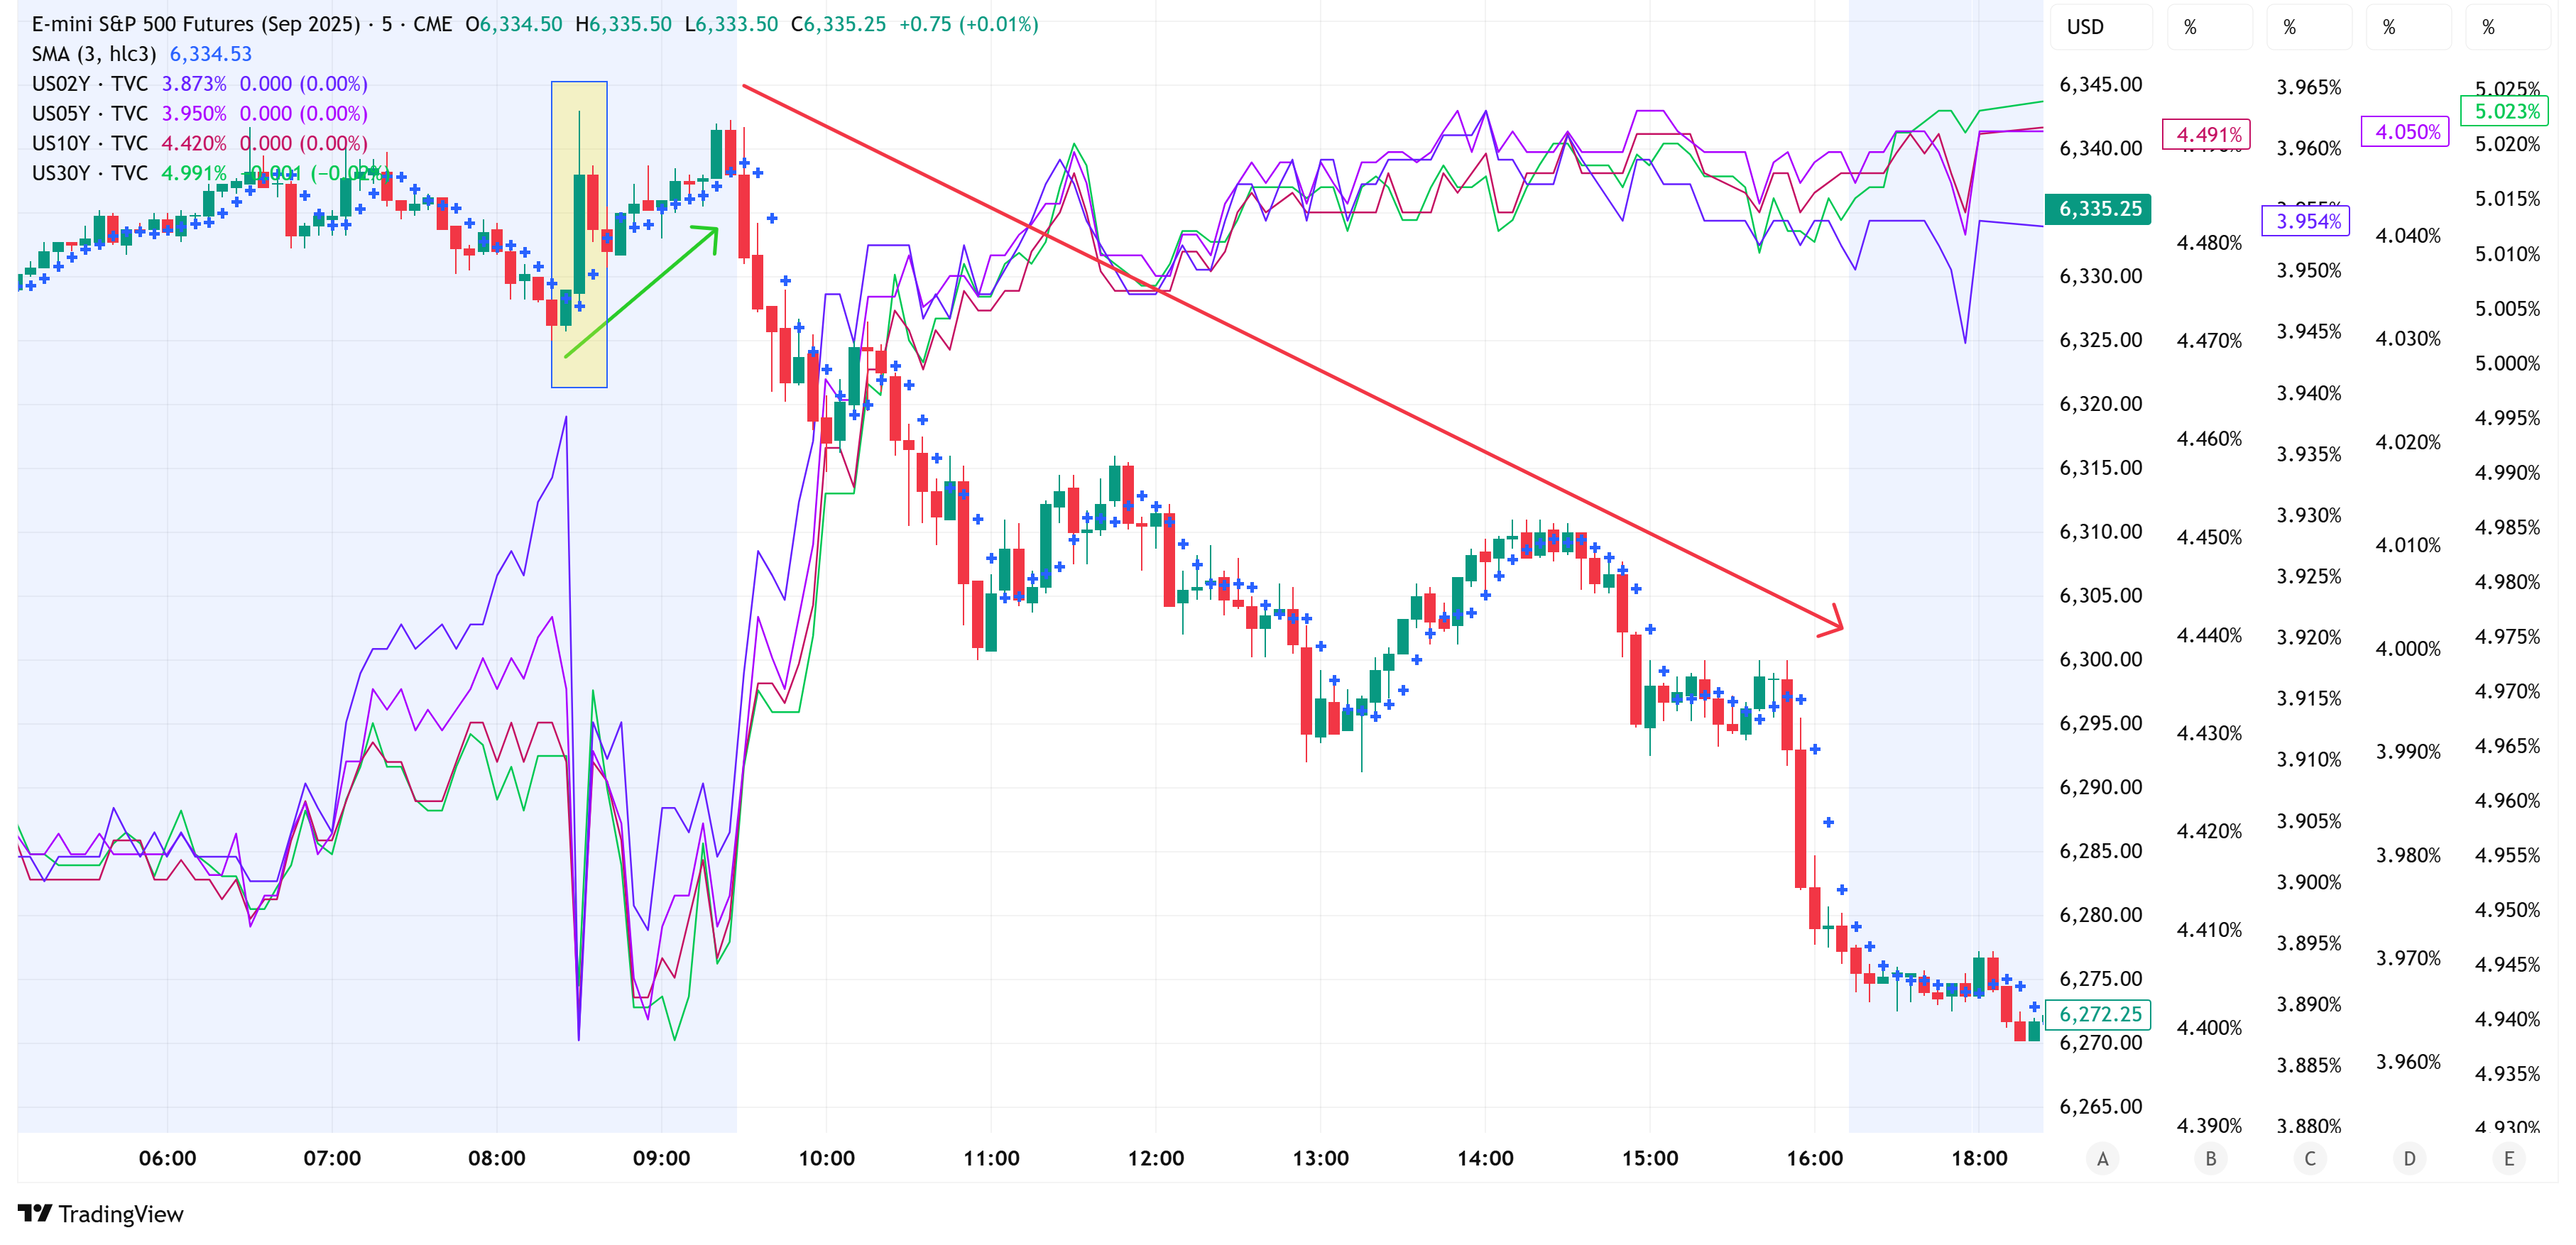
You can see below in the 5-minute chart of S&P 500 futures that the market initially “spiked” at 8:30 am ET when CPI was released, but then spent the rest of the day moving lower once the cash market opened.
Here is the same chart as above, but I’ve overlaid the 2-year, 5-year, 10-year, and 30-year US Treasury yields.
We can debate whether the move in treasury yields is material or not, but the takeaway is that the entire curve shifted higher after the CPI news.
Here’s where things get more interesting (complicated).
On Wednesday, around 11:15 am, reports hit the wires that Trump had drafted a letter to fire Federal Reserve Chairman J. Powell.
Equities immediately sold off, while US Treasury yields (especially the longer end of the curve) moved higher (the chart was too messy to include the treasuries here).
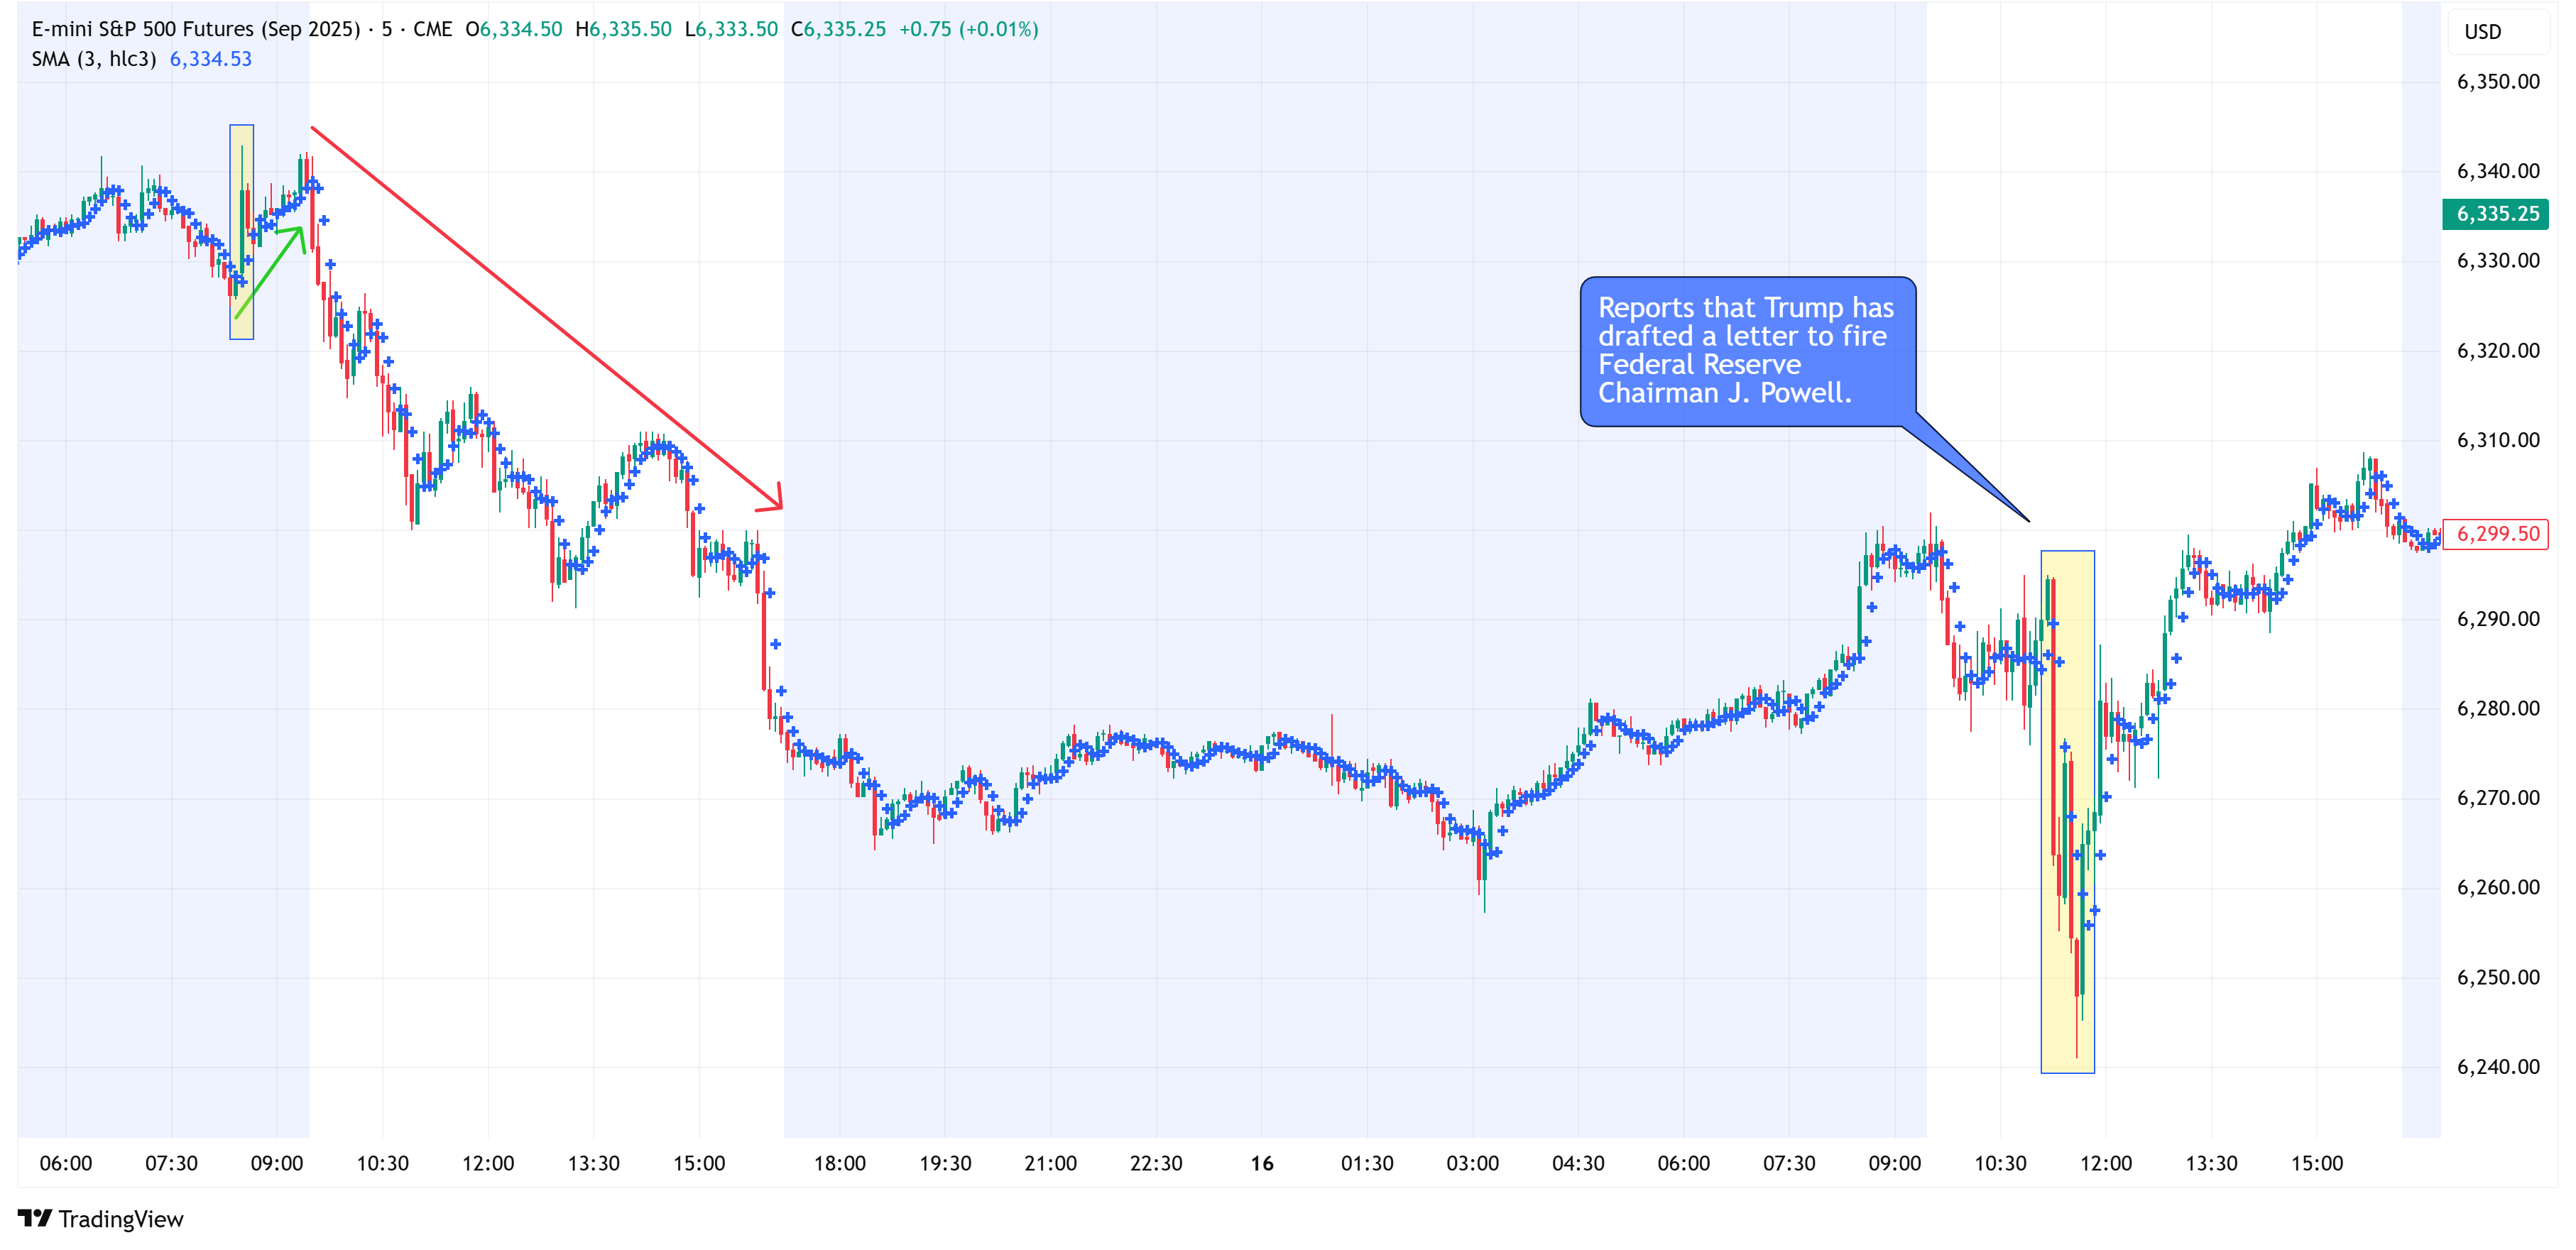
The move lower in equities and higher in treasury yields quickly reversed after White House officials denied the report.
I’m a firm believer that the White House (current and past administrations alike) will “float” an idea to the press to see how markets will react.
If negative, they will walk it back; if positive (or neutral), they may proceed with the plan.
In this case, the move was quickly perceived as negative for both equities and bonds, and hence, they walked it back.
So, what is the read-through?
Very simply, I think the market believes that if Powell is fired, the Trump administration will immediately install someone who will cut rates, and the market is interpreting that as an inflationary outcome (read negative for equities as well).
If we look at the 5-Year, 5-Year Forward Inflation Expectation Rate, we can see that inflation expectations have been increasing since “Liberation Day” on April 2nd.
The 5-Year, 5-Year Forward Inflation Expectation Rate is a market-based measure of expected inflation. It represents the average expected inflation rate over a five-year period that begins five years from today.
In simple terms:
It tells us what market participants expect inflation to be from year 5 to year 10 in the future.
It’s often used to gauge long-term inflation expectations.
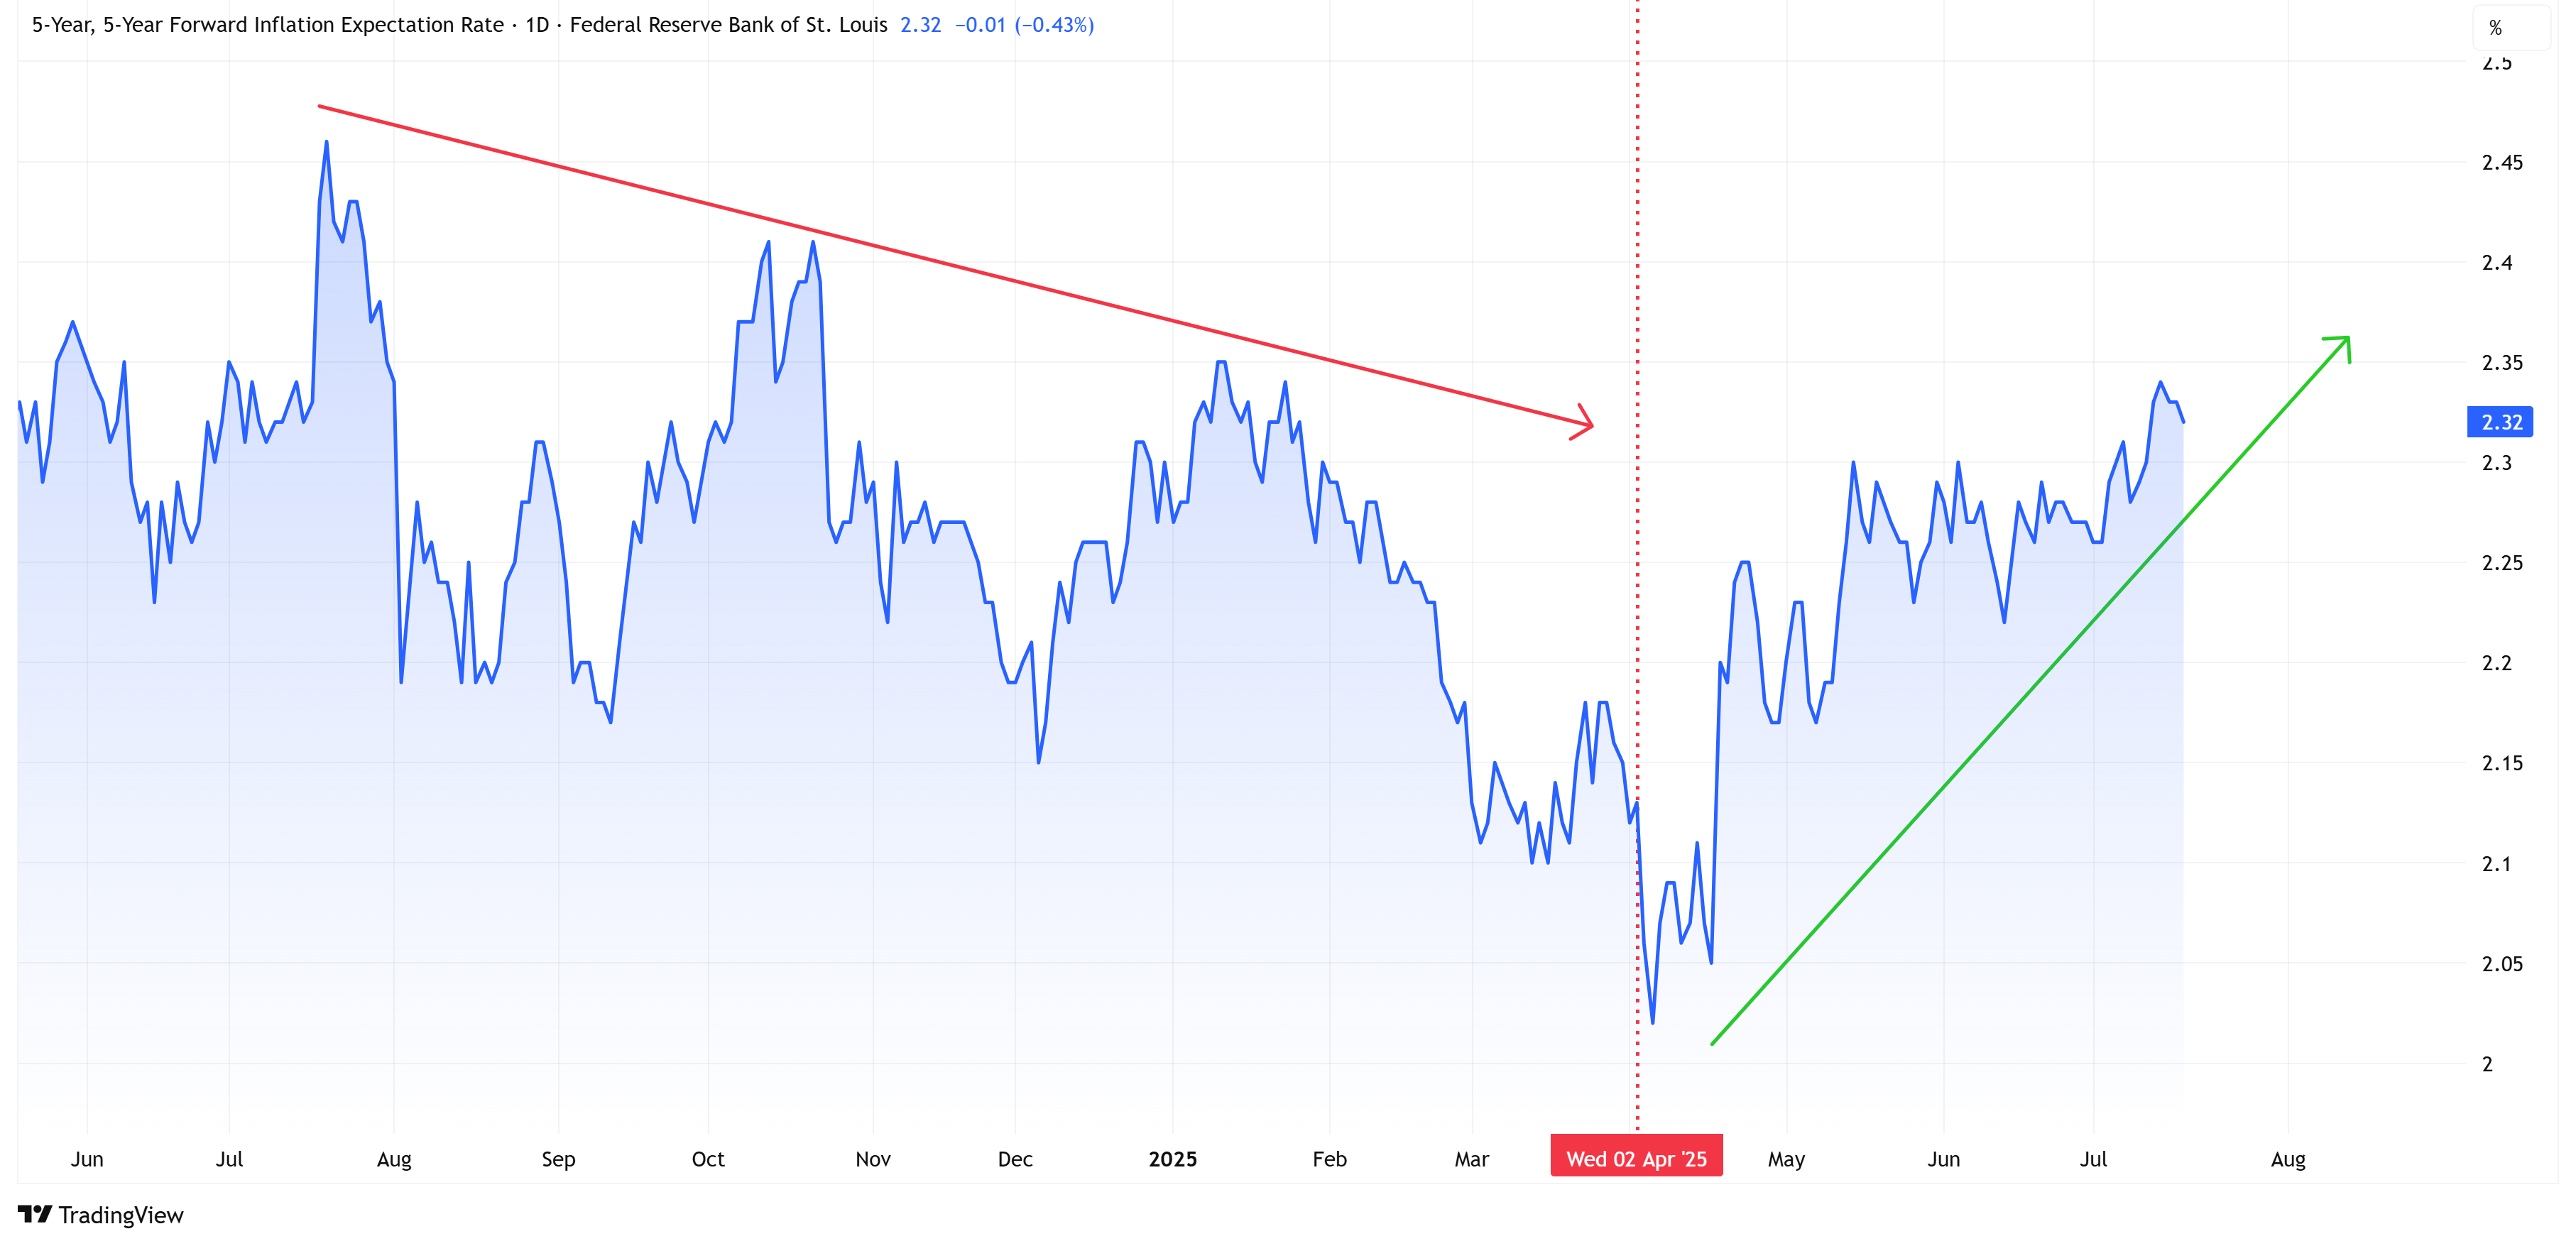
It is worth noting that the 5-Year, 5-Year Forward Inflation Expectation Rate remains below the highs from 2024, but it is moving in the “wrong” direction if you are expecting the FOMC to cut rates.
Putting it all together…
If the US economy remains resilient and inflation measures (i.e., CPI, 5yr/5yr, etc.) remain at current levels (or higher), I think it is going to be hard for the Fed to cut rates.
I don’t think Trump will fire Powell. The market has told him that’s not what it wants; therefore, Trump runs a greater risk by firing him than by waiting until his term expires in May 2026.
I also don’t think that Powell will quit. Thus far, he has shown resilience in not bending to Trump’s demand to cut rates, and I think this resilience will extend to maintaining his job (i.e., not quitting).
Candidly, I think Trump played this wrong. He should never have said anything about cutting rates or belittling Powell by calling him “Too Late”. The only thing this did was put two egos at battle with one another.
At this point, even if Powell wants to cut rates, do you think he will? I think in his mind, if he cuts rates now, he’ll be seen as bending to Trump’s demands, and I don’t think he wants that. Instead, I think he’s looking to ride this out until May 2026.
The only way Powell changes his mind is if the economy begins to weaken dramatically and fairly quickly.
This would likely show itself through a material increase in the unemployment rate or some sort of external event.
So if you’re banking on a rate cut, I wouldn’t hold your breath, and if we do get a rate cut, my sense is that it will be due to a negative turn in the economy or Trump doing something dramatic like firing Powell.
In either scenario, you’re likely looking at a move lower for risk assets.
The following sections are for paid subscribers only.
In these sections, we will discuss our proprietary:
S&P 500 Fair Value Model
This model provides a guide for:
a) How far the S&P 500 could decline in the next recession.
b) When to get back into the market after it has declined.
The Market Map - Extended Analysis
We will call out specific price objectives (up trends vs. down trends, targets, stop losses, etc.) on the following:
Major US Indices
11 Major US Equity Sectors
US Treasuries
Currencies
Commodities
Fixed Income
If you would like exclusive access to the proprietary data below, please become a paid subscriber today! Use the button below for a “15% Discount” for life!
Keep reading with a 7-day free trial
Subscribe to Skillman Grove Research to keep reading this post and get 7 days of free access to the full post archives.