Weekly Chart Review
A shift from the leaders to the laggards? FOMC on tap this week. This could get interesting...
Happy Monday!
Let’s jump right in.
For the last many weeks, I have repeated some version of the following statement:
“This market continues to be driven by Technology, Communication Services, and Consumer Discretionary, but this can’t continue forever. When it turns, we’ll see flows move into the more defensive sectors such as Utilities, Health Care, and Consumer Staples.”
Here is a snapshot of the year-to-date (YTD) returns for the S&P 500 and each of the eleven sectors. As advertised, Technology, Communication Services, and Consumer Discretionary have done the bulk of this year's heavy lifting. Alternatively, the defensive sectors; Utilities, Health Care, and Consumer Staples, have lagged (see the green highlighted box).
Fast forward to last week and we see something entirely different. Not only did the defensive sectors outperform but they dramatically outperformed the “Big 3”. If we include Financials and Energy (i.e., the five worst-performing sectors YTD) we find that these five sectors averaged a return of +2.8% last week vs. an average return of -1.5% for the “Big 3”.
One week does not a trend make but it is worth watching and we should be asking ourselves if this is an intentional shift from the leaders to laggards and if so, what is this telling us about the market as a whole.
Absolute Value
Not much has changed here from last week as we still have virtually every sector and the S&P 500 camped out in the upper-right “Expensive & Overbought” quadrant.
This chart shows the same data as above, just a different look.
Relative Value
Here’s where we begin to see a shift from the previous week.
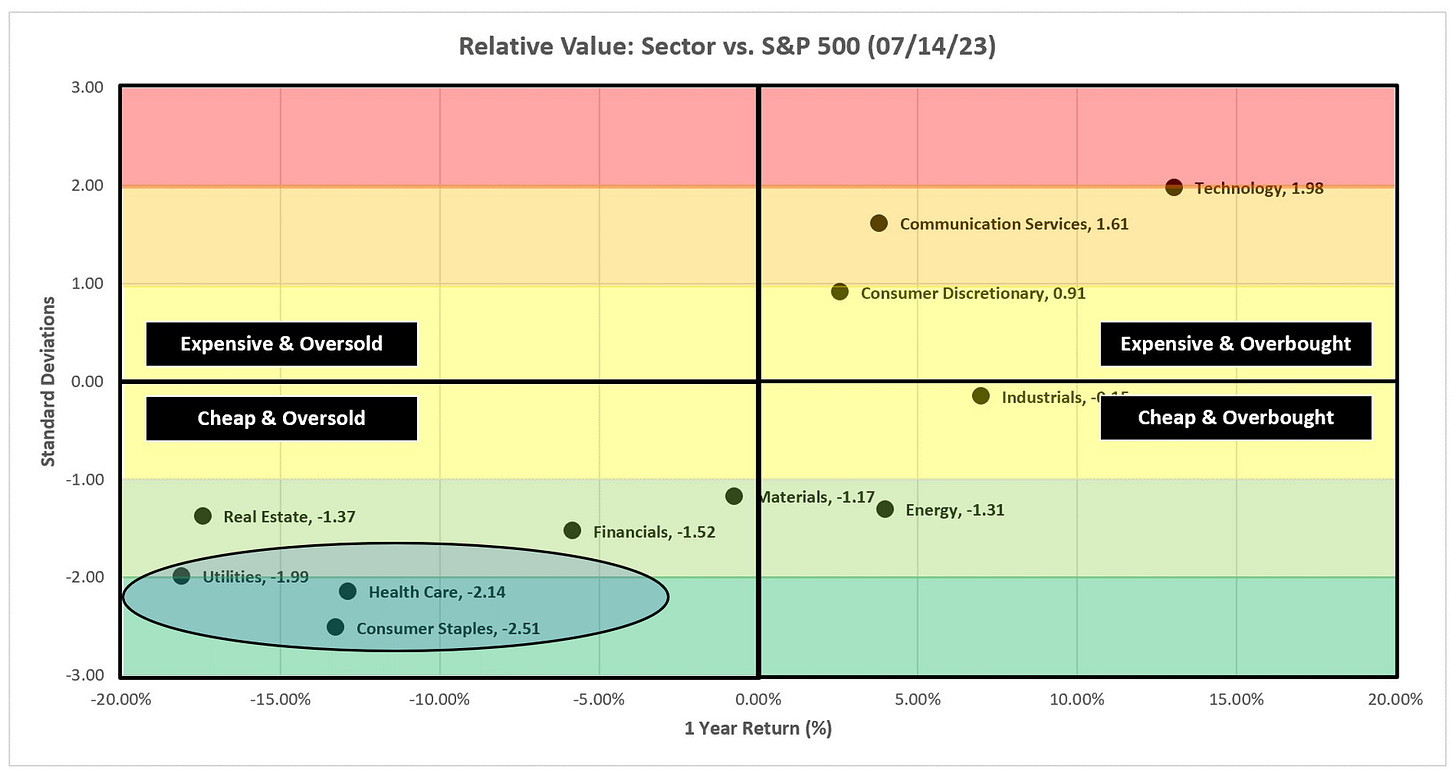
The following chart is as of 07/21/23. Note the “shift up” for the defensive sectors vs. the next chart from 07/14/23.
Further, notice how Technology continues to fall farther below the +2.0 standard deviation threshold.
Here is the same chart but from 07/14/23.
Here is the slider chart from 07/21/23.
Let’s start to put it all together by looking at the sector charts.
Technology
Positive:
The uptrend remains intact.
The moving averages maintain their position slope.
Negative:
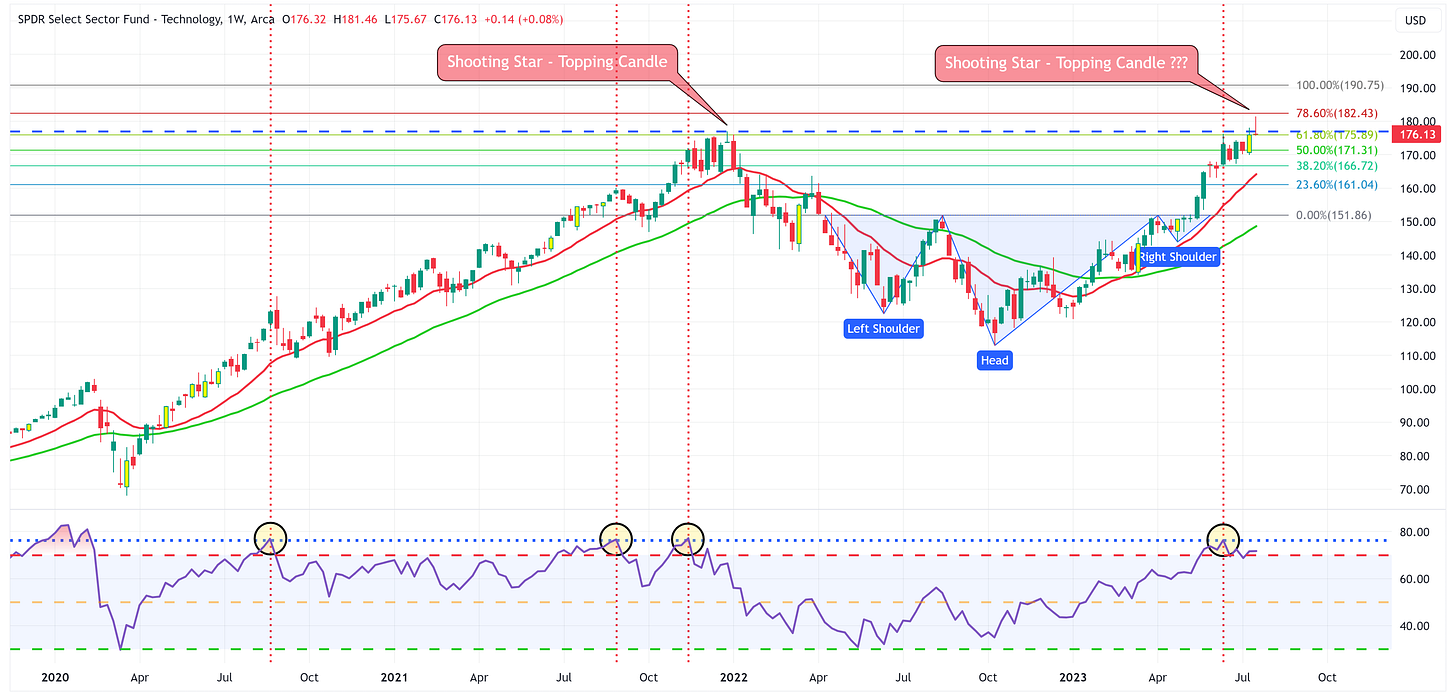
Note that XLK reached its all-time high from December ‘21 but couldn’t extend beyond it.
XLK appears to have formed a “Shooting Star” pattern which is eerily similar to the top it formed in December ‘21 before moving decidedly lower.
Communication Services
Positive:
The uptrend remains intact.
The moving averages maintain their position slope.
Negative:
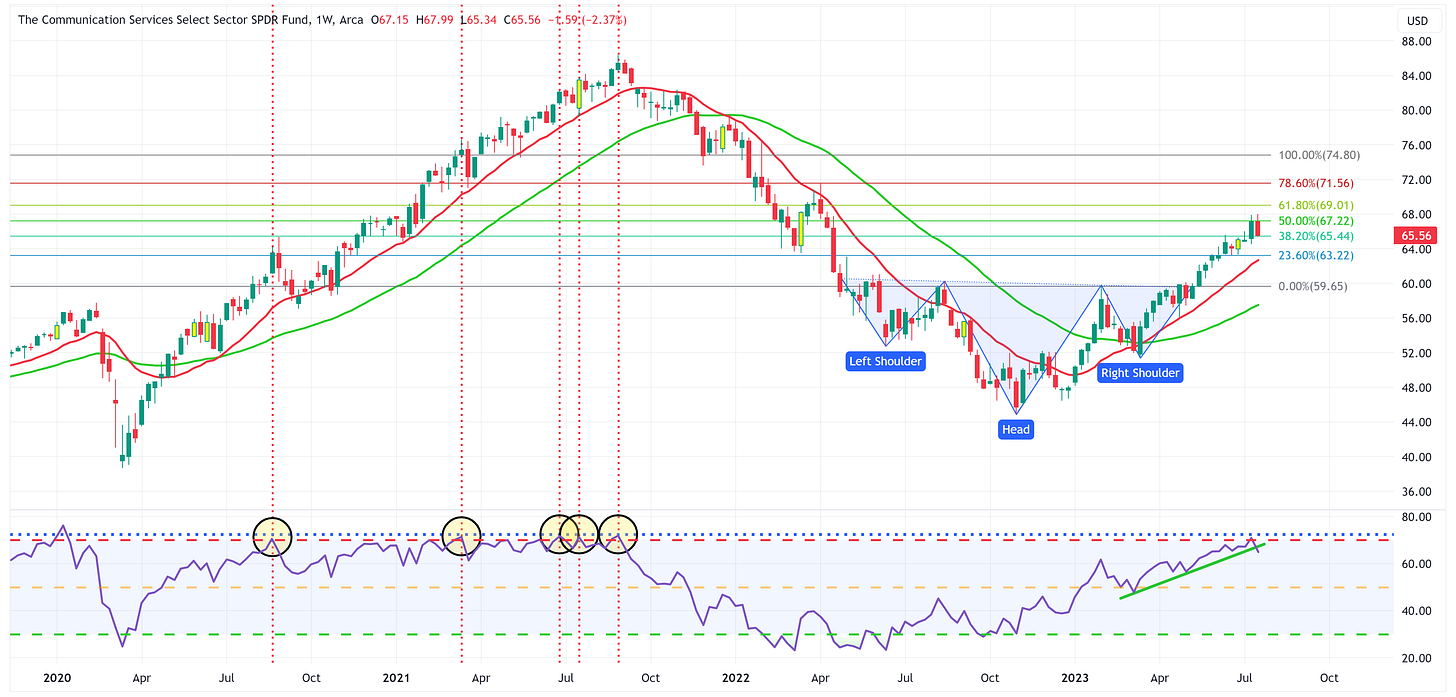
Similar to the previous week, XLC could not hold above the 50% Fibonacci line and subsequently closed at exactly the 38.2% Fibonacci line.
RSI uptrend has been broken to the downside.
Consumer Discretionary
Positive:
The uptrend remains intact.
The moving averages maintain their position slope.
Negative:
XLY could not break past the resistance high from one year ago (see dashed blued line).
RSI has peaked and is heading lower. Every other time this has happened, it was a multi-week move lower.
Industrials
Positive:
The uptrend continues as the price has eclipsed the 23.6% Fibonacci level and now using it as support. Target remains $125.13
RSI maintains its uptrend and has room to run.
Negative:
Not a lot to dislike about this chart. If I had to get picky, I would like to see the moving averages turn up a bit more.
Materials
Positive:
Price action has cleared the neckline which would suggest that the inverse Head & Shoulders pattern is in play putting the target at $102.85.
RSI remains in an uptrend and has plenty of room to run.
Negative:
Ideally, I would like to see the neckline become support thus further validating the inverse H&S pattern.
Energy
Positive:
The RSI downtrend has been broken to the upside.
The neckline of the proposed H&S pattern has proven to be support thus negating the H&S pattern for now. With that said, watch for a clear of the right shoulder ($87.74). If that happens, the target becomes somewhere in the context of $111 to $112.
Negative:
This breakout is in the early stages, for it to sustain itself, I’d like to see the upward move last long enough for the moving averages to begin to have an upward slope.
The top of the right shoulder could prove to be resistance, we need to watch that level closely.
Financials
Positive:
This is the H&S pattern that just won’t let itself form, especially the right shoulder.
RSI continues its uptrend and still has plenty of room to move higher.
Negative:
I would really like to see the 55-day moving average (green line) start to move higher and to have the 21-day moving average (red line) move up and through the 55-day moving average which thus far it hasn’t done.
Real Estate
Positive:
RSI remains on the high side of the midline.
Last week closed at the top of its weekly range.
Negative:
XLRE has not been able to break out of its triangle pattern.
The 55-day moving average continues its downtrend.
Consumer Staples
Positive:
Extremely strong week last week vs. the rest of the market.
RSI maintains its recent uptrend.
Price could be in the early stages of forming the right shoulder of an inverse H&S pattern.
Negative:
I would prefer to see some upward movement from the moving averages.
Watch for the neckline to provide resistance.
Utilities
Positive:
Extremely strong week last week vs. the rest of the market.
Price action is trying to break out from its triangle pattern. If it is able to do so, the target becomes $78.44.
RSI has broken up and through the red line downtrend.
Negative:
XLU hasn’t decisively broken through the triangle pattern. We need that to happen.
I would prefer to see some upward movement from the moving averages.
Health Care
Positive:
Extremely strong week last week vs. the rest of the market.
Price action broke definitively up and through the triangle pattern suggesting the target of $149.34 is in play.
RSI has broken up and through the red line downtrend.
Negative:
I would prefer to see some upward movement from the moving averages.
Last week’s move was so big that it wouldn’t be uncommon to see a modest pullback this week. If that happens, watch for where XLV finds support. The bulls will not want to see a move back inside the triangle pattern.
S&P 500 Index
Positive:
The uptrend remains intact with a target of $4,927.
Moving averages maintain their positive slope.
Negative:
RSI is fairly extended.
The “Big 3” sectors ran into a lot of trouble last week relative to the defensive sectors.
Note that the market closed in line with the 50% Fibonacci level. This would suggest that the level is providing some resistance against the move higher.
Summary
As I alluded to at the top, this was an interesting week as we saw the “Big 3” give back some while the defensive sectors outperformed dramatically.
Is this the beginning of a rotation from the YTD leaders to the YTD laggards, which just so happen to be the defensive sectors? If so, what is that saying about the market as a whole?
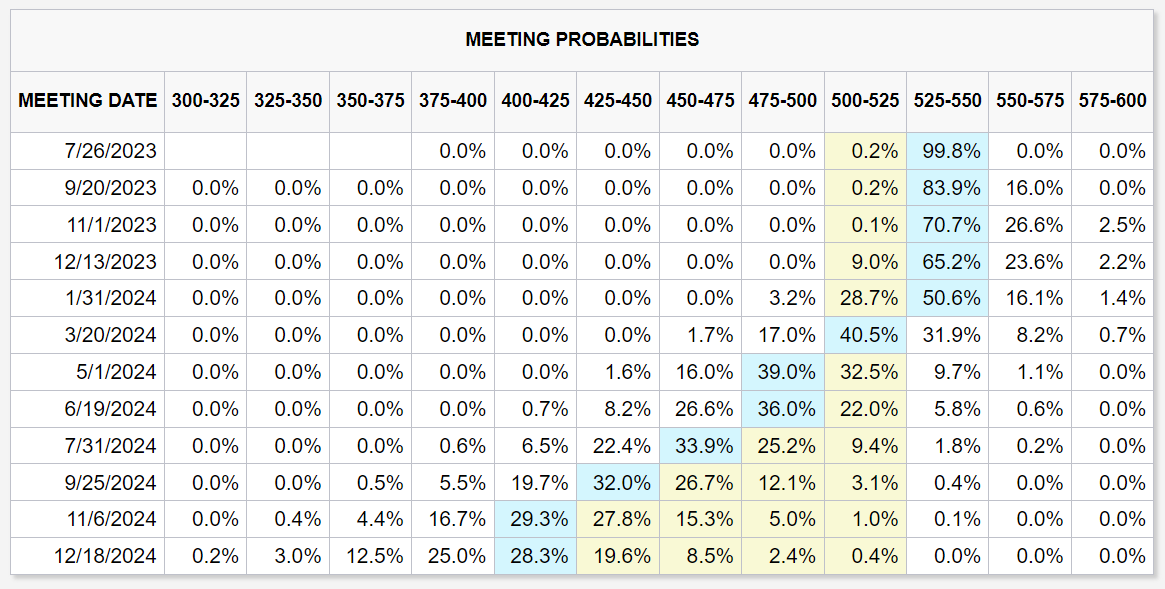
This is a big week for the market as the FOMC meets on Tuesday and Wednesday. You can see in the table below that there is currently a 99.8% chance that the FOMC will raise rates on Wednesday by 25 basis points. Short of something extremely dramatic happening in the next 48 hours, you can go ahead and take that rate hike to the bank.
The bigger and more important picture is what happens next. As you can see from the table above, the market believes this week’s rate hike is the last one and that the FOMC will be on hold through January 2024 and begin reducing rates at the March 2024 meeting.
If we isolate last week’s price action for the sectors and market as a whole, I think it could be telling us a different story. The “Big 3”, and especially Technology, tend to not perform as well when interest rates are rising. I think part of their strength this year has been the belief that the FOMC was “almost done” with its rate-hiking campaign and that we should expect lower rates shortly thereafter.
Is it possible that the FOMC believes that inflation is going to remain stickier than previously expected? If so, is it possible that the FOMC will come out this week and suggest that the rate hiking campaign may not be done and/or that rates will need to remain higher for longer than the market currently expects? This could explain some of the price action from the “Big 3” last week.
Further, look at Energy’s +3.5% performance last week. That was the best performer of the week. Energy tends to perform better in an inflationary environment. This would be supportive of the “stickier inflation” and “higher for longer” narrative.
Lastly, I find it curious that the defensive sectors rallied to the extent that they did last week. Could the market be at the point of finally realizing that “stickier inflation” and a “higher for longer” FOMC will ultimately end with demand destruction thus taking the wind out of the sails for the “Big 3”? If so, this is when we tend to see the shift into the more defensives, and maybe some market participants are trying to get ahead of that move.
Alternatively, last week could have been a complete one-off and maybe the FOMC comes in uber-dovish and tells the market it’s done at the press conference this Wednesday.
No one has a crystal ball but last week’s moves were interesting and lead me to believe we shouldn’t rule out a surprise from the FOMC this week. A surprise would be any narrative that suggests that rate hikes are not done and/or rate cuts beginning in March 2024 are not in the cards.
Until next week…


Another excellent piece. Thanks!
Hi JS,
I am measuring from the head of the inverse H&S pattern to the neckline. I then apply that distance to where the neckline was broken.
Does that help? Happy to explain further if needed.
Take care,
Jim