Weekly Chart Review
US Treasury Yields - Where are they going from here?
Over the last several weeks, I have received the same question multiple times. It was asked in different ways with different reference metrics but effectively the same question:
“With the recent run up in US Treasury yields, how high can yields go?”
With that said, I thought it might be worth taking a deeper dive this week into US Treasury yields, 1) where they have been, 2) where they are potentially going, and maybe most importantly, 3) what this means for products like ZROZ, TLT, TLH, IEF, etc. that we track each week.
The US 10-year Treasury note is probably the most-watched, if not the most important, of the various US Treasury maturities so I will focus on this to start and then branch out from there.
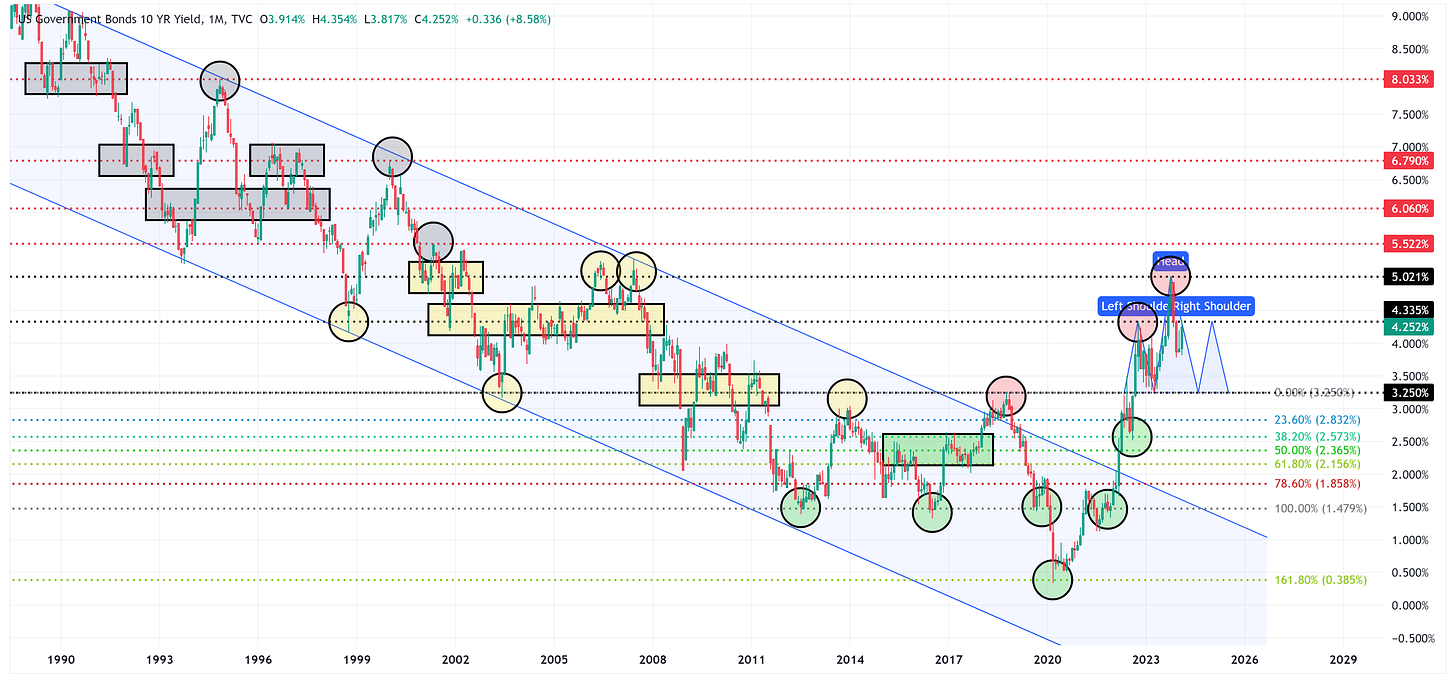
It is important to recognize (visually), the massive bull market (declining yields) that has existed in US Treasuries for the vast majority of the last 40+ years.
Note: this is a monthly chart of the UST 10-year.
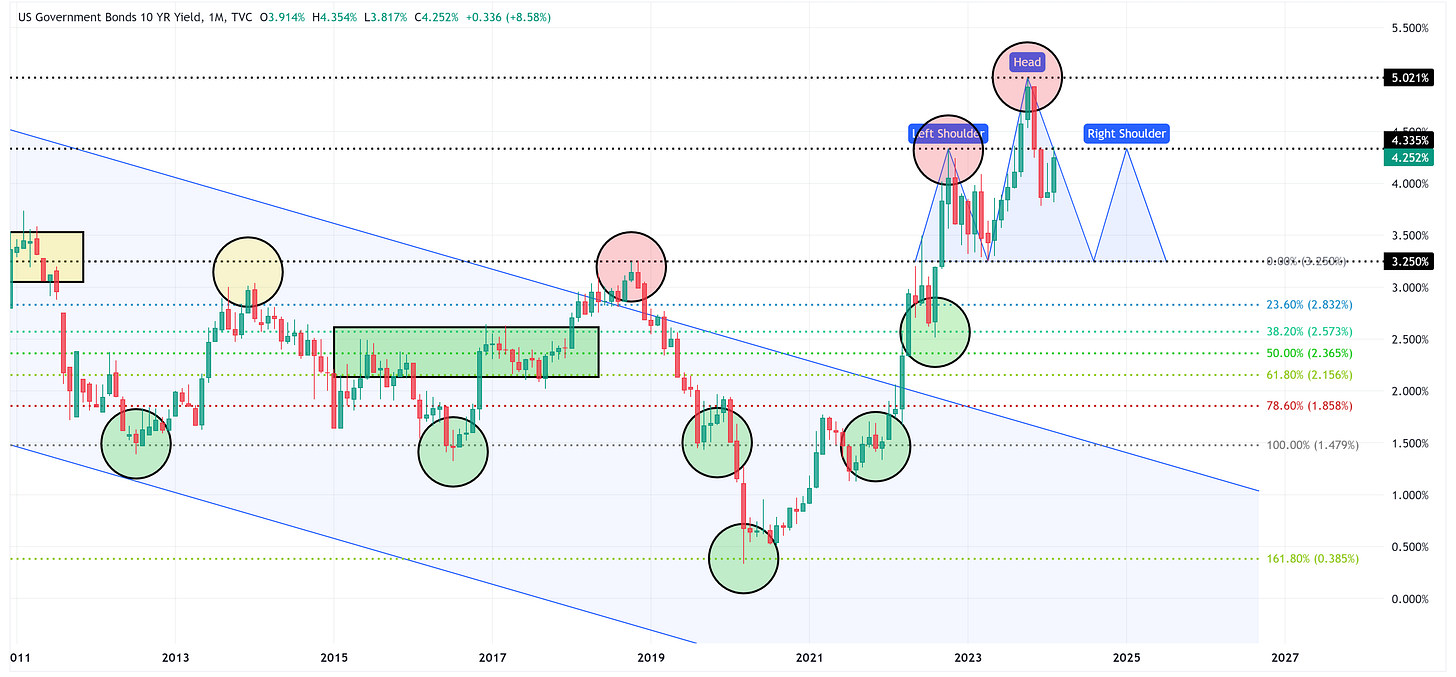
If we zoom in, I’d like to focus on the red circles that you see on the chart below. These denote three of the relative highs that we’ve seen over the last 5 years.
If taken on their own, the red circles look like random stopping/turning points, however, when we take them in the context of the past, we find that they are not random at all; in fact, they line up with other key turning/pivot points in the past. This tells us that these levels are important to the market.
If these are important levels, what does this tell us about the future direction of UST 10-year yields?
Two scenarios.
Scenario #1 (Bull Case):
The Bull Case (i.e., UST 10-year yields decline) would suggest that the 5.021% we saw in October 2023 is probably the current cycle top. If so, we could be in the process of forming a Head & Shoulders topping pattern.
If we are forming a Head & Shoulders pattern, it is possible that we could see the UST 10-year trade down to the neckline (3.25%), then move higher to form the right shoulder before breaking down and through the neckline towards the target of 1.479%.
Note: the “right shoulder” high does not necessarily have to, and often doesn’t, come back up to the same height as the “left shoulder”.
The target (1.479%) is determined by taking the value at the “head” (5.021%) and subtracting the “neckline” value (3.25%) which equals 1.771%. We then subtract 1.771% from the “neckline” value (3.25%) to get a target of 1.479%.
I find it fascinating how perfectly the target value matches up with other historical turning/pivot points (see green circles) thus giving further validity to the target we have computed.
The “bullish” case (i.e., one where we reach the target of 1.479%) for the UST 10-year, likely happens as a result of a recessionary environment for the US economy and US equities.
Scenario #2 (Bear Case):
The Bear Case (i.e., UST 10-year yields increase) would suggest that the October 2023 high of 5.021% was not the cycle high at all, instead, it was merely a resting point along the way towards higher yields.
We’ll know that the bull case has been negated if/when we clear 5.021%. Additionally, I would suggest that if we clear the high side of the left shoulder (4.335%) and sustain it, you probably want to have your antenna up for a further move higher in yields.
Okay, so let’s say we clear 4.335% and 5.021%…where are we heading?
Again, let’s leverage the important points from the past. In the chart below, I have done this by denoting them with red horizontal lines and grey circles/boxes to show their historical relevance.
If we break above 5.021%, the following levels are possibilities: 5.522%, 6.06%, 6.79%, and 8.033%.
Using the same math from above, if we take the distance from the neckline (3.25%) to the head (5.021%) which equals 1.771%, and add that value to the head (5.021%) we come up with a high side target of 6.792% (5.021% + 1.771%), which ironically, or maybe not, matches up almost perfectly with the 6.79% we called out above.
The “bearish” case for the UST 10-year likely equates to a scenario whereby we see a reigniting of inflation and/or a US economy that surprises to the upside with regard to economic expansion/growth.
The hard part is trying to determine which scenario you believe is most likely to occur and each investor will have to come to that decision on their own. I tend to skew towards the “something will eventually break” scenario thus suggesting that the “bullish” case is more likely. However, I (along with many other people) thought the US was destined for a recession in 2023 and that did not occur.
US Treasury ETFs
Let’s turn now to the US Treasury ETFs that we track each week and attempt to discern how the above analysis will not only impact these investment vehicles but call out potential high and low price targets for ETFs like: ZROZ, TLT, TLH, and IEF.
Keep reading with a 7-day free trial
Subscribe to Skillman Grove Research to keep reading this post and get 7 days of free access to the full post archives.


