If you scroll down to our weekly “Asset Class Review”, you’ll be hard-pressed to find very many of the 103 ETFs we review each week that are not “Bullish” or “Max Bullish”.
Interestingly, this spans the spectrum of equities, US Treasuries, and fixed income in general. Net/net, most everything is moving “up and to the right” at this time.
Which begs the question: “How far can this go?”
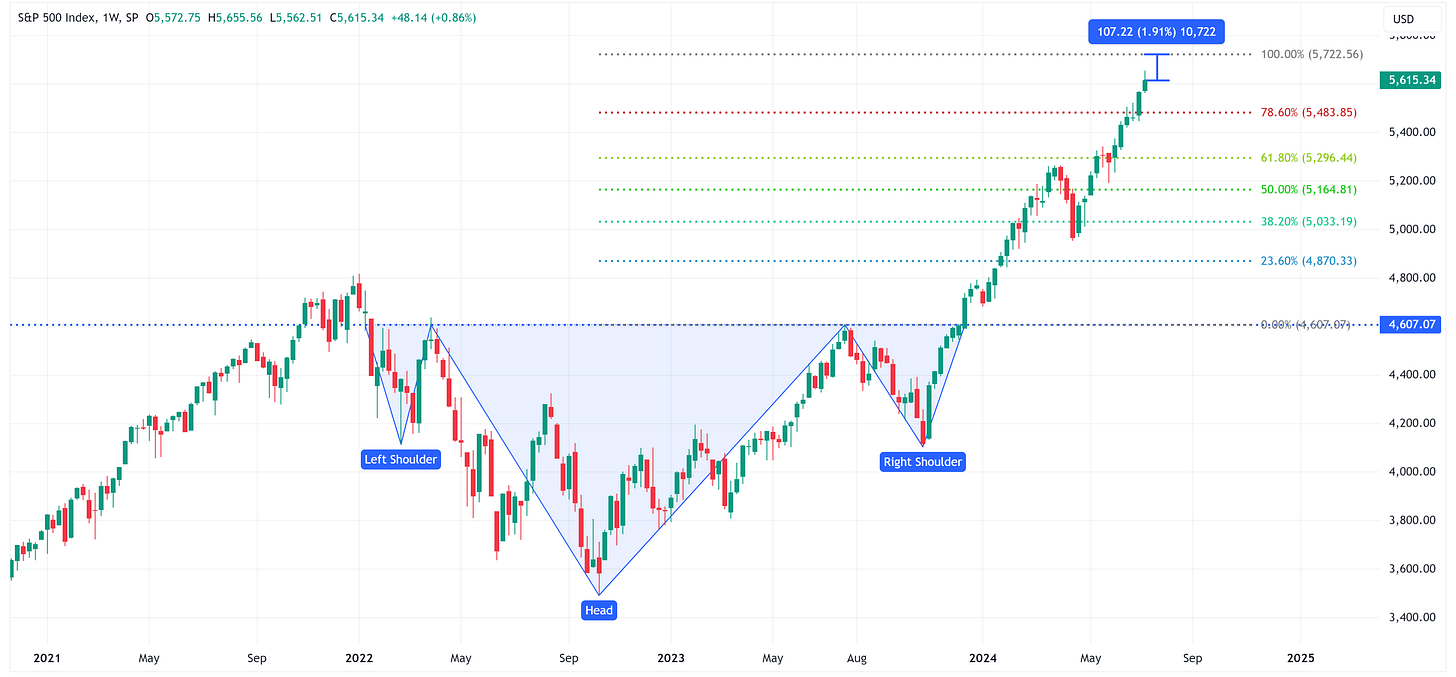
In the following two charts, I am showing the S&P 500 and the NASDAQ 100. Both have inverse head & shoulders patterns in place with targets above current levels thus suggesting a continued move higher.
S&P 500: Target = 5,722.56 (+1.91% from Friday’s close)
NASDAQ 100: Target = 21,277.19 (+4.65% from Friday’s close)
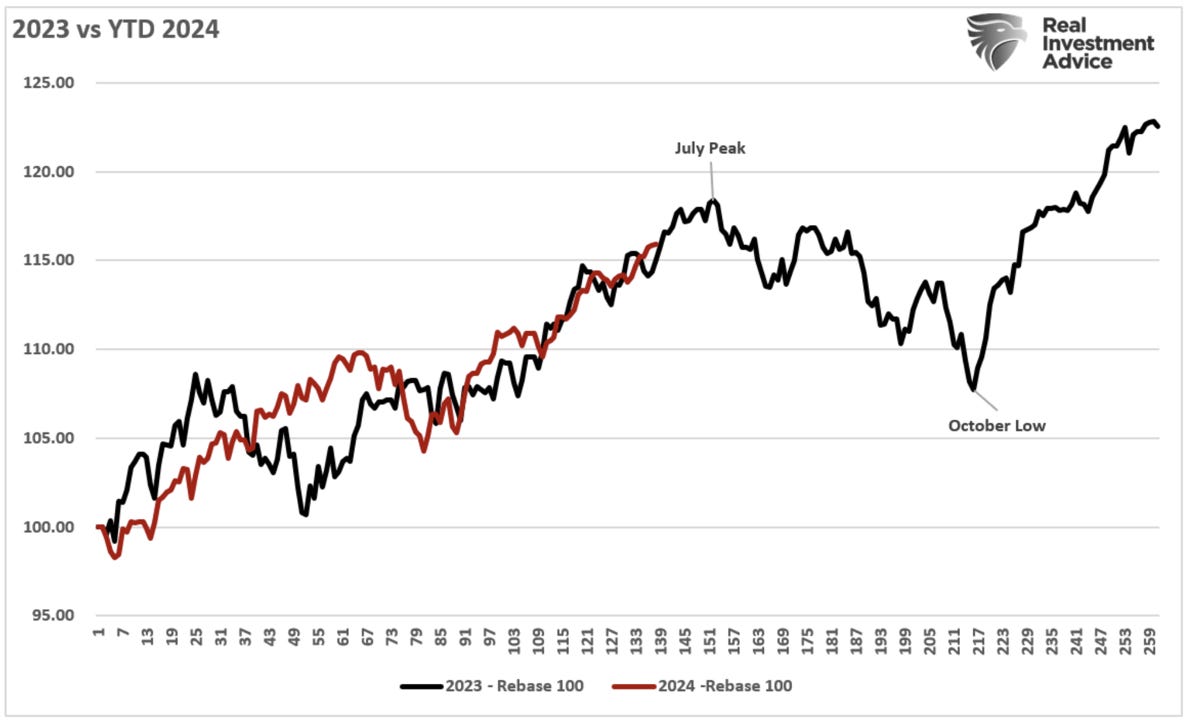
2024 = 2023?
However, as my good friend, Lance Roberts has pointed out recently, 2024 is shaping up to be very similar to 2023 for the S&P 500 as shown in the chart below.
Is it a guarantee that these similarities will continue, absolutely not, but it would suggest that a ~10% pullback could be coming in the not-too-distant future.
Rate Cuts
Regular readers know that I have suggested for some time now that there was no way the Fed was going to cut rates seven times as was priced in at the beginning of the year.
With that said, I think the Fed wants to cut rates before the election and will likely find a way to make that happen.
Keep reading with a 7-day free trial
Subscribe to Skillman Grove Research to keep reading this post and get 7 days of free access to the full post archives.


