

Hey everyone, it’s Jim.
I hope you had a great weekend!
Let’s jump right into this week’s newsletter.
In this week’s newsletter:
Stay Informed
Key Macro Events From Last Week (ICYMI)
Key Macro Events To Watch This Week
The Market Map
Application - S&P 500
Deep Dive
The Number of Unemployed Continues to Rise…
S&P 500 Fair Value Model
The Market Map - Extended Analysis
Major US Indices
11 Major US Equity Sectors
US Treasuries
Stay Informed
Key Macro Events From Last Week (ICYMI)
Here’s a brief recap of the major U.S. financial and economic news releases for June 2-6, 2025.
📦 ISM Manufacturing PMI (May)
The ISM Manufacturing PMI fell to 48.5, down from 48.7 in April and below expectations of around 49.3, marking the fourth consecutive month of contraction and signaling ongoing weakness in factory activity. (Link)
☁️ ISM Non-Manufacturing (Services) PMI (May)
The ISM Services PMI edged to 49.9, dipping just below the 50 mark for the first time since June 2024, indicating a slight contraction in services, with new orders softening amid tariff-related uncertainty. (Link)
🏢 ADP Employment Report (May)
Private-sector payrolls added just 37,000 jobs in May—the lowest monthly increase since March 2023—highlighting cooling momentum in private hiring. (Link)
📉 Initial & Continuing Jobless Claims
Initial claims rose 8,000 to 247,000 (week ending May 31), an eight-month high likely influenced by seasonal factors, not widespread layoffs. (Link)
Continuing claims edged down to 1.90 million, remaining elevated but not alarming. (Link)
A separate report noted continuing claims at 1.919 million for the week ending May 17, the highest since late 2021. (Link)
💵 Non-Farm Payrolls & Unemployment Rate (May)
Non-farm payrolls grew by 139,000, slightly above expectations (~130,000), though revisions trimmed March–April by 95,000 combined. (Link)
The unemployment rate remained steady at 4.2% for a third straight month. (Link)
⏰ Average Hourly Earnings (May)
Hourly earnings rose 0.4% month-over-month, bringing annual wage growth to 3.9%, bolstering consumer income and spending capacity. (Link)
🔍 Economic Context & Fed Outlook
The labor market shows signs of gradual cooling but remains resilient, giving the Fed flexibility to hold rates steady at its June 17–18 meeting. (Link)
Tariffs and trade uncertainty continue to pressure manufacturing, particularly reflected in services and inventories. (Link)
Overall, the data paints a picture of a stable yet moderating labor market, cooling factory activity, and slight services contraction, all unfolding in a climate of elevated trade policy uncertainty.
Key Macro Events To Watch This Week
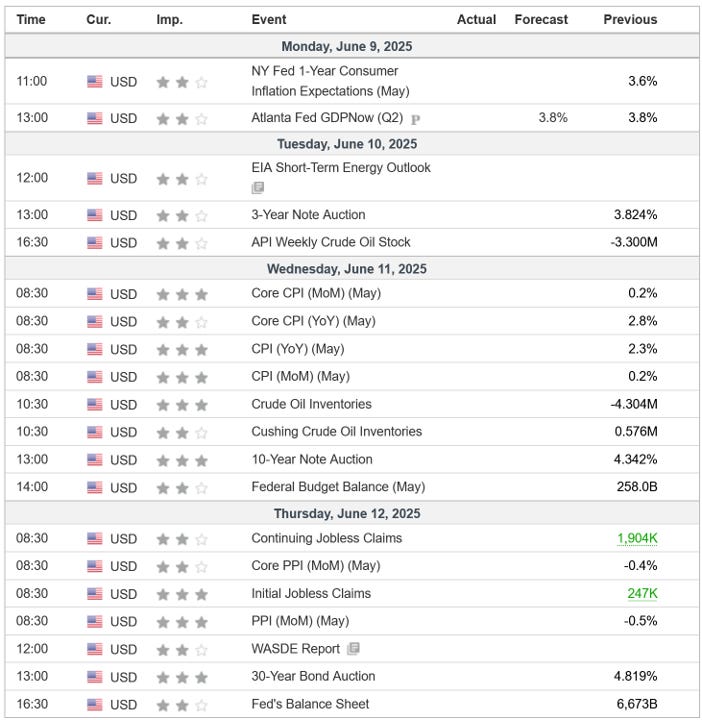
CPI and PPI will be the biggest items to pay attention to this week from an economic data release standpoint.
The Market Map - Application - S&P 500
The S&P 500 returned +1.50% last week; however, it remains in a technical downtrend according to our analysis.
For the last several weeks, I’ve made the following statement:
“Using the chart below as a reference, I believe there is a reasonable chance that the market rallies to close the unfilled gap above current prices (denoted by the black arrows: 5,986 - 6,009) or possibly slightly higher, before heading lower.”
If we zoom in on this range on the weekly chart, we find that last week did indeed fill this gap.
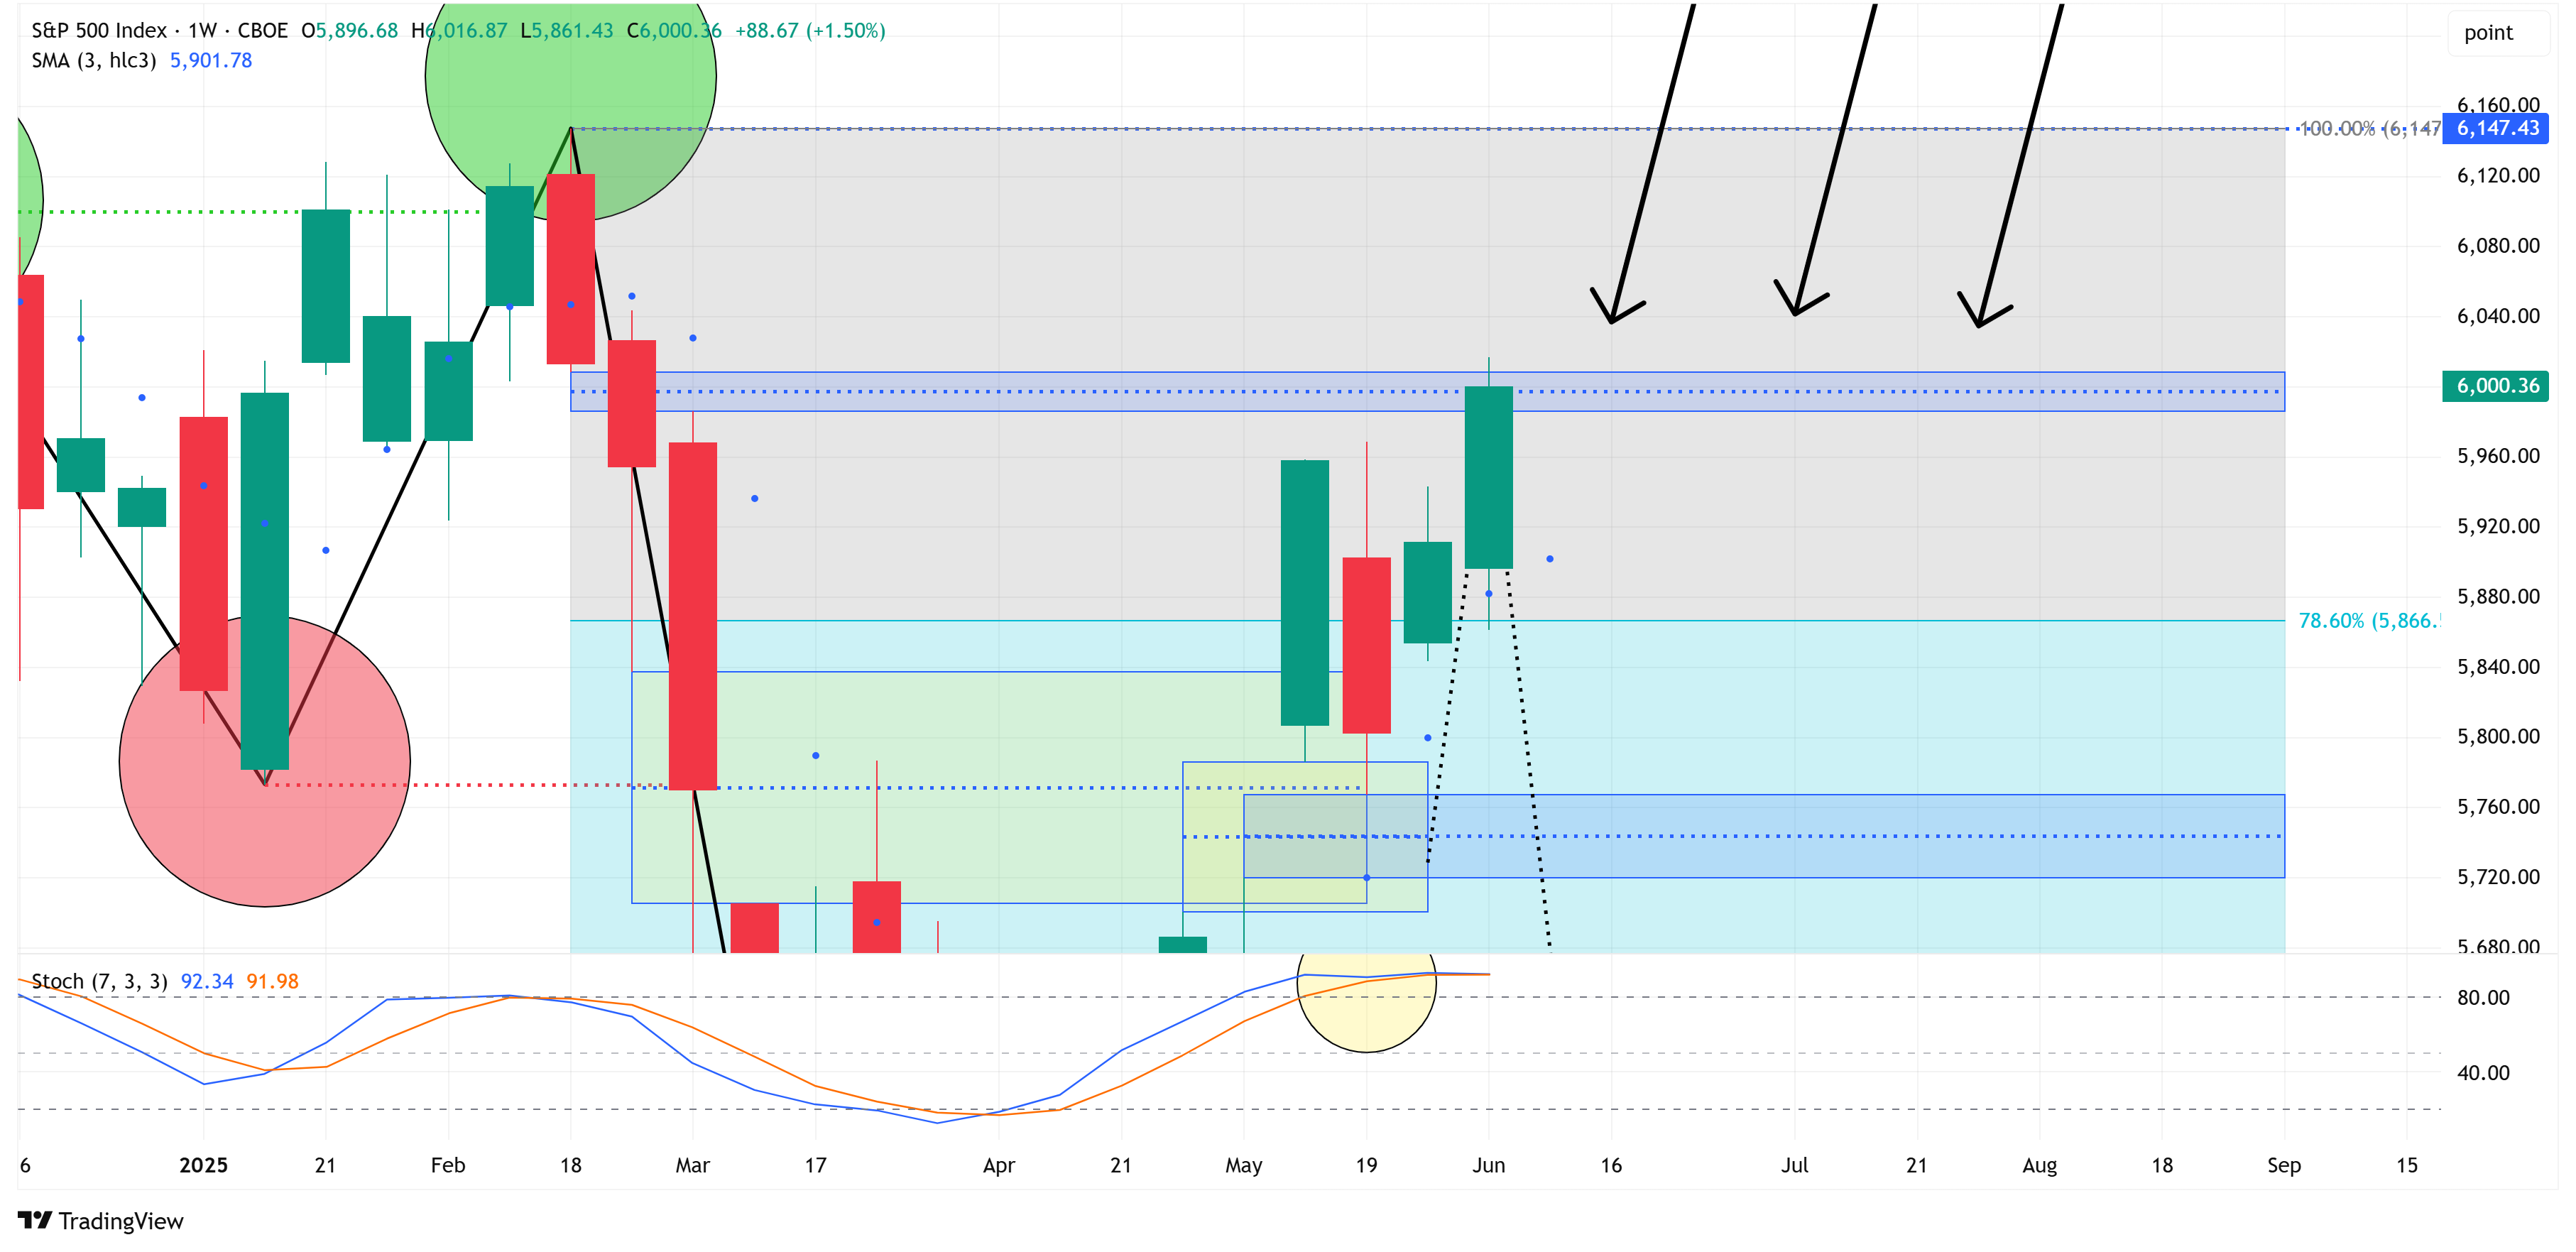
The question now becomes: “Where do we go from here?”
Will we break above 6,147.43 and continue to push higher, or was the primary objective of the market to close the gap noted above before heading lower?
Let’s check in with the lower time frame to see if it gives us any clues.
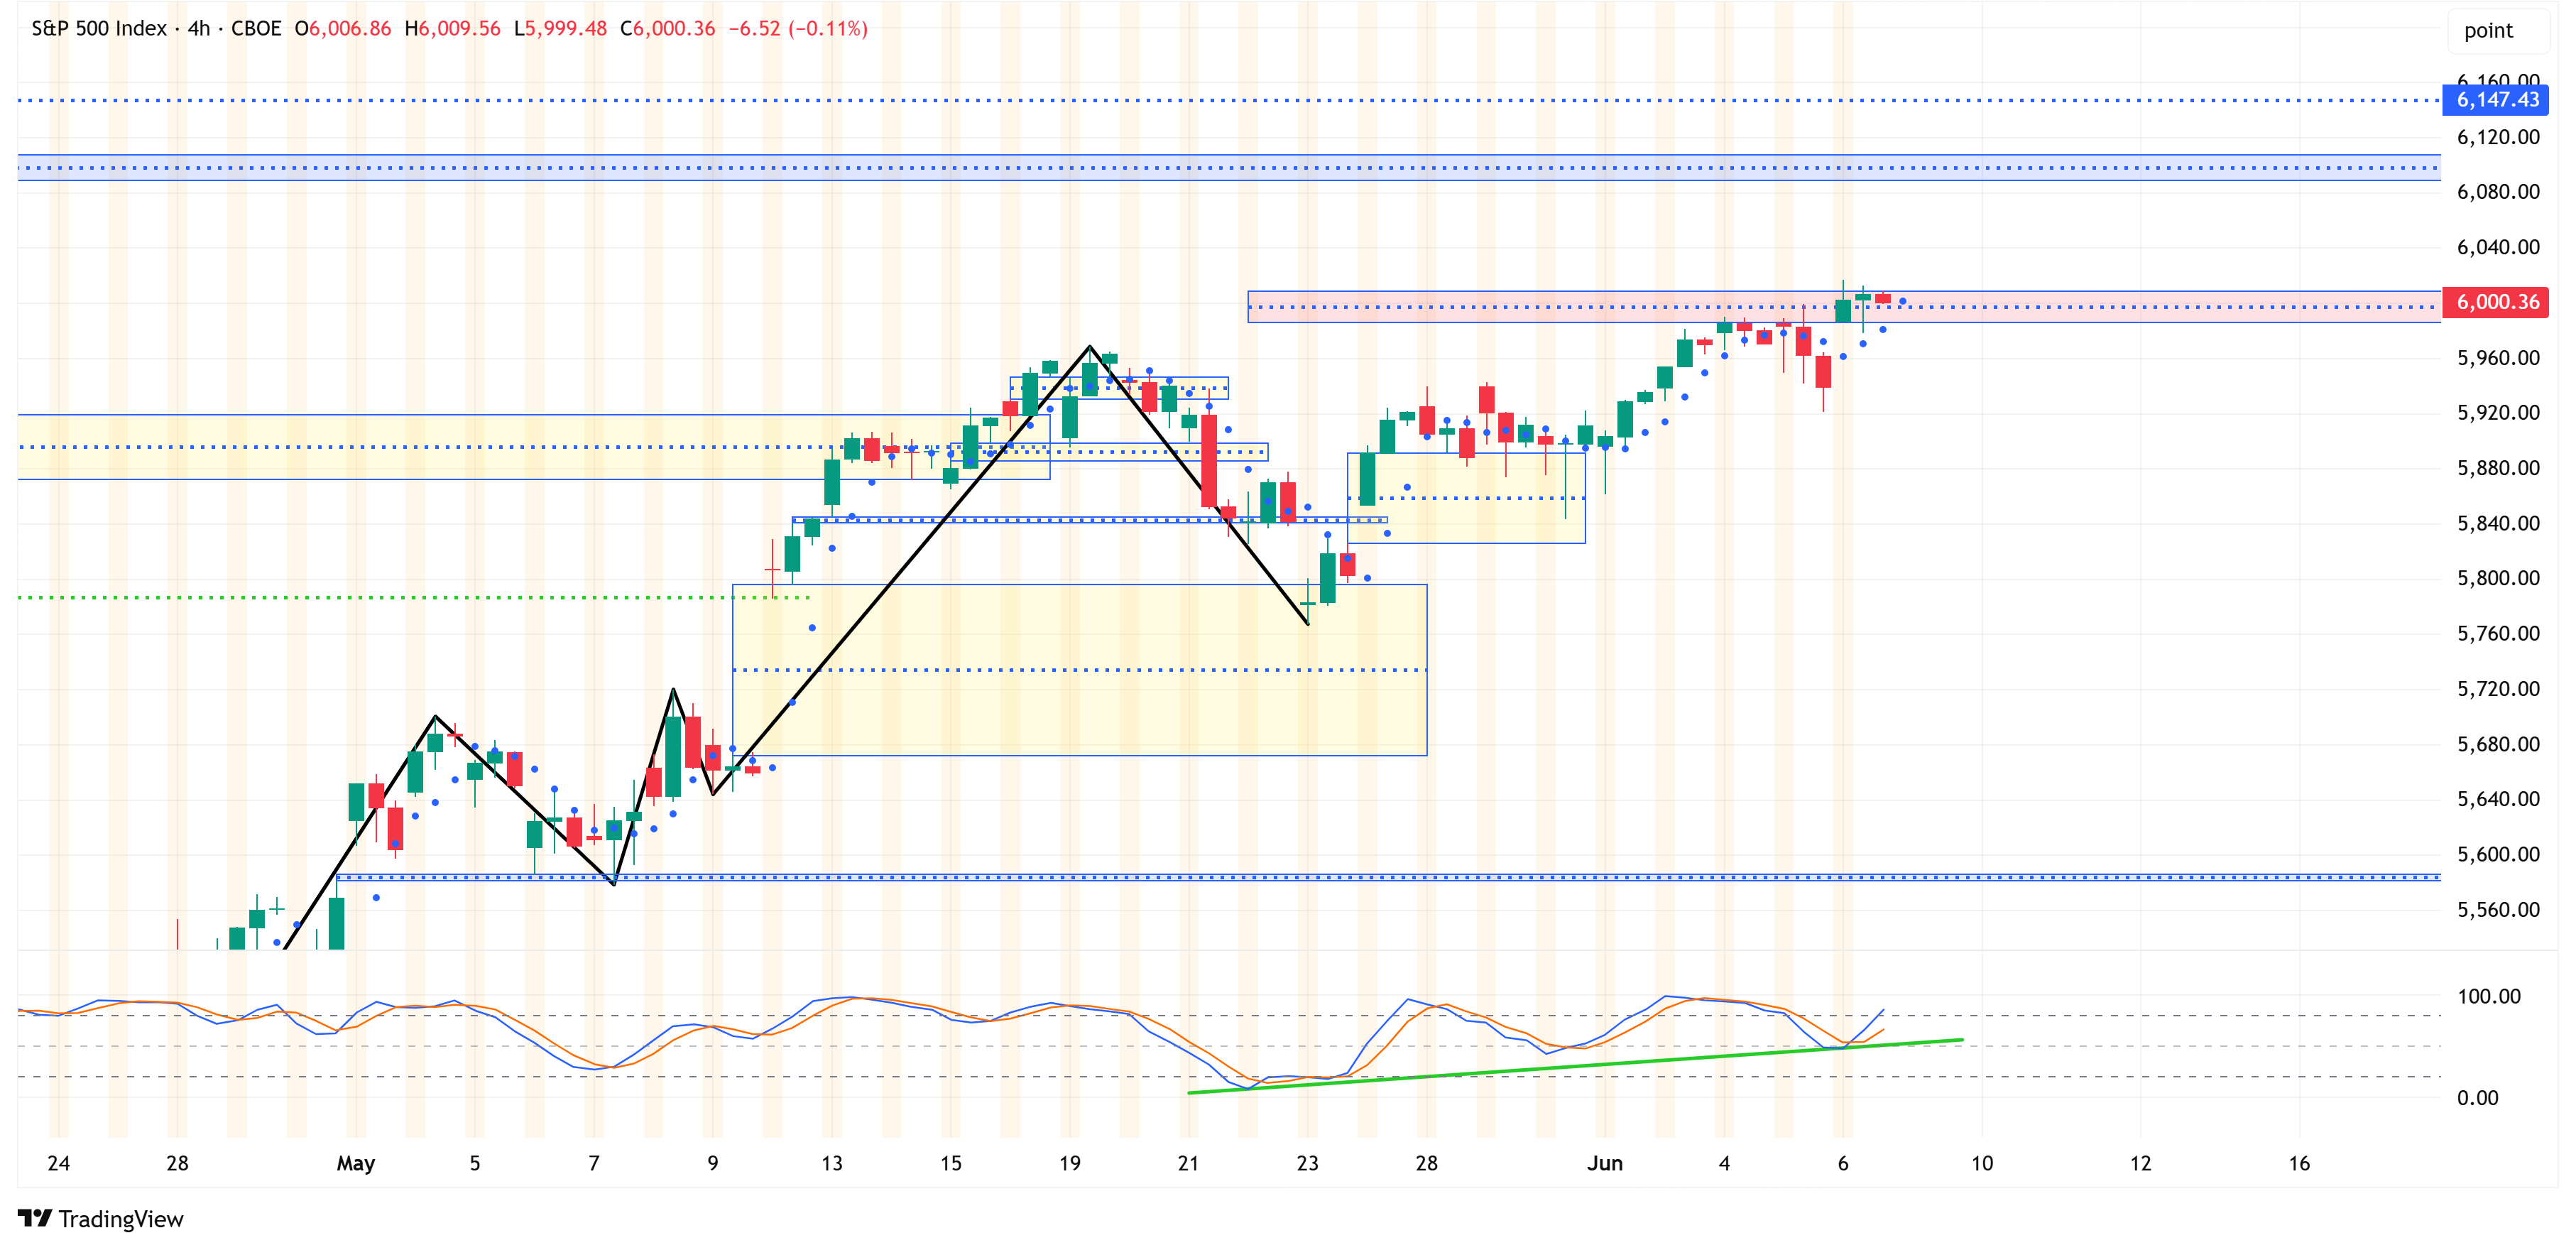
The 4-hour time frame (above chart) remains bullish, therefore suggesting that the S&P 500 will likely continue to push higher.
The red box that was just filled on the 4-hour chart is the gap that was highlighted above on the weekly chart.
With that said, there is a gap (blue box) on the 4-hour chart in the range from 6,089 - 6,107 that needs to be filled.
This will take us pretty close to our line in the sand of 6,147.43. If we have a weekly close above this level, our analysis will turn bullish for the S&P 500 and call for even higher highs.
Net/net, how the market behaves between Friday’s close and 6,147.43 is of paramount importance over the next several days/weeks.
Deep Dive
The Number of Unemployed Continues to Rise…
Just a quick “Deep Dive” this week on something that caught my attention when the Nonfarm Payrolls (+139k) and Unemployment Rate (4.2%) came out on Friday.
As noted above, the Unemployment Rate remained steady at 4.2%; however, the number of unemployed people rose from 7.166 million to 7.237 million.
The calculation for the Unemployment Rate considers the total labor force as the denominator, and the labor force declined by 625k, from 171.135 million to 170.510 million.
Put it all together, and extending a few decimal places, the Unemployment Rate for April was 4.187% (7.166 / 171.135) while the Unemployment Rate for May was 4.244% (7.237 / 170.510).
This means we were very close to rounding up to 4.3%, but that’s not the point I want to make today.
Instead, I want to focus on the steady increase in the number of unemployed people and how it compares to history.
In the chart below, I am showing the number of unemployed people in the US, and I have added a 36-month simple moving average.
Note: the red vertical bars are recessionary periods.
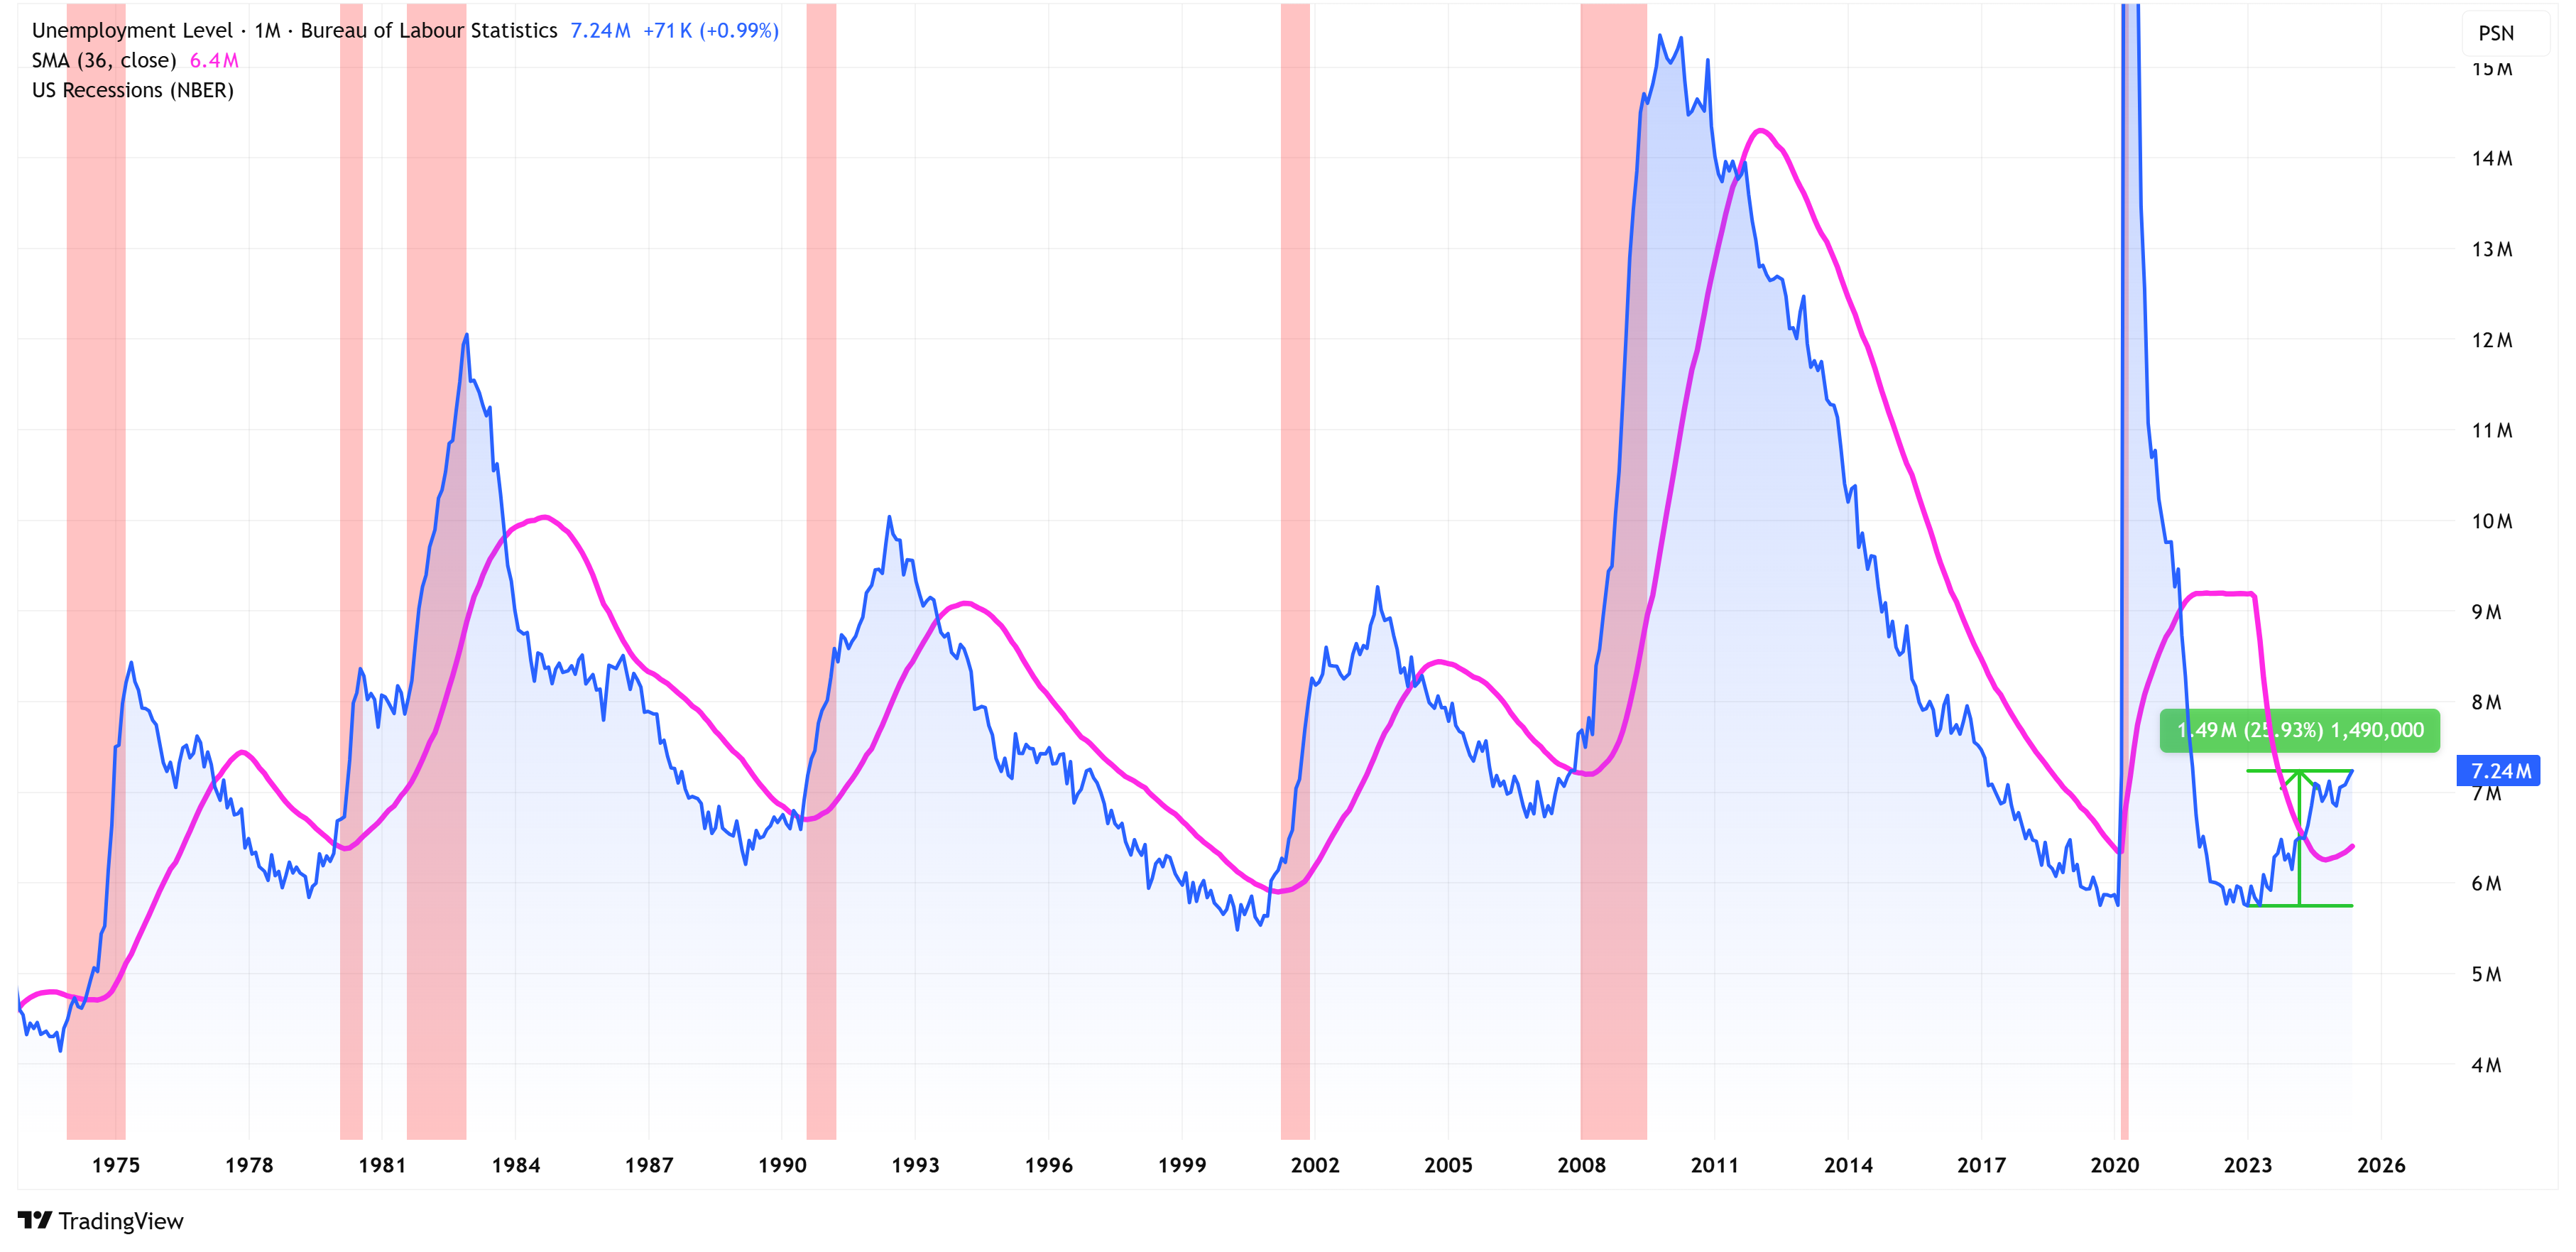
Over the last 50 years, there have been seven recessions.
Not one of those recessions has occurred when the number of unemployed people was below the 36-month moving average.
On the contrary, every time the number of unemployed people moved up and through the 36-month moving average, a recession followed.
Note: There was one exception during the back-to-back recessions in the early 80s when the number of unemployed people never dipped back below the 36-month moving average before the US fell into a recession again.
You may notice that recessions have occurred at different levels of the number of people who were unemployed. However, one thing is fairly consistent in that recessions tend to occur when the change in the number of unemployed increases by ~14% from the most recent trough.
Over the seven recessions highlighted above, the average was 13.84% and the median was 14.41%.
Where do we stand today?
The most recent trough was January 2023, when the total number of unemployed people was 5,747,000. The number of unemployed people for May 2025 was 7,237,000, which means this figure has increased by 25.93%.
Covid was a unique situation, but even during Covid, the number of unemployed people spiked by 25.26% when the recession was called.
Just to recap:
The number of unemployed people is currently above the 36-month moving average.
The number of unemployed people has increased by 25.93% from the trough, which is closing in on almost double the historical average for when a recession typically begins.
Despite all of this, still no recession, and we have an equity market that looks like it wants to push higher.
I continue to believe that the tariff debacle catches up with us and that we end up in a recession in the second half of the year or early 2026, or maybe this time is truly different and we’re done having recessions. I’m guessing that is not the case.
The sections that follow are for paid subscribers only.
In these sections, we will discuss our proprietary:
S&P 500 Fair Value Model
This model provides a guide for a) how far the S&P 500 could decline in the next recession and b) when to get back into the market after it has declined.
“The Market Map” - Systematic Process
We will call out specific price objectives (up trends vs. down trends, targets, stop losses, etc.) on the following:
Major US Indices
11 Major US Equity Sectors
US Treasuries
Subscribe today and take advantage of our “70% Off For Life” sale!
This equates to less than $10/month for institutional quality analysis that can pay for itself multiple times over for you and your clients.
Keep reading with a 7-day free trial
Subscribe to Skillman Grove Research to keep reading this post and get 7 days of free access to the full post archives.