


Weekly Chart Review
Risk vs. Reward...

Hey everyone, it’s Jim.
Hope you had a great weekend!
Let’s jump into this week’s newsletter…
In this week’s newsletter:
Stay Informed
Key Macro Events From Last Week (ICYMI)
Key Macro Events To Watch This Week
The Market Map
Application - S&P 500
Deep Dive
Risk vs. Reward…
S&P 500 Fair Value Model
The Market Map - Extended Analysis
Major US Indices
11 Major US Equity Sectors
US Treasuries
Stay Informed
Key Macro Events From Last Week (ICYMI)
Here’s what moved markets last week:
📊 Economic Data
Retail Sales (May report)
Headline retail sales fell 0.9% month-over-month, marking the second consecutive monthly decline—and the largest drop in over two years. (Link)
The decline was led by a 3.5% slump in auto sales, as consumers pulled forward purchases ahead of tariffs; ex‑auto sales also softened, down 0.3%. (Link)
On the plus side, core sales (excluding autos, gas, building materials, food services) rose 0.4%, indicating that underlying consumer strength remains intact. (Link)
FOMC Rate Decision (June 18)
The Fed held the benchmark interest rate steady at 4.25% - 4.50%, as widely anticipated; the accompanying statement emphasized “ongoing restraint” in monetary policy. (Link)
Current Fed Funds Futures are pricing in a 25 basis point rate cut in September and a second 25 basis point rate cut in December. (Link)
Initial & Continuing Jobless Claims
Initial claims for the week ending June 14 were 245,000, down 5,000 week-on-week, in line with expectations. (Link)
However, the 4‑week moving average climbed to 245,500, the highest since August 2023—indicative of cautious labor-market slack. (Link)
🌍 Iran‑Israel Tensions (High‑Level Overview)
Escalation and Military Actions
Exchange of strikes began June 13: Israel targeted Iranian nuclear and military sites; Iran retaliated with missiles and drones—around 150 ballistic missiles and 100+ drones fired at Israel. (Link)
Iran’s strikes resulted in ~430+ killed and 3,500 injured in Iran; Israel reported civilian casualties and around 24 killed. (Link)
Diplomacy vs. Military Pressure
Iran’s FM stated a willingness to resume diplomacy only if Israel halts its strikes. Europe held Geneva talks, but no breakthrough surfaced; Iran also warned Western bases could be attacked if other countries intervene.
U.S. airstrikes (Operation Midnight Hammer)
Conducted early June 22 targeting Iran’s nuclear facilities at Fordow, Natanz, and Isfahan using B‑2 stealth bombers with 14 GBU‑57 bunker‑buster bombs, supported by Tomahawk cruise missiles. (Link)
U.S. officials, including the Pentagon, characterized the damage as “extremely severe,” though Iran claims it was superficial and critical nuclear materials had been relocated. (Link)
Immediate Iranian military response
Iran launched two missile volleys (27 missiles) targeting Israel, hitting areas such as Ben Gurion airport, research, and command centers; around 20 Israeli civilians were wounded; interceptions were reported across central Israel and the Golan Heights. (Link)
Iran’s parliament approved a measure to close the Strait of Hormuz—a strategically vital global oil transit route—pending final approval. (Link)
The biggest impact for global markets will be whether or not Iran decides to block the Straight of Hormuz.
You can see below the current odds (as of this writing) of a closure before July or sometime in 2025.

Key Macro Events To Watch This Week

Core PCE will be closely watched this week, as will any geopolitical developments that may arise on the Israel/Iran conflict front.
Paid subscribers get access to our proprietary S&P 500 Fair Value Model, tactical sector signals, and timing tools—see below for how this can help in the current market environment.
The Market Map - Application - S&P 500
The S&P 500 returned -0.15% last week and remains in a technical downtrend according to our analysis.
Here is our usual weekly time frame overview chart. The picture looks very similar to last week, given the move for the week was only marginally lower.
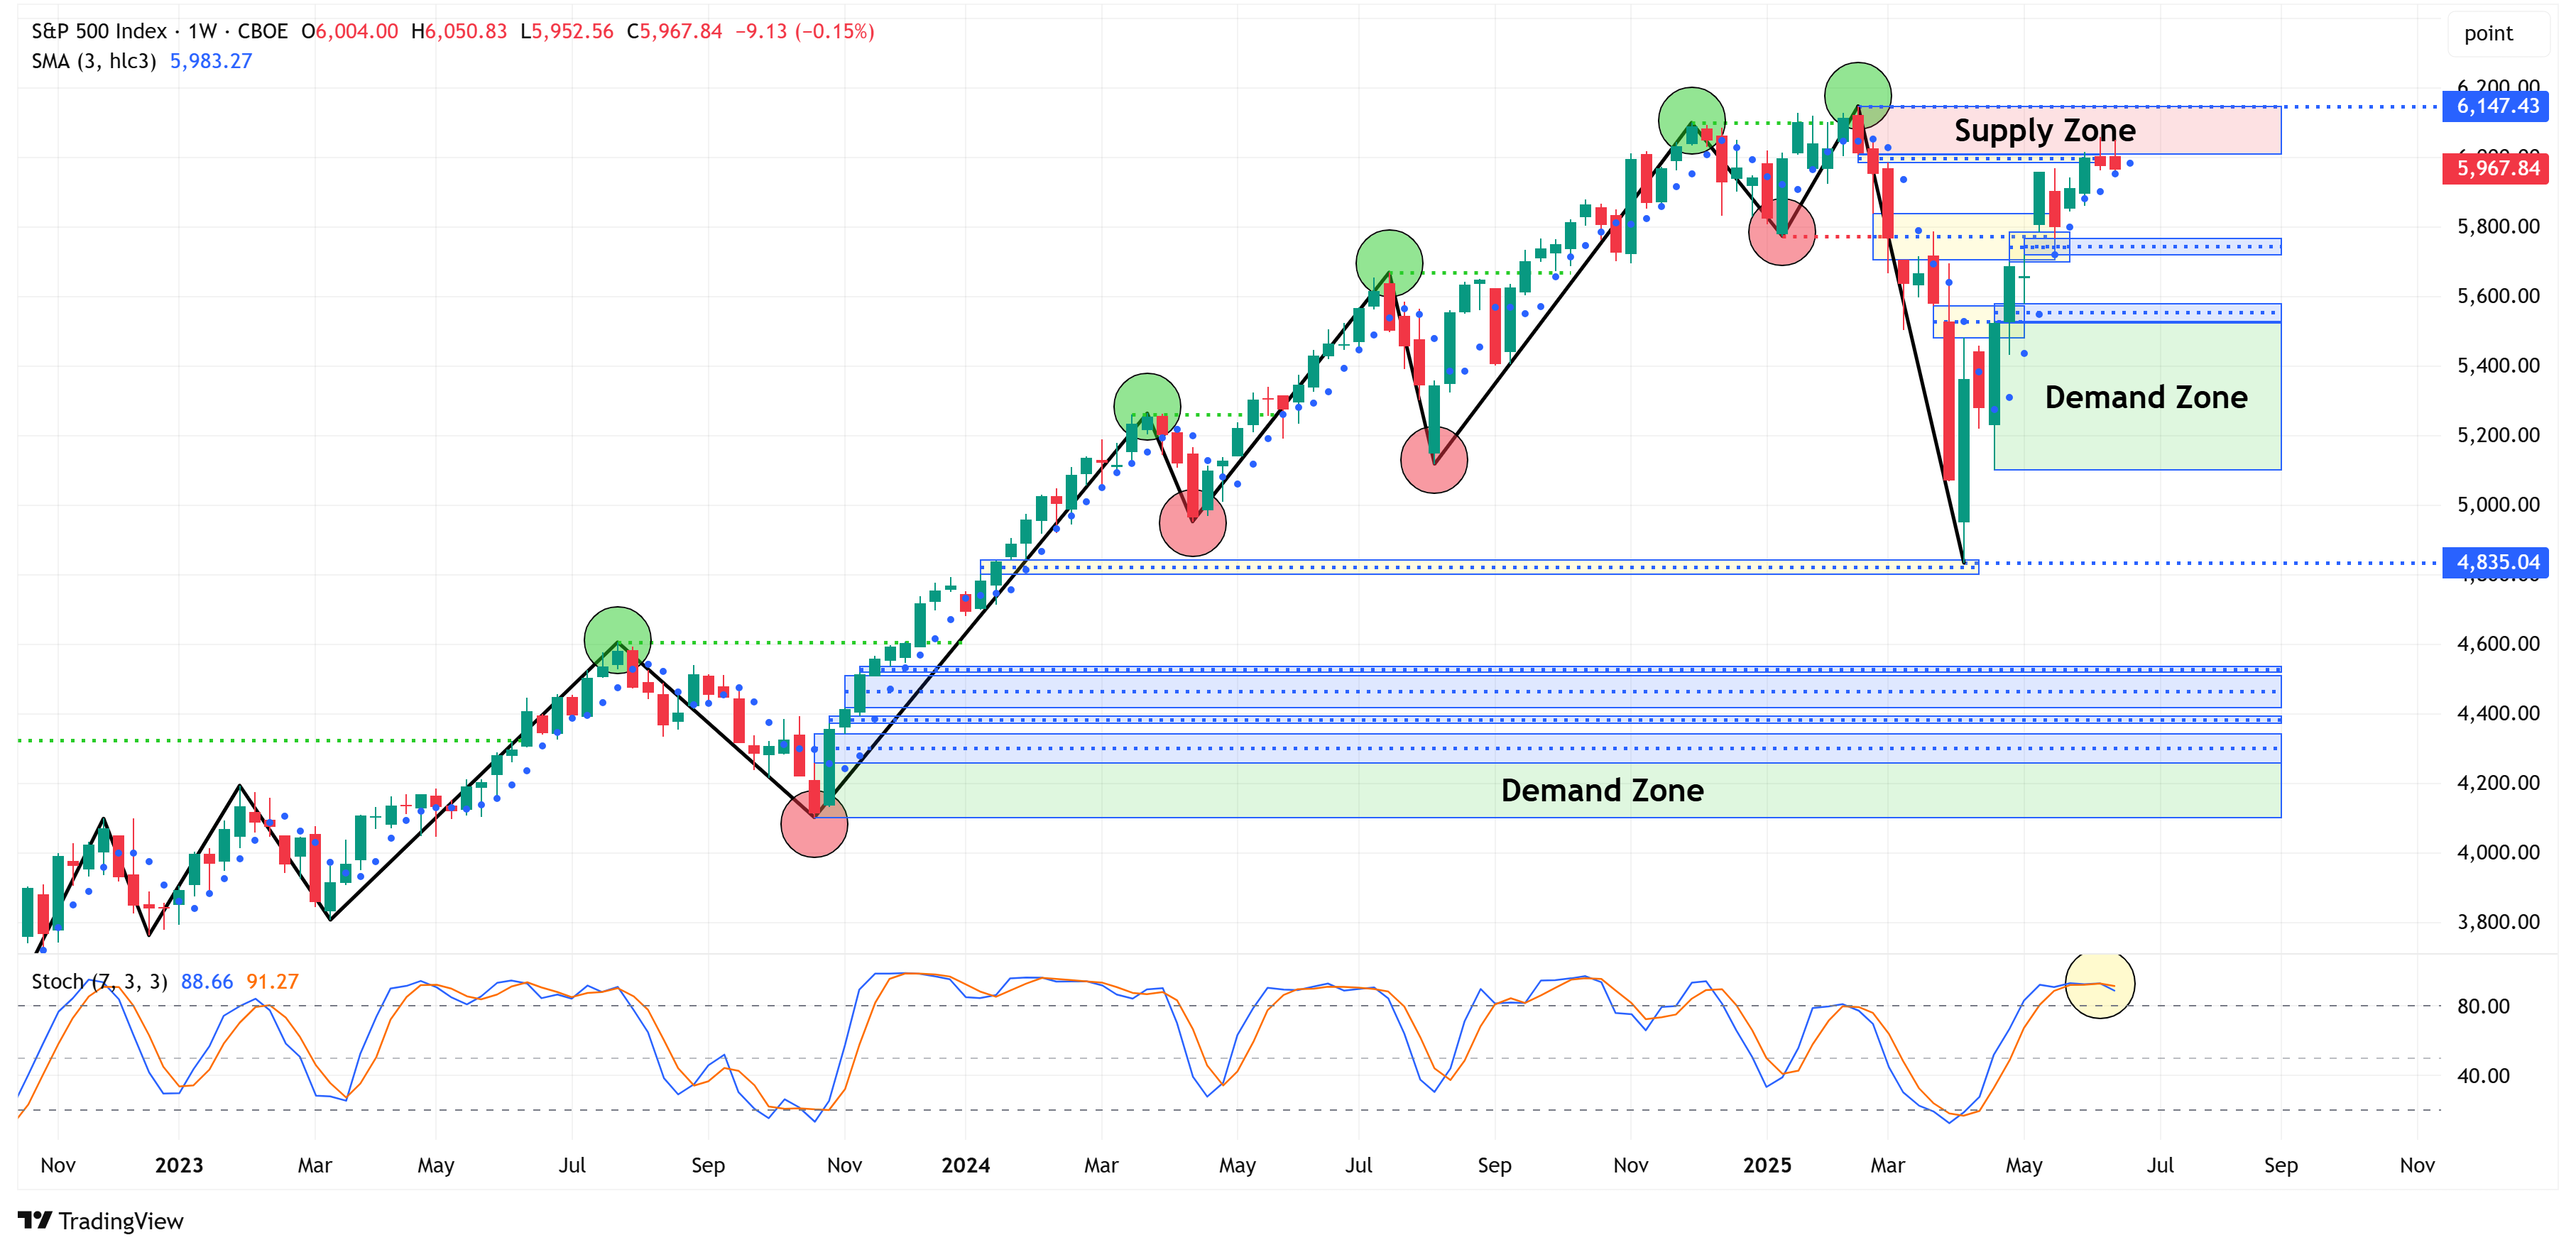
With that said, I’d like to zoom in to point out a couple of key features.
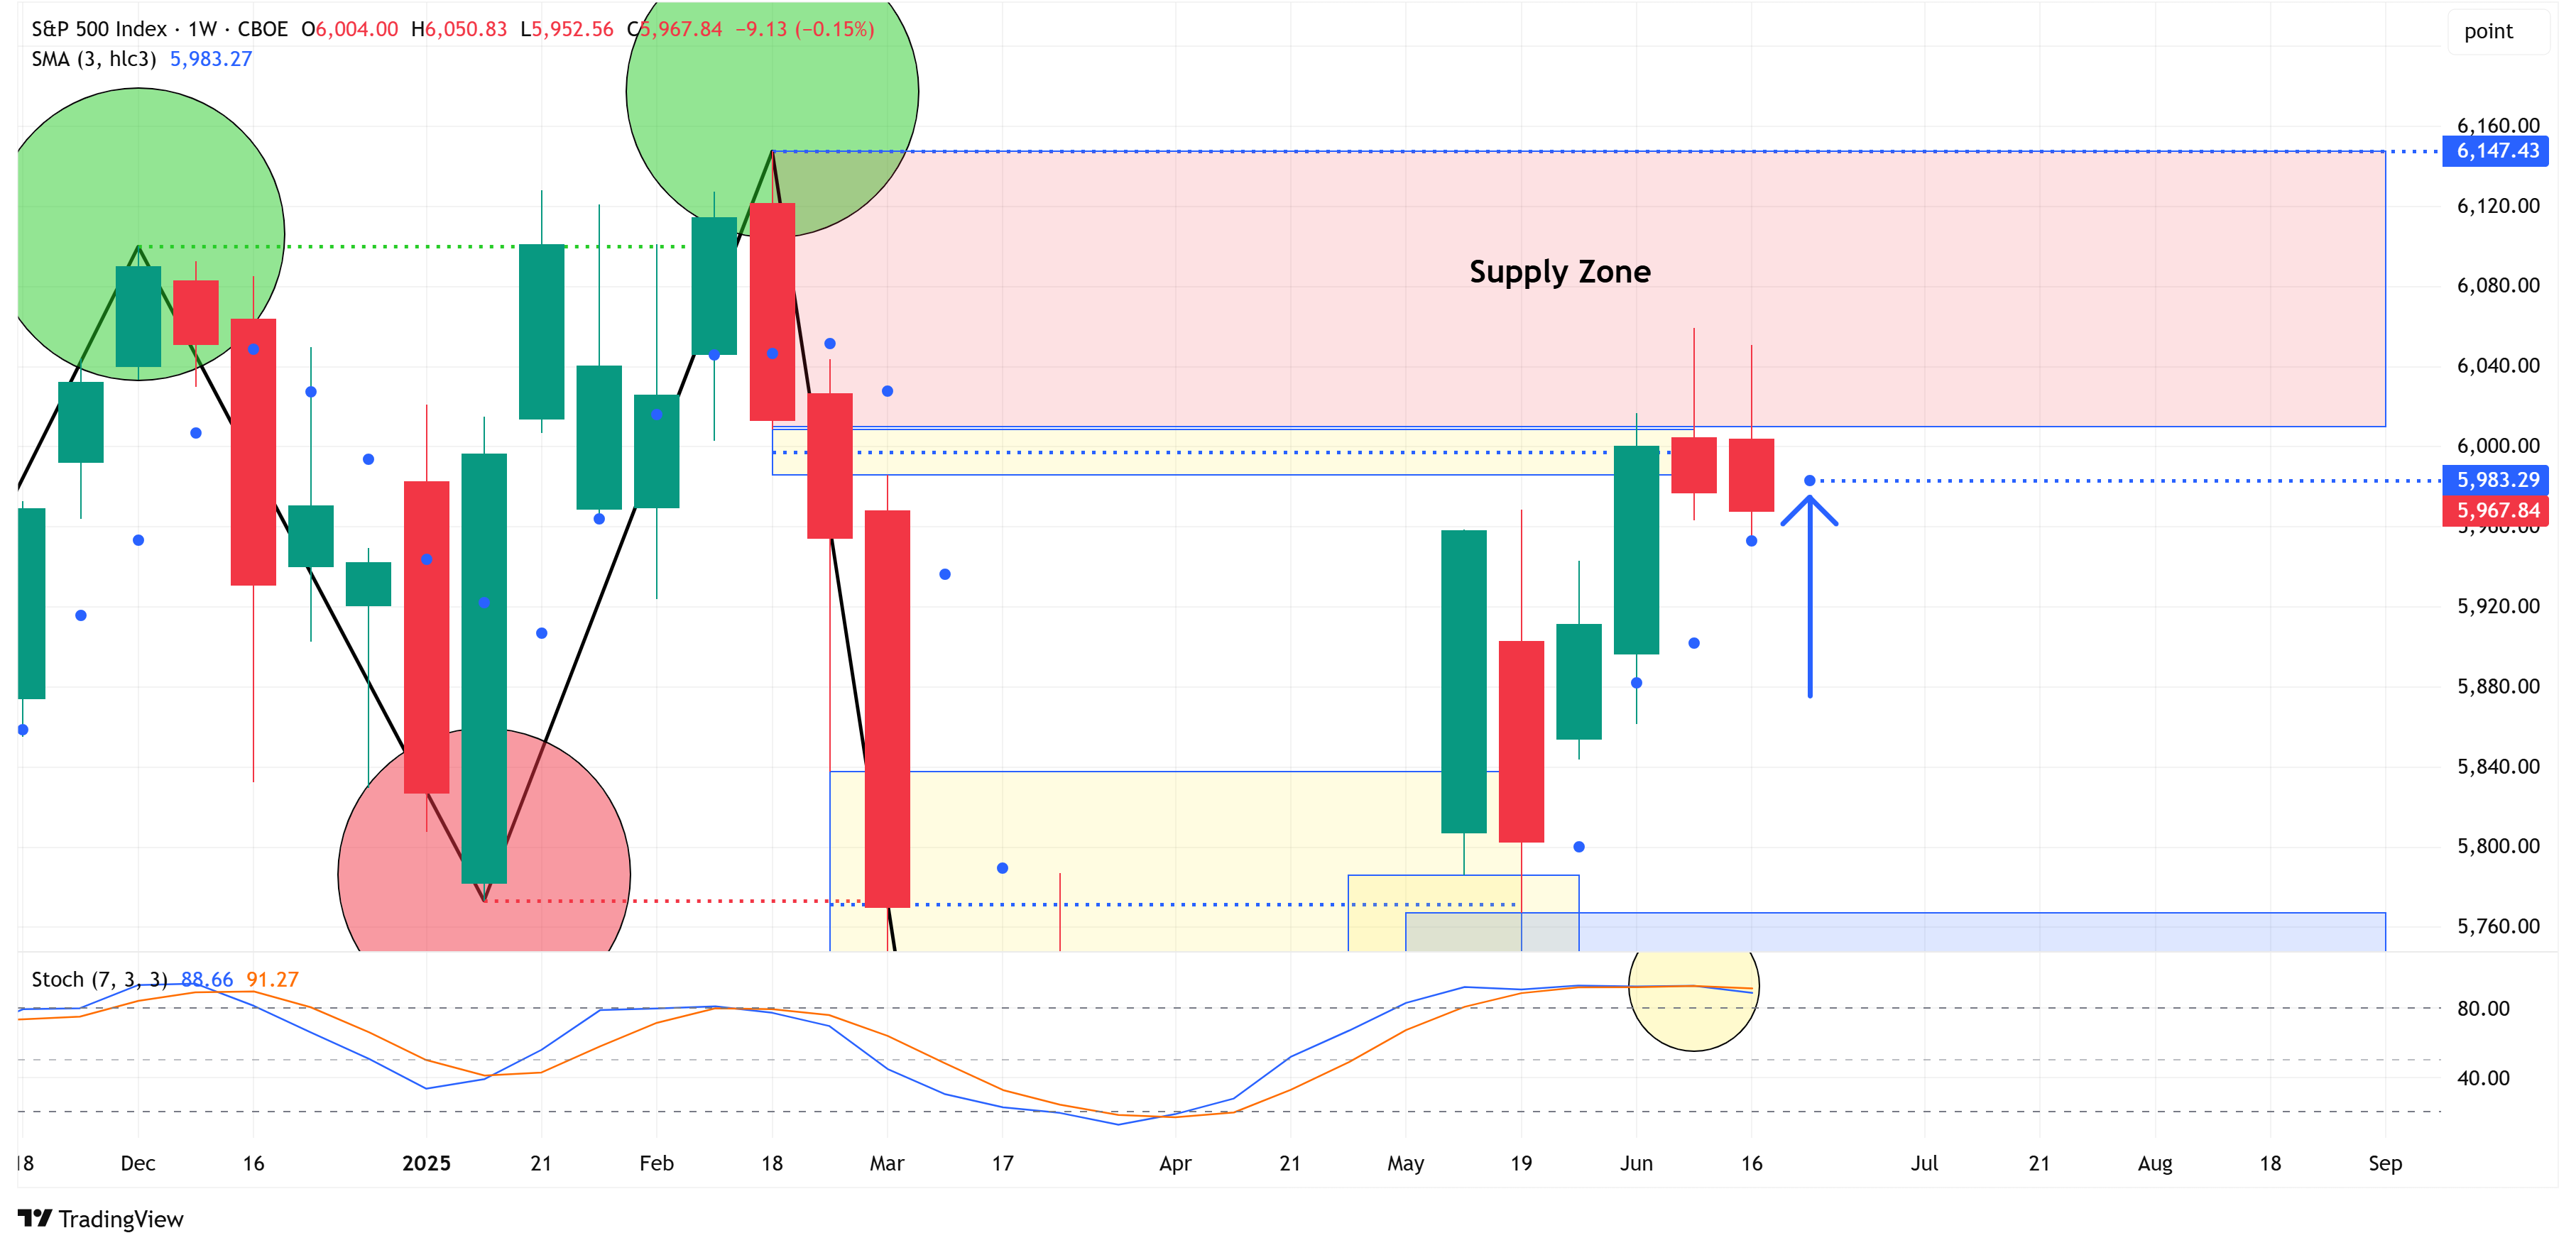
First, note that the weekly candles continue to “hold the dot,” which means that they continue to close above the blue dot.
Friday’s close was below the dot for this week (see the blue arrow). Interpretation = for the uptrend to remain intact, the S&P 500 needs to close above this week’s blue dot (5,983).
Said differently, the S&P 500 needs to have a return of +0.26% or better this week. If not, the path of least resistance will likely be lower.
Second, note that the stochastic indicator in the bottom panel has broken below its moving average and has done so from “overbought” conditions (i.e., the indicator is above 80).
This could quickly resolve itself with a positive close for the S&P 500 this week, but that would not change the fact that the market remains overbought and is due for a correction.
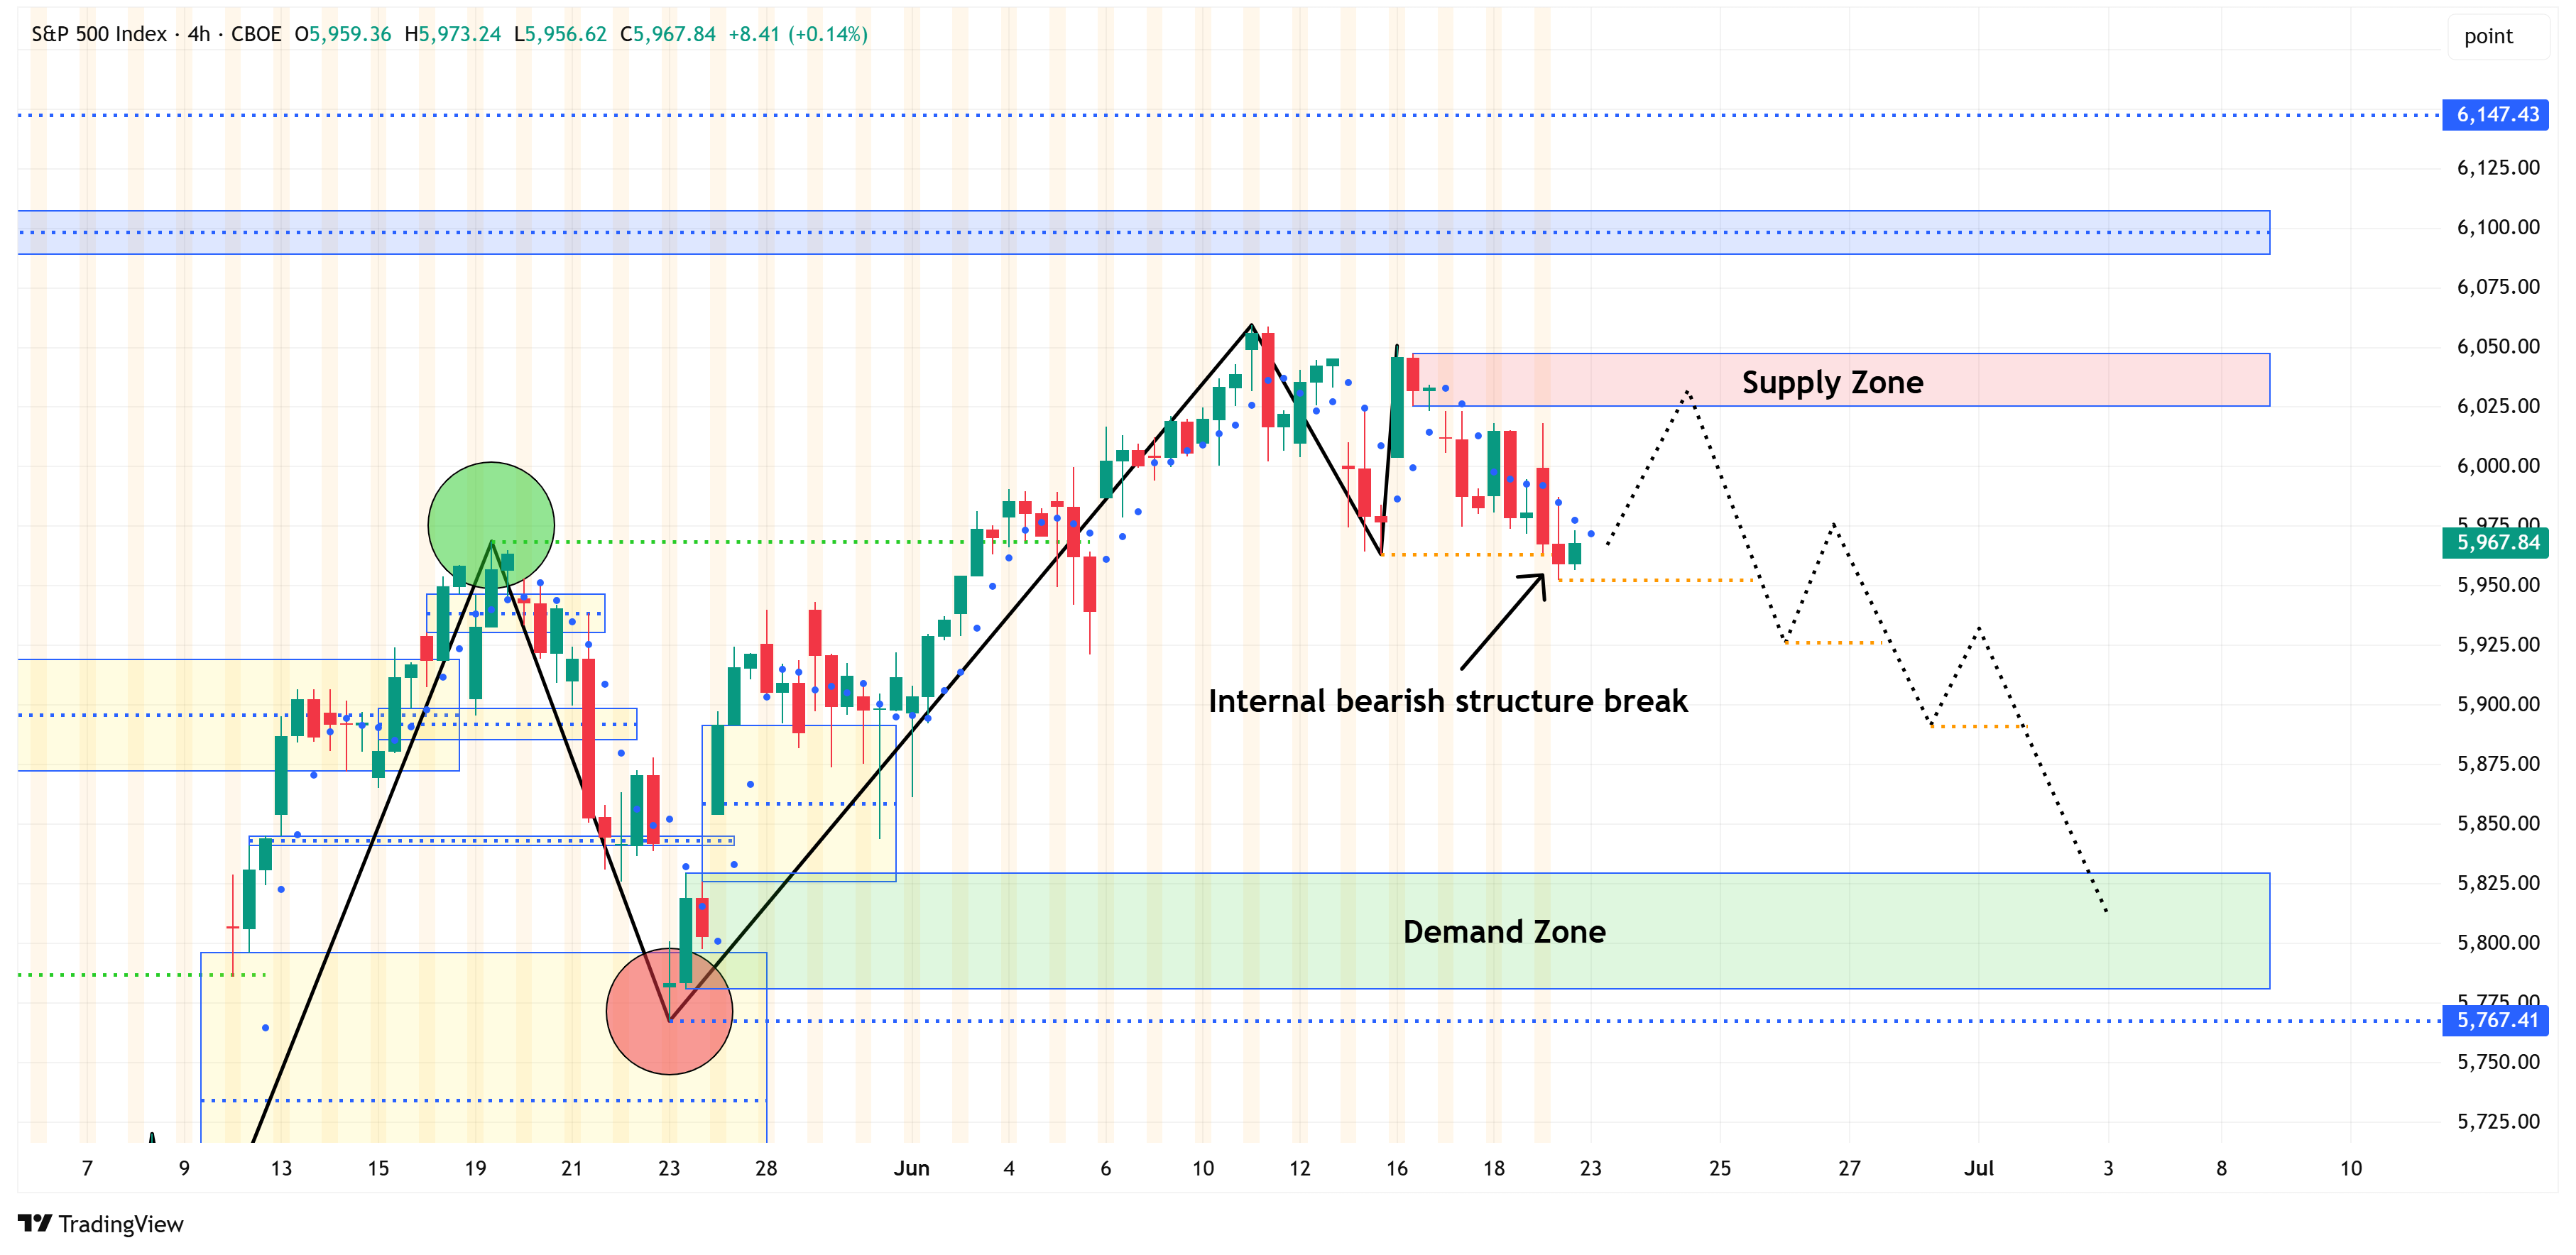
Let’s check in with the lower time frame…
The 4-hour time frame remains bullish; however, it has created an “internal bearish structure break,” which means that it is possible to continue moving lower within the “bullish external structure” (yes, that sounds confusing, but just stay with me…)
I would not be surprised to see a move back up to the “supply zone” and then a continued stair-step move lower until we reach the “demand zone”.
The key at that point will be whether or not we close below the 4-hour swing low value of 5,767.41. If we do, you’ll know the move lower is gaining strength.
In summary, our analysis of the S&P 500 suggests that the chances of a downturn are increasing, and we’ve outlined several signposts above to watch for to confirm this.
If you’re finding this helpful, please consider sharing our newsletter with a colleague. It helps us grow and lets us keep providing this research each week.
Deep Dive
Risk vs. Reward…
Here is an oversimplified view of where the market stands from a market structure standpoint.
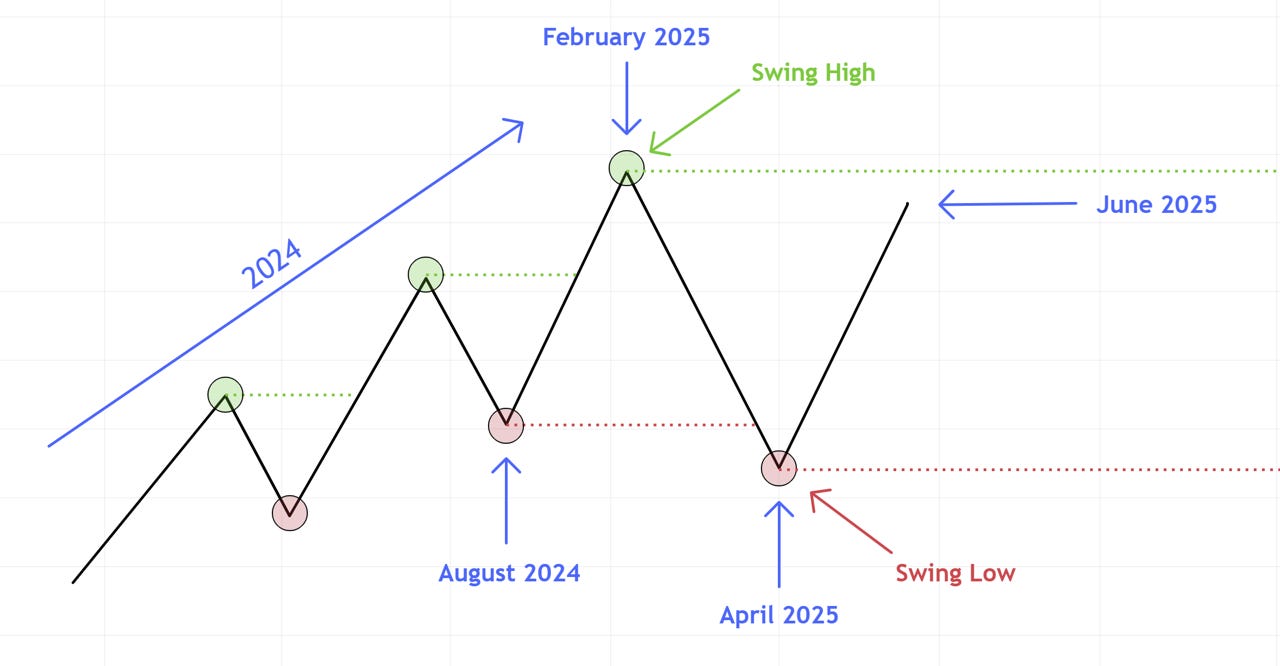
2024 was a positive return year with the market creating a series of higher highs and higher lows.
The market peaked in February 2025 and then made a new “lower low” (i.e., it closed below the low from August 2024) in April 2025.
The market has since moved directionally towards (but not eclipsed) the swing high from February 2025.
Translation
Given that the market took out the swing low from August 2024, this suggests that the market is now in a downtrend, and the rally we’ve seen since April 2025 is nothing more than a bear market rally.
Expectation
If the current market structure holds, we would not expect the market to eclipse the swing high from February 2025.
Instead, we would expect the market to head directionally towards the swing low from April 2025.
Here is an example of how that might look (note the dotted black line).

Risk vs. Reward
Given everything we have identified above, our best risk-to-reward scenario is to be short (or reduce risk if long only) at current levels.
Trade Entry = at or near current price levels.
Stop Loss = just above the swing high from February 2025.
Target Price = swing low from April 2025.
This kind of setup creates a situation where your “reward” is many multiples of your “risk”.

If you scroll down to our paid subscribers section, you’ll notice that a number of the indices, sectors, and US Treasuries that we track have similar setups.
This will provide a guide for which investments you may want to avoid, or which investments you may want to consider adding exposure to from current levels.
It’s not an exaggeration to suggest that if you follow this systematic process and focus on high-value risk-to-reward setups (of which there are plenty right now), you can easily overcome the cost of an annual membership of this newsletter.
Note: The content of this newsletter is for educational purposes only. Price targets and/or stop losses should not be considered a recommendation to buy or sell any security. Please do your research and consult with a professional before making any investment decisions.
The sections that follow are for paid subscribers only.
In these sections, we will discuss our proprietary:
S&P 500 Fair Value Model
This model provides a guide for a) how far the S&P 500 could decline in the next recession and b) when to get back into the market after it has declined.
The Market Map - Extended Analysis
We will call out specific price objectives (up trends vs. down trends, targets, stop losses, etc.) on the following:
Major US Indices
11 Major US Equity Sectors
US Treasuries
Keep reading with a 7-day free trial
Subscribe to Skillman Grove Research to keep reading this post and get 7 days of free access to the full post archives.