This week, we’re going to look at the 11 sectors of the S&P 500 and see how they compare to the overall S&P 500 on a relative basis.
We’re going to do this by looking at weekly charts using Heikin-Ashi candles.
Heikin-Ashi means “average bar” in Japanese and these charts are very useful for analyzing market trends.
For each chart, we have taken the sector’s price and divided it by the S&P 500 (SPY). For example, to analyze the Communication Services Sector (XLC), we would use XLC/SPY.
We will start by looking at the S&P 500 in isolation to get a general sense of where it is heading and then break down each of the individual sectors.
1) S&P 500 (SPY)
The S&P 500 has done two very bullish things this year:
a) It has broken up and through the year-long down trend as represented by the blue line.
b) It has generated six “green candles” in a row which represents a very strong uptrend.
With that said, take note of the “lower highs” we have seen with the three most recent candles. This could be the beginning of a consolidation process. For the S&P 500 to move meaningfully higher, it has to clear the “high wick” from three weeks ago. Should the S&P 500 break down and through the orange trend line of the last six weeks, look for a decline to the blue trend line.
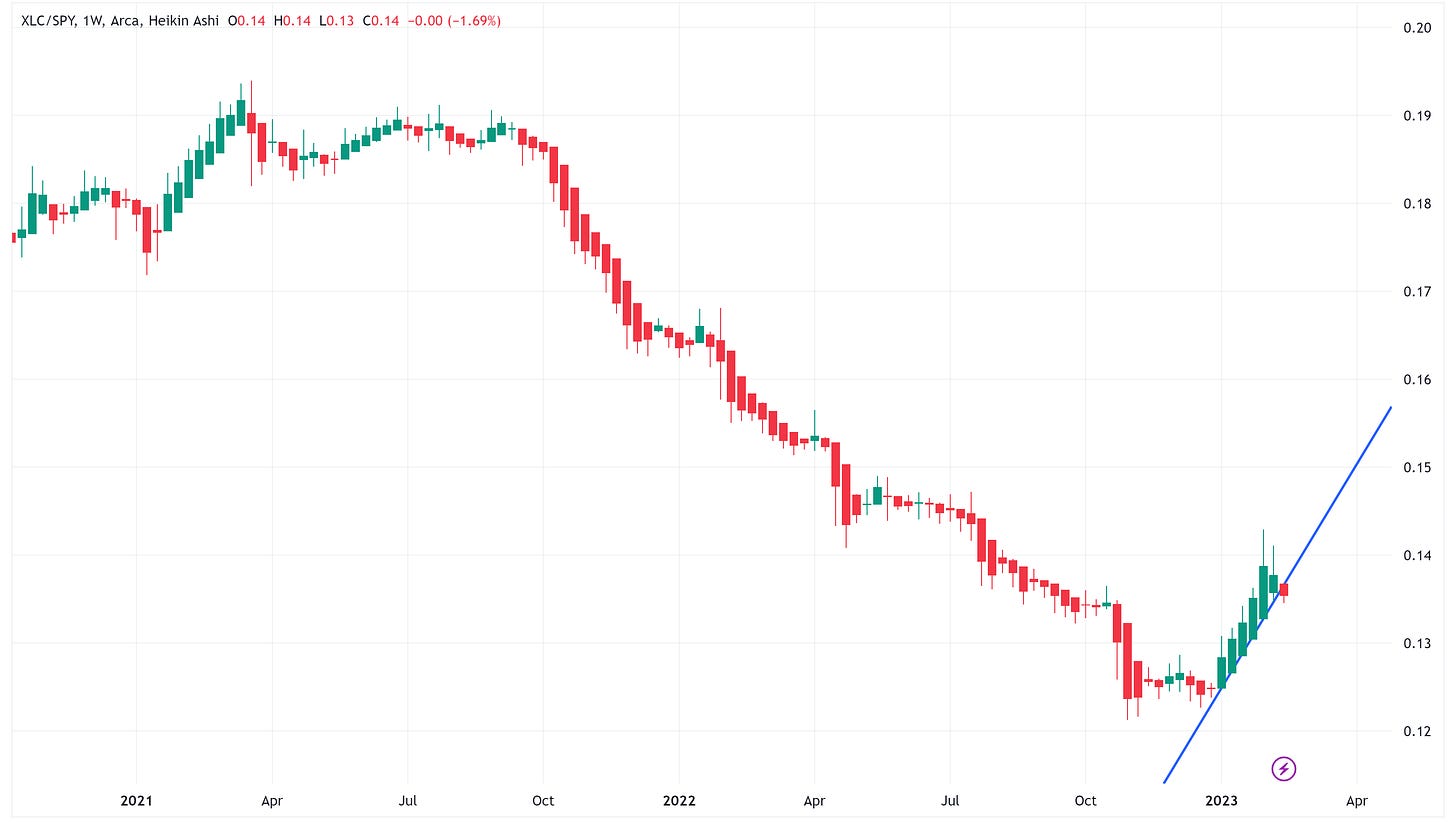
2) Communication Services (XLC/SPY)
Note that after six straight weeks of a strong uptrend, XLC has now broken down and through the upward trendline. This is its first sign of weakness and should be watched closely. If it doesn’t get back above the trendline this week, look for a continued move lower.
3) Consumer Discretionary (XLY/SPY)
This continues to be one of the stronger sectors as evidenced by six straight weeks of green uptrend candles. However, note the “lower high” of the most recent wick vs. three weeks ago. This could be the beginning of a consolidation process but still one of the stronger sectors vs. SPY.
4) Consumer Staples (XLP/SPY)
YTD this has been one of the weakest sectors on a relative basis. With that said, take note of the fact that XLP looks like it trying to make a reversal. Also, last week’s move appears to be similar to the “bull hammer” that was created towards the end of March, early April in 2022. Note what happened after that. For this bullish move to continue, look for the XLP/SPY to cross above the blue trendline. Worth noting, if the SPY does consolidate and move lower, the Consumer Staples sector is more defensive in nature and where a lot of investors like to hide-out to ride out the storm so a positive move from here, on a relative basis, would make sense.
5) Energy (XLE/SPY)
After creating a “rising wedge” pattern for most of the last 9 months, Energy has now broken through the downside of that wedge pattern. This tends to be bearish. For this to turn around, XLE/SPY needs to break up and through the blue trendline.
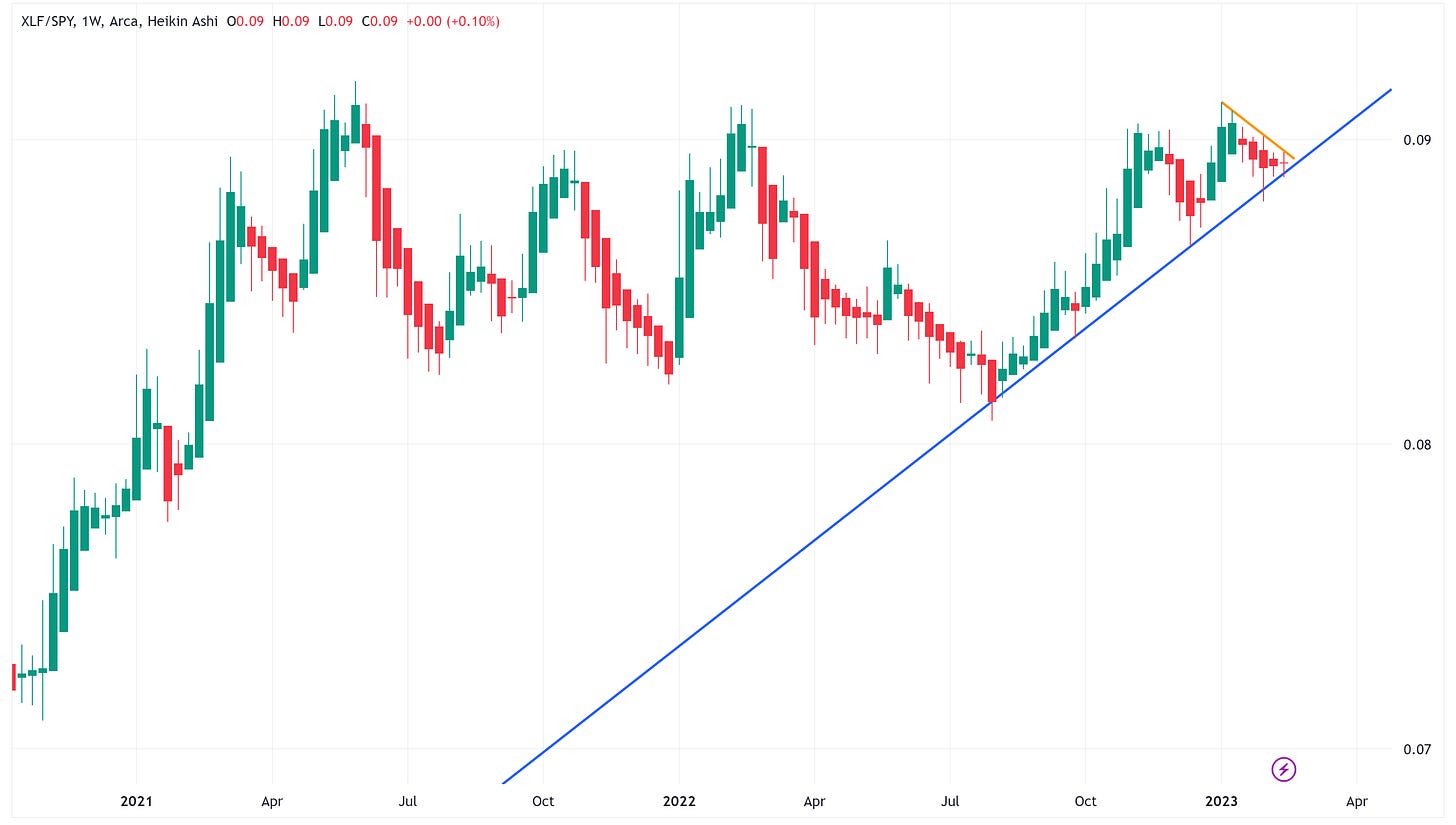
6) Financial (XLF/SPY)
XLF has had a pretty decent run, relative to SPY, since August with a couple pullbacks along the way. We’re in one of those pullbacks right now. The key question is how it resolves itself and we should get that answer this week. Avoid XLF for now until you see which way this breaks.
7) Health Care (XLV/SPY)
XLV has had a fairly prolonged period of positive performance relative to SPY as evidenced by the upward channel on the chart. However, more recently, XLV has taken it on the chin relative to SPY. Similar to Consumer Staples, Health Care is one of the more defensive sectors and often where you see people hide-out when the S&P 500 starts to move lower. Also, note that XLV appears to be forming a reversal pattern. XLV might be a good place to be if it can complete the reversal and move above the blue trendline.
8) Industrial (XLI/SPY)
XLI had an extremely strong run from October to the beginning of the year relative to SPY. That has reversed itself YTD until this last week. XLI has now broken through the blue trendline which, all else being equal, is bullish for XLI relative to SPY at least in the short-run.
9) Materials (XLB/SPY)
Similar to XLI, XLB had a very strong run, relative to SPY, from October to the end of the year. However, unlike XLI, XLB still remains bearish as it has not even attempted to make a reversal or even challenge the blue trendline. Assume it continues to move lower until it tells you otherwise.
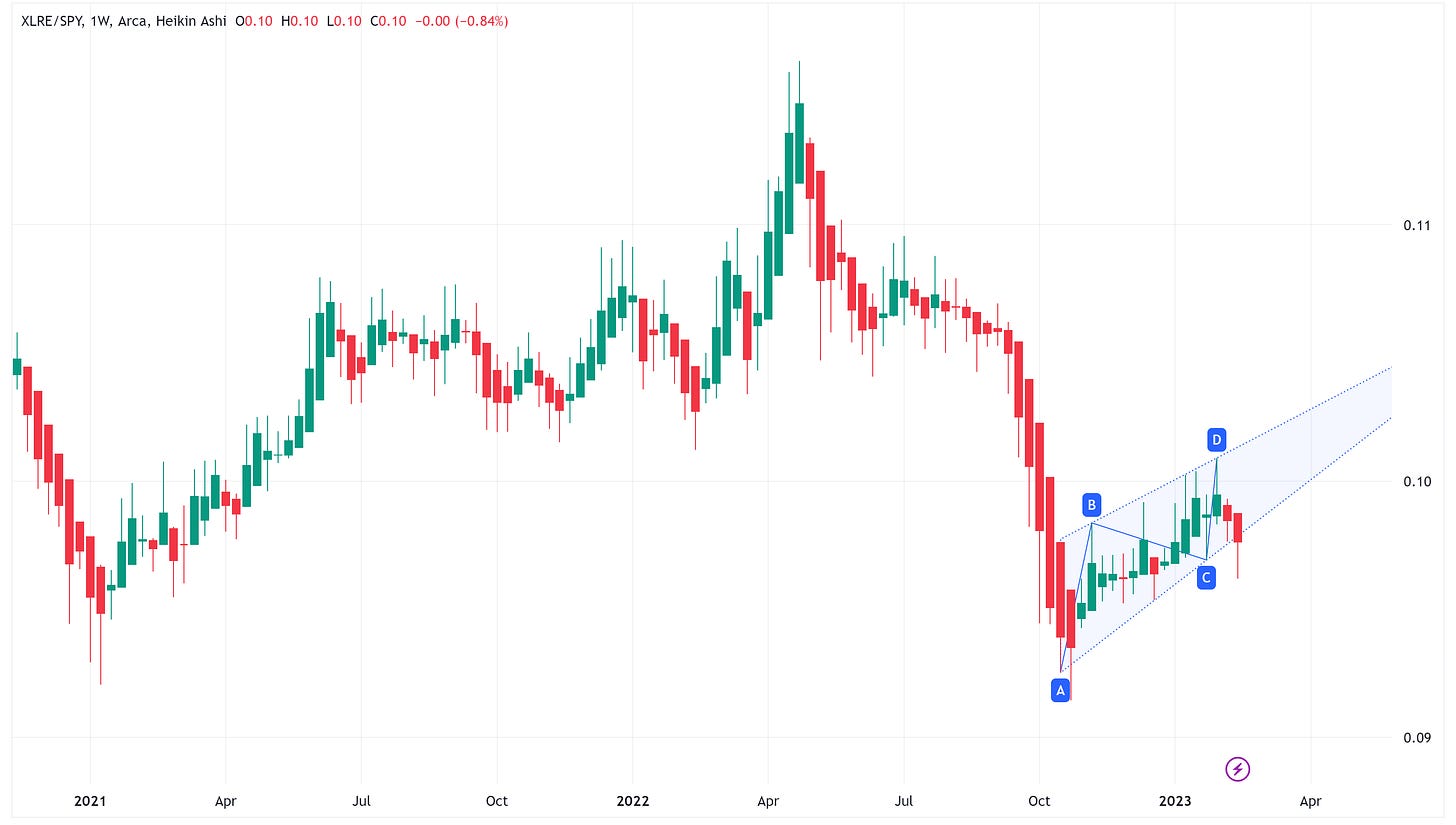
10) Real Estate (XLRE/SPY)
XLRE has formed a bit of a rising wedge pattern since last October. With that said, the last two weeks have been tough relative to SPY. XLRE is at the point of needing prove itself one way or another. It either needs to jump back in the wedge this week or the bias will be towards a continuation of the downtrend we’ve seen the last two weeks.
11) Technology (XLK/SPY)
There’s no other way to put it, XLK has had an extremely strong YTD run so far relative to SPY. I would also argue that a “double bottom” has been created which would suggest an even higher move from here, probably somewhere in the neighborhood of the highs we saw in August.
12) Utilities (XLU/SPY)
XLU has had a tough go of it relative to SPY on a YTD basis. It even appears to have formed a Head & Shoulders pattern which typically means a measured move lower. With that said, for the H&S pattern to be completed, the neckline has to be broken and that has not happened. Similar to our other two defensive sectors (Consumer Staples & Health Care), Utilities appears to be bouncing off the neckline and starting to attempt a reversal.
Summary
What speaks loudly this week are the potential reversals we are seeing in the defensive sectors (Consumer Staples, Health Care, and Utilities).
Worth noting, these reversals are not complete yet but they appear to be the early signs of a possible reversal.
If that is the case, we have to ask ourselves “why”. As noted above, people like to hide-out in the defensive sectors when they think the S&P 500 is poised to move lower. Could this be some early positioning in that direction? I don’t know but the S&P 500 does appear to be consolidating so maybe that is the case.
Outside of that, the big standout this week is the continued strong move higher for Technology. I think this still has legs but will be more difficult if the overall market comes under pressure.


