Weekly Chart Review
Green candles...
Just a quick note this week as I am leaving to go on a mission trip with my oldest daughter to Costa Rica.
For the last two weeks, I’ve said:
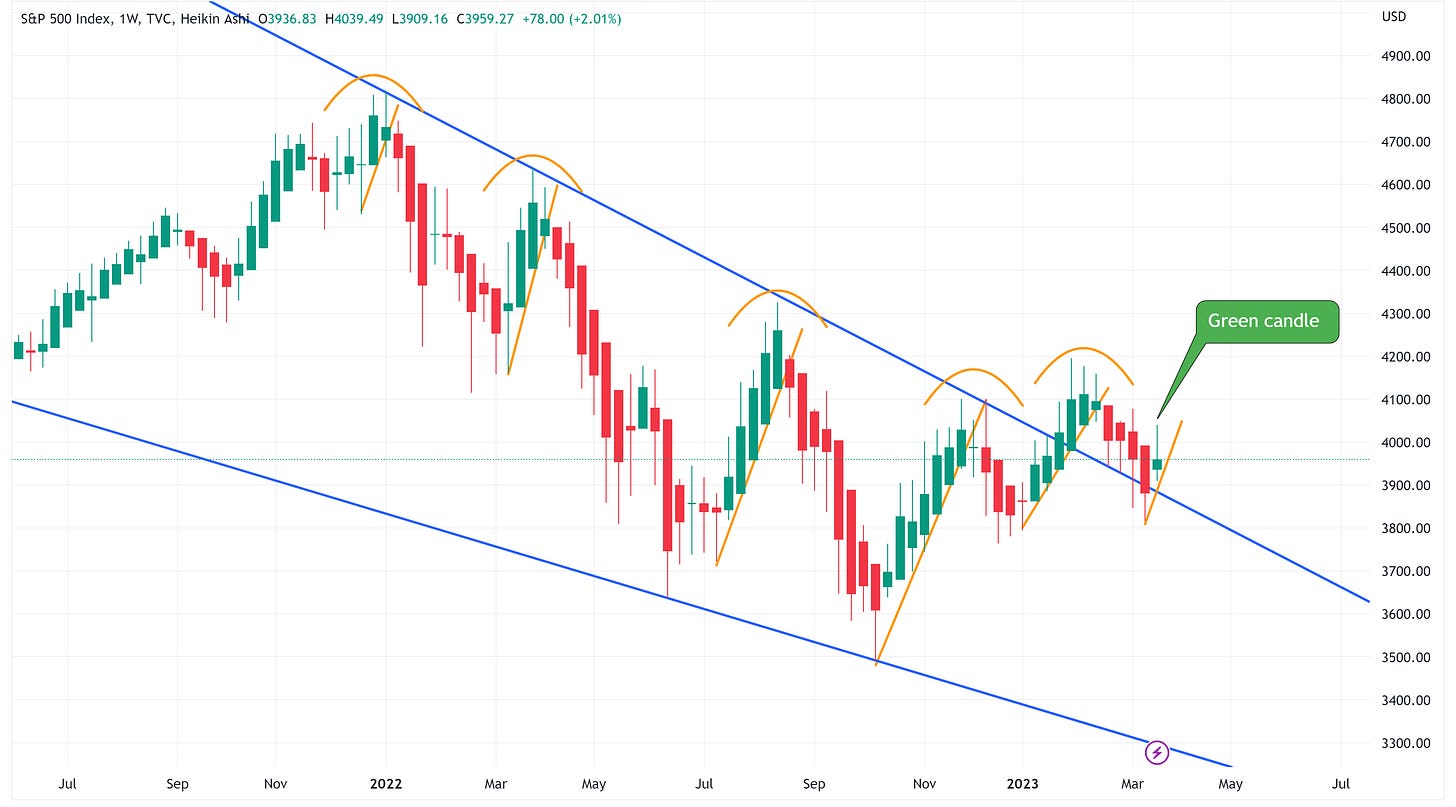
“At a minimum, I would wait for a “green candle” on the Heikin Ashi weekly chart before I considered getting long again.”
You can see below that we did indeed get a “green candle” with yesterday’s weekly close. We could ride this rally for several weeks if history is a guide.
Recall what I noted in “Bear Stearns Failed 15 Years Ago Today” in reference to the period just after the Bear Stearns failure (substitute Silicon Valley Bank or Credit Suisse for Bear Stearns in the present day scenario):
“Over the next 63 days, the S&P 500 would go on to appreciate by 14.58% (intra-day low to intra-day high).”
After that, I noted:
“That was followed by a 291-day period where the S&P 500 fell by -53.70% (intra-day high to intra-day low).”
I also suggested to not get too comfortable with this rally when I said:
“Don’t lose sight of what happened in 2008 after the initial snapback rally. There will be additional bank failures or other areas of the market that “break”, it is inevitable in my opinion.”
I still believe this to be true. Therefore, ride this rally for now but you need to have an unemotional systematic means for knowing when to get defensive again.
Next logical question, how far do we think this current rally can go?
I can make the case that we could be in the process of forming an inverted Head & Shoulders pattern (not confirmed at this point). If that is the case, our first target is 4,277, or 7.73% higher than Friday’s close. If that target is achieved, our second target becomes 4,532, or 14.14% higher than Friday’s close. Worth reiterating, this inverse Head & Shoulders pattern has not been confirmed so this is pure speculation at this point.
We’ve reached the “keep your head on a swivel” stage of the cycle so be careful out there and have a plan for how and when to get more defensive.


