Weekly Chart Review
An ounce of prevention is worth a pound of cure...
The title of last week’s newsletter was “The Recession Has Begun…”. That wasn’t a veiled attempt at creating a “click-bait” title, I genuinely believe that to be true.
Over the last six months, I have pointed to various economic indicators that have suggested the economy is slowing and I believe we’re finally starting to see that play out.
I noted last week that the Sahm Rule was officially triggered with the release of the most recent Unemployment Report. Historically, when the Sahm Rule was triggered, the recession had already begun.
According to Claudia Sahm (the creator of the Sahm Rule), the economy is approximately 3 months into a recession when her rule triggers.
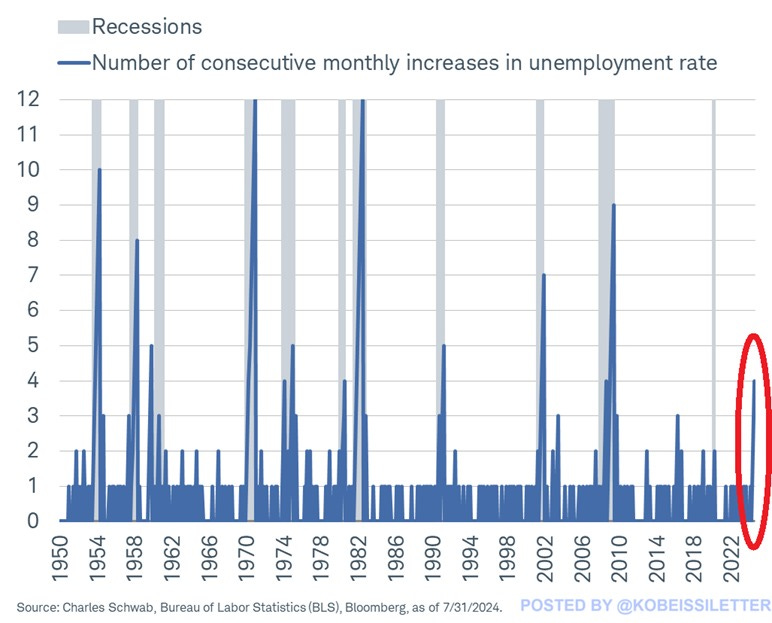
In addition to the Sahm Rule, I saw an interesting post from “The Kobeissi Letter” last week which provided the following commentary and chart:
“The US unemployment rate has risen for 4 consecutive months, the longest streak since the 2008 Financial Crisis.
Over the last 75 years, every time unemployment rose for 4 consecutive months, the US economy entered recession.”
The evidence continues to mount that the US economy is now in recession.
This means that when the National Bureau of Economic Research (NBER) goes back and dates the recession, they will likely point to 2Q24 or 3Q24 as the starting point.
Okay, great, so what do we do with this information…
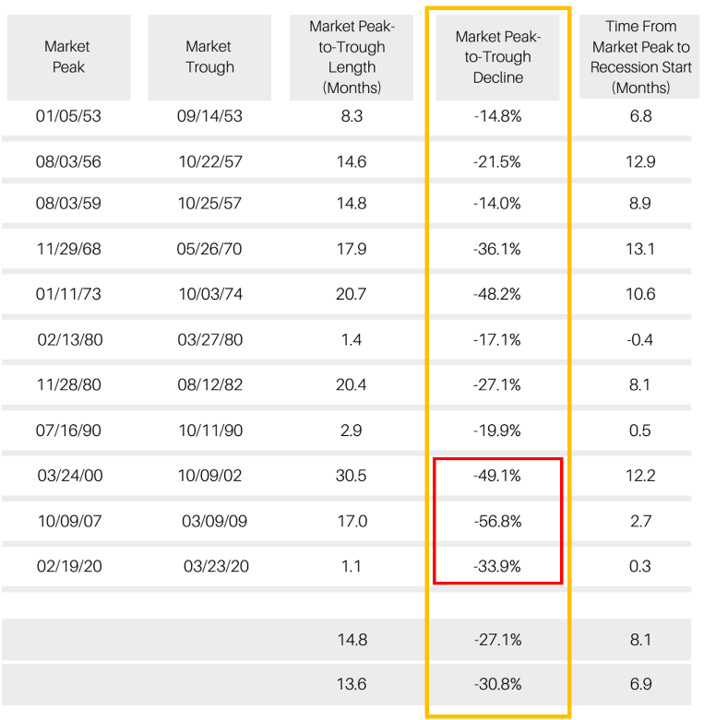
Here is a table from Kathmere Capital Management. I’d like to focus our attention on the highlighted column (“Market Peak-to-Trough Decline”).
The data show that over the last 11 recessions, the peak-to-trough decline for the S&P 500 Index during a recessionary period was on average -30.8%.
Further, it is worth noting that the three recessions that have occurred during this century have had an average peak-to-trough decline of -46.6% which skews to the high side of the historical average.
Keep reading with a 7-day free trial
Subscribe to Skillman Grove Research to keep reading this post and get 7 days of free access to the full post archives.


