Weekly Chart Review
Happy Monday!
Let’s start by looking at our “Absolute Value” chart. Similar to last week, we have two sectors (Communication Services and Technology) and the S&P 500 Index that have pushed past the 2.0 standard deviation threshold.
As I always like to suggest, once we get past the 2.0 standard deviation threshold, this is where we want to have our antenna up for a possible pullback or at best, a consolidating move sideways.
I will take a look at the charts for these two sectors and the S&P 500 Index in the section below to see if we can glean any additional information.
Turning now to our “Relative Value” charts. We continue to have the same story we’ve had for several weeks now which is that Technology continues to outpace everything else and the traditionally “defensive” sectors (Utilities, Health Care, and Consumer Staples) continue to be “Cheap & Oversold”.
When the next correction occurs, investors will likely flock to the defensive sectors so it may make some sense to take a look at these sectors in advance of that move.
The Charts
All three charts are exhibiting two similarities which ironically are creating a bit of a “tug-of-war” as to what happens next:
Each is displaying an inverse “Head & Shoulders” pattern which would suggest a continued move higher is possible.
Each is facing some resistance getting past its current level.
This “tug-of-war” will likely resolve itself over the next couple of days/weeks so stay tuned.
Communication Services
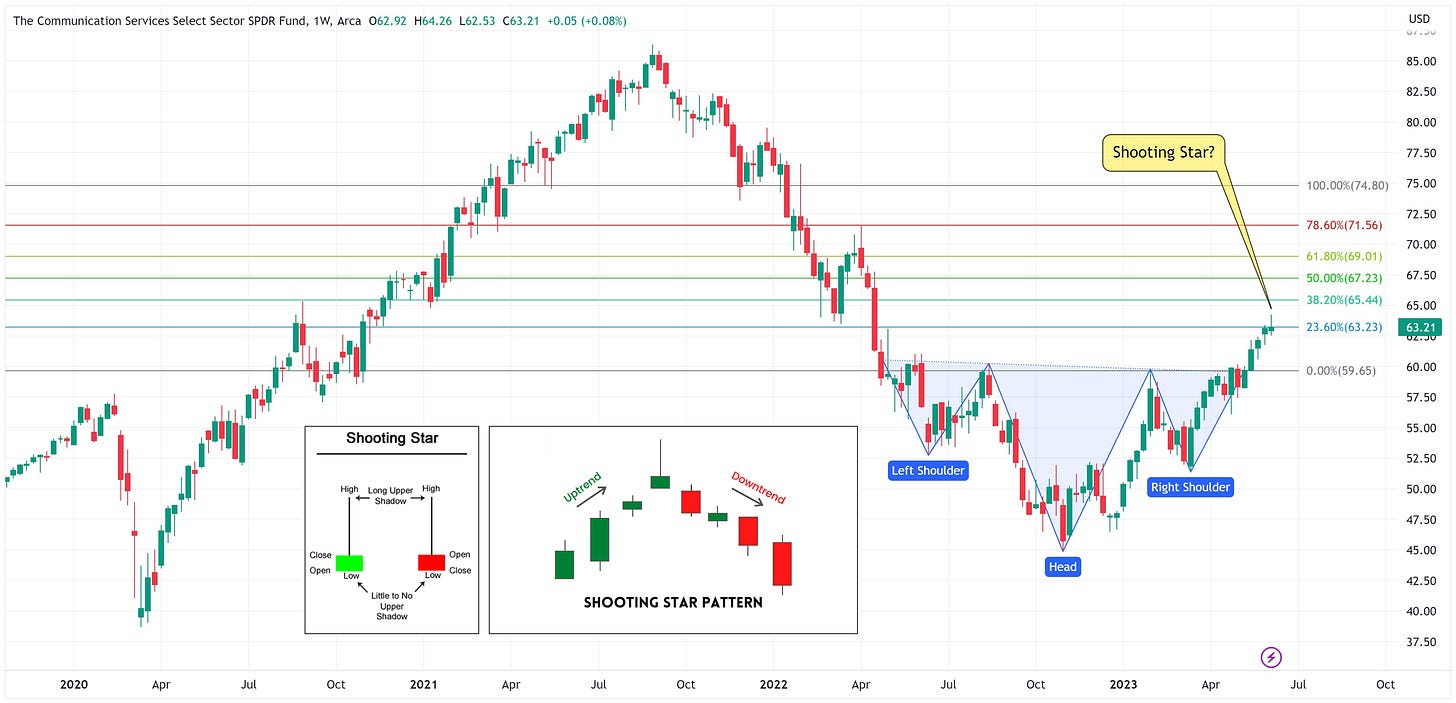
The Communication Services inverse head & shoulders pattern is calling for a target of 74.80 which is ~18% higher than Friday’s close. However, last week’s close appears to have created a “shooting star” pattern.
Shooting star patterns are typically associated with a topping pattern (see inset). Further, note how the shooting star pattern occurred at exactly the 23.60% Fibonacci level thus proving to be resistance for the sector for two weeks in a row.
Technology
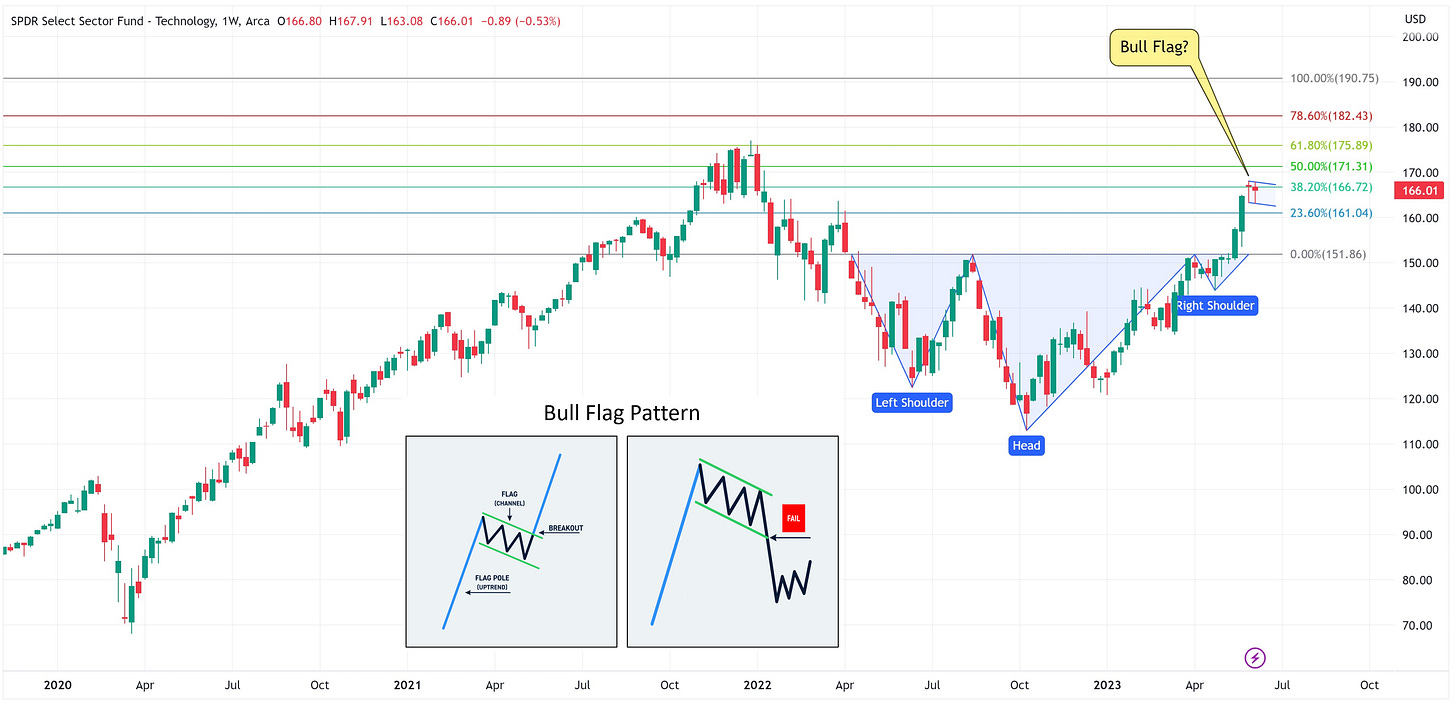
The Technology sector’s inverse head & shoulders pattern is calling for a target of 190.75 or ~15% higher than Friday’s close. However, the last two weeks have created “red candles” and potentially a “bull flag”.
Bull flag patterns typically resolve themselves in one of two ways. Either a consolidating move sideways to down before exploding higher or a consolidating move sideways to down before “failing” and moving lower (see inset).
While we don’t know which way this will resolve itself, it is interesting to note that the 38.20% Fibonacci level is proving to be resistance here.
S&P 500
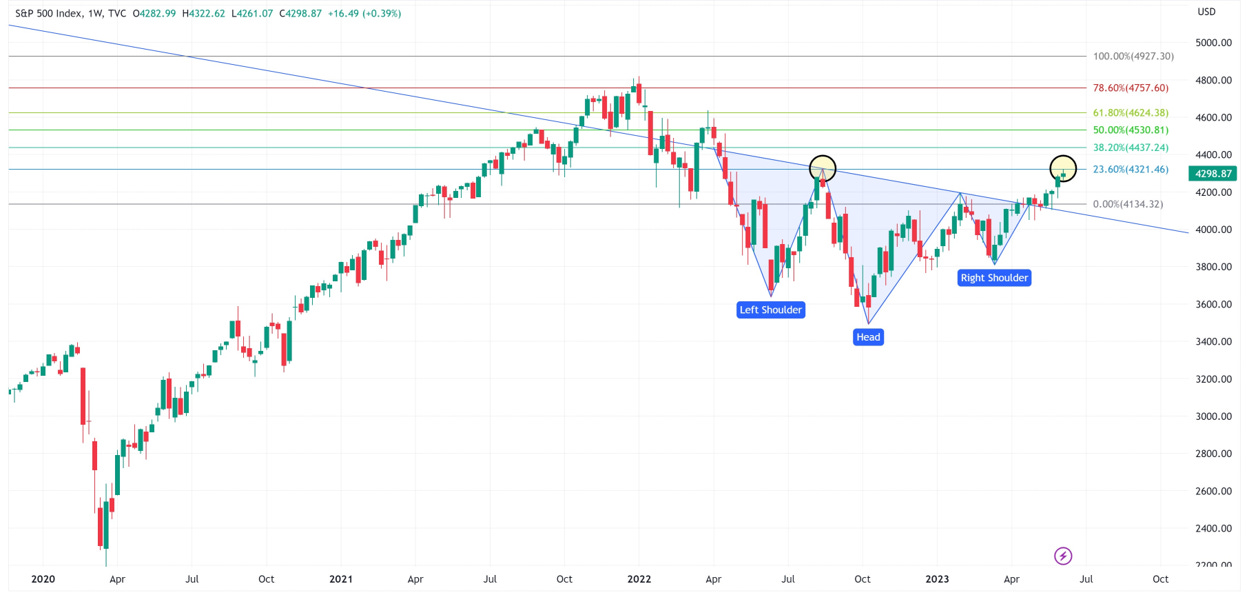
The S&P 500’s inverse head & shoulders pattern is calling for a target of 4,927 or ~15% higher than Friday’s close. Here again, the 23.60% Fibonacci level is proving to be resistance. The last time this happened (yellow circles), it was the beginning of a multi-week move lower for the index.
Conclusion
While these two sectors and the S&P 500 Index are firmly in the “Expensive & Overbought” quadrant, they are exibiting characteristics that suggest they could go even higher. With that said, they are having trouble getting past their current levels. Which way will these resolve themselves? I think the next week or two will provide the answer so stay tuned.
Until next time…


