


Weekly Chart Review
Strong like bull...

What a week last week!
From the FOMC meeting to the New York Community Bancorp news to the payrolls report to US military strikes in Iraq and Syria…the market had plenty of reasons to sell off but the rally in US equities continues!
Regular readers know that I have been suggesting that the S&P 500 and NASDAQ appear to be on a path toward even further highs.
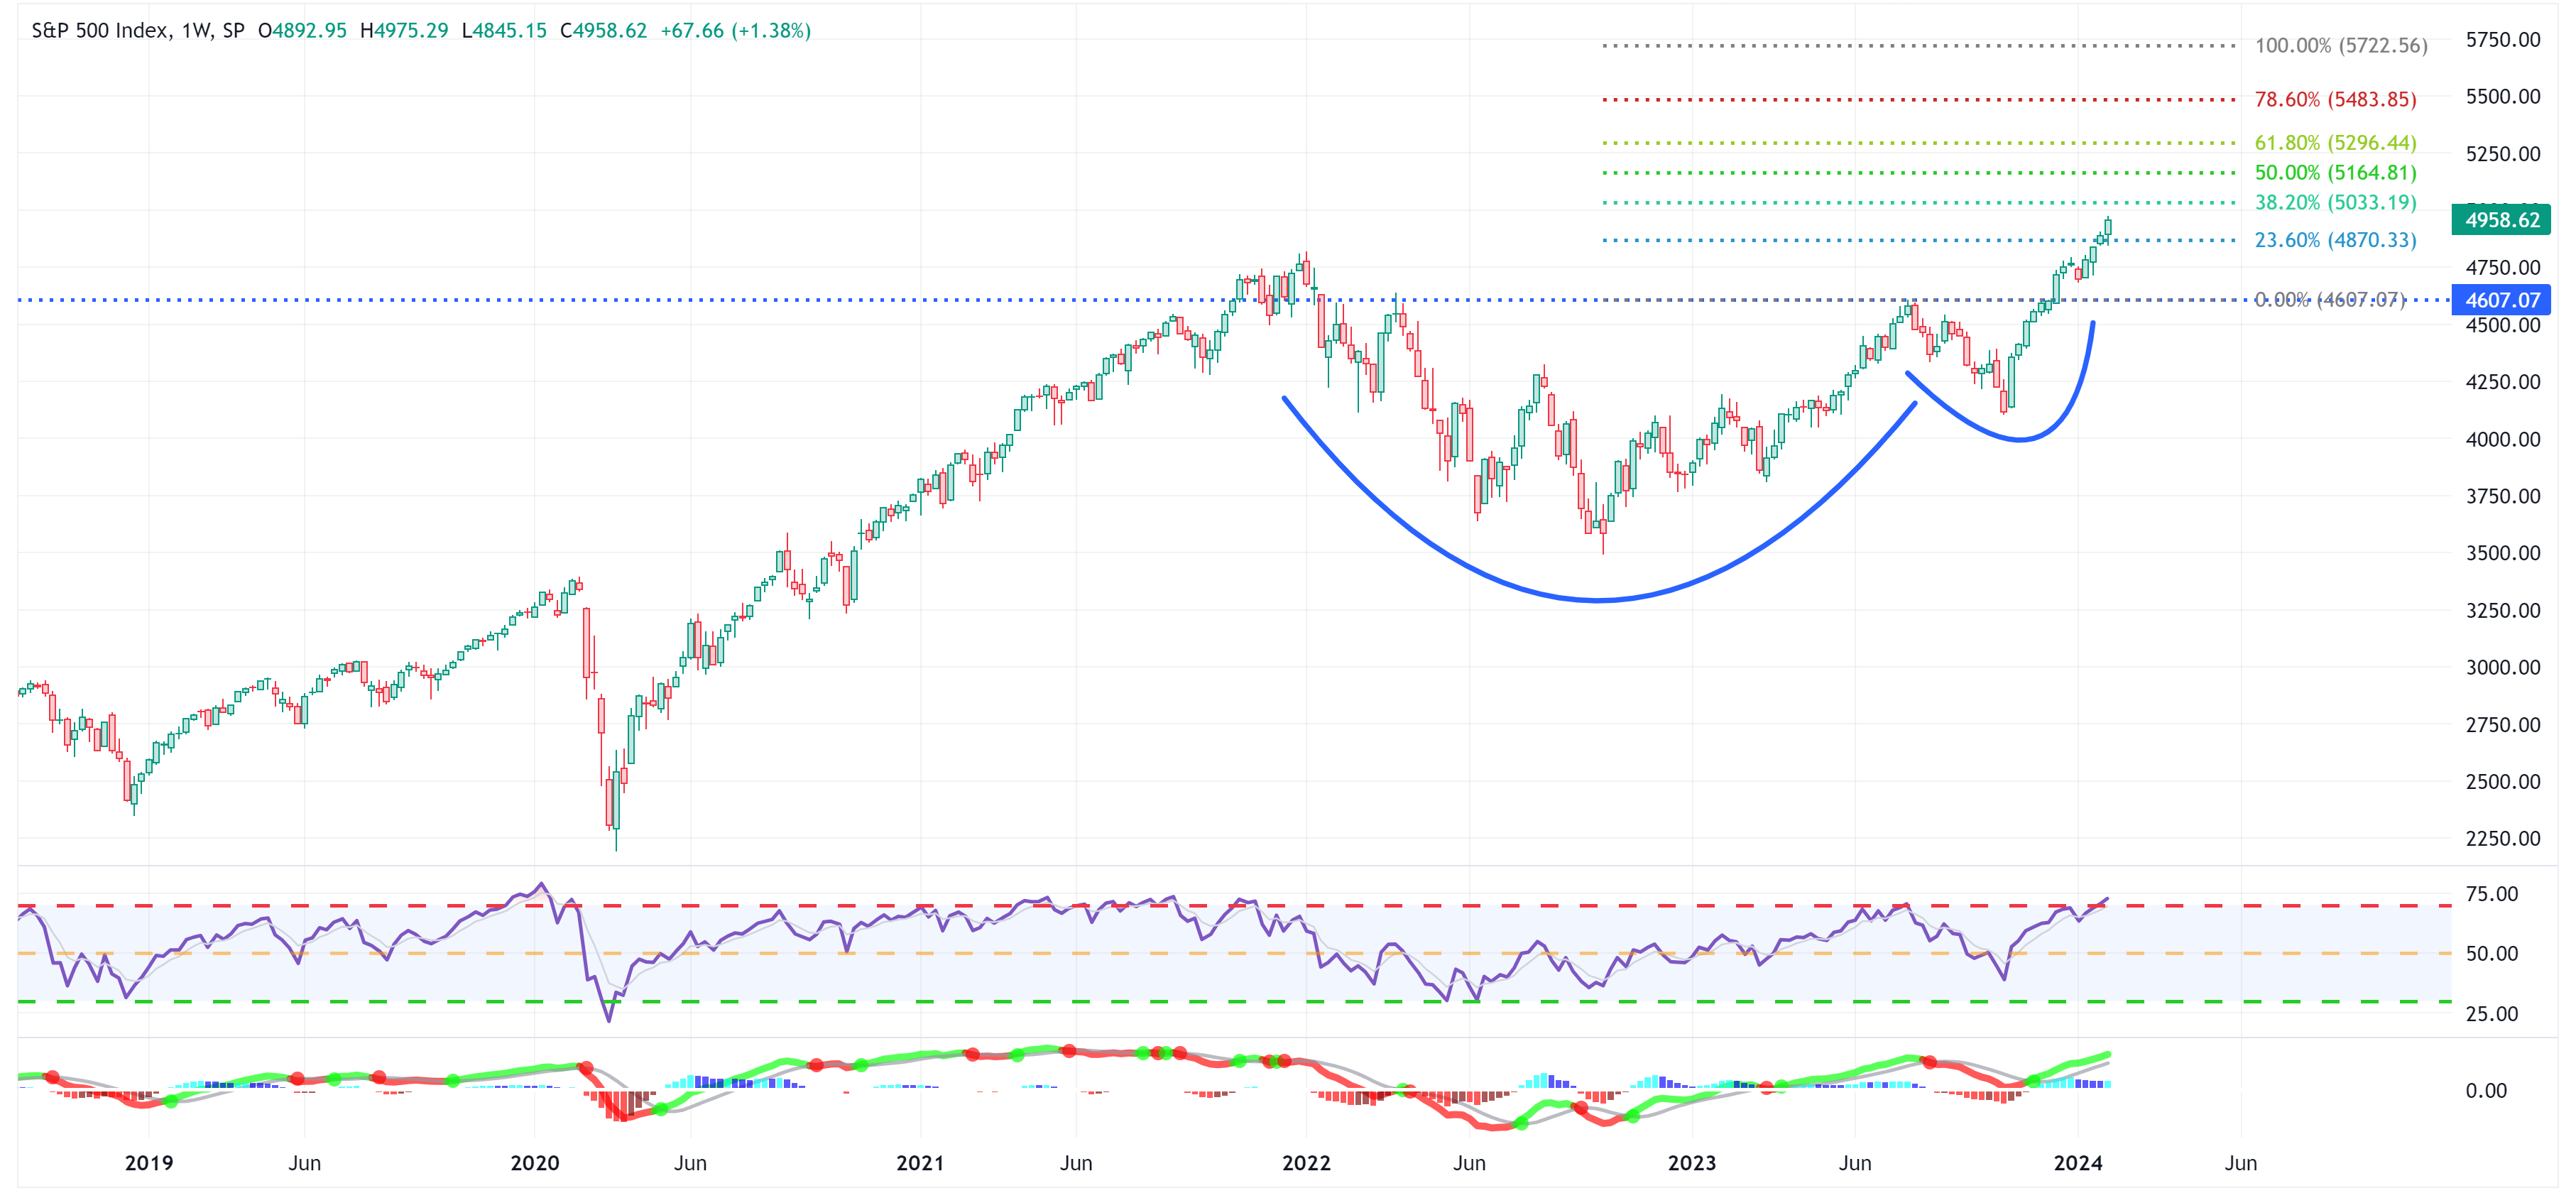
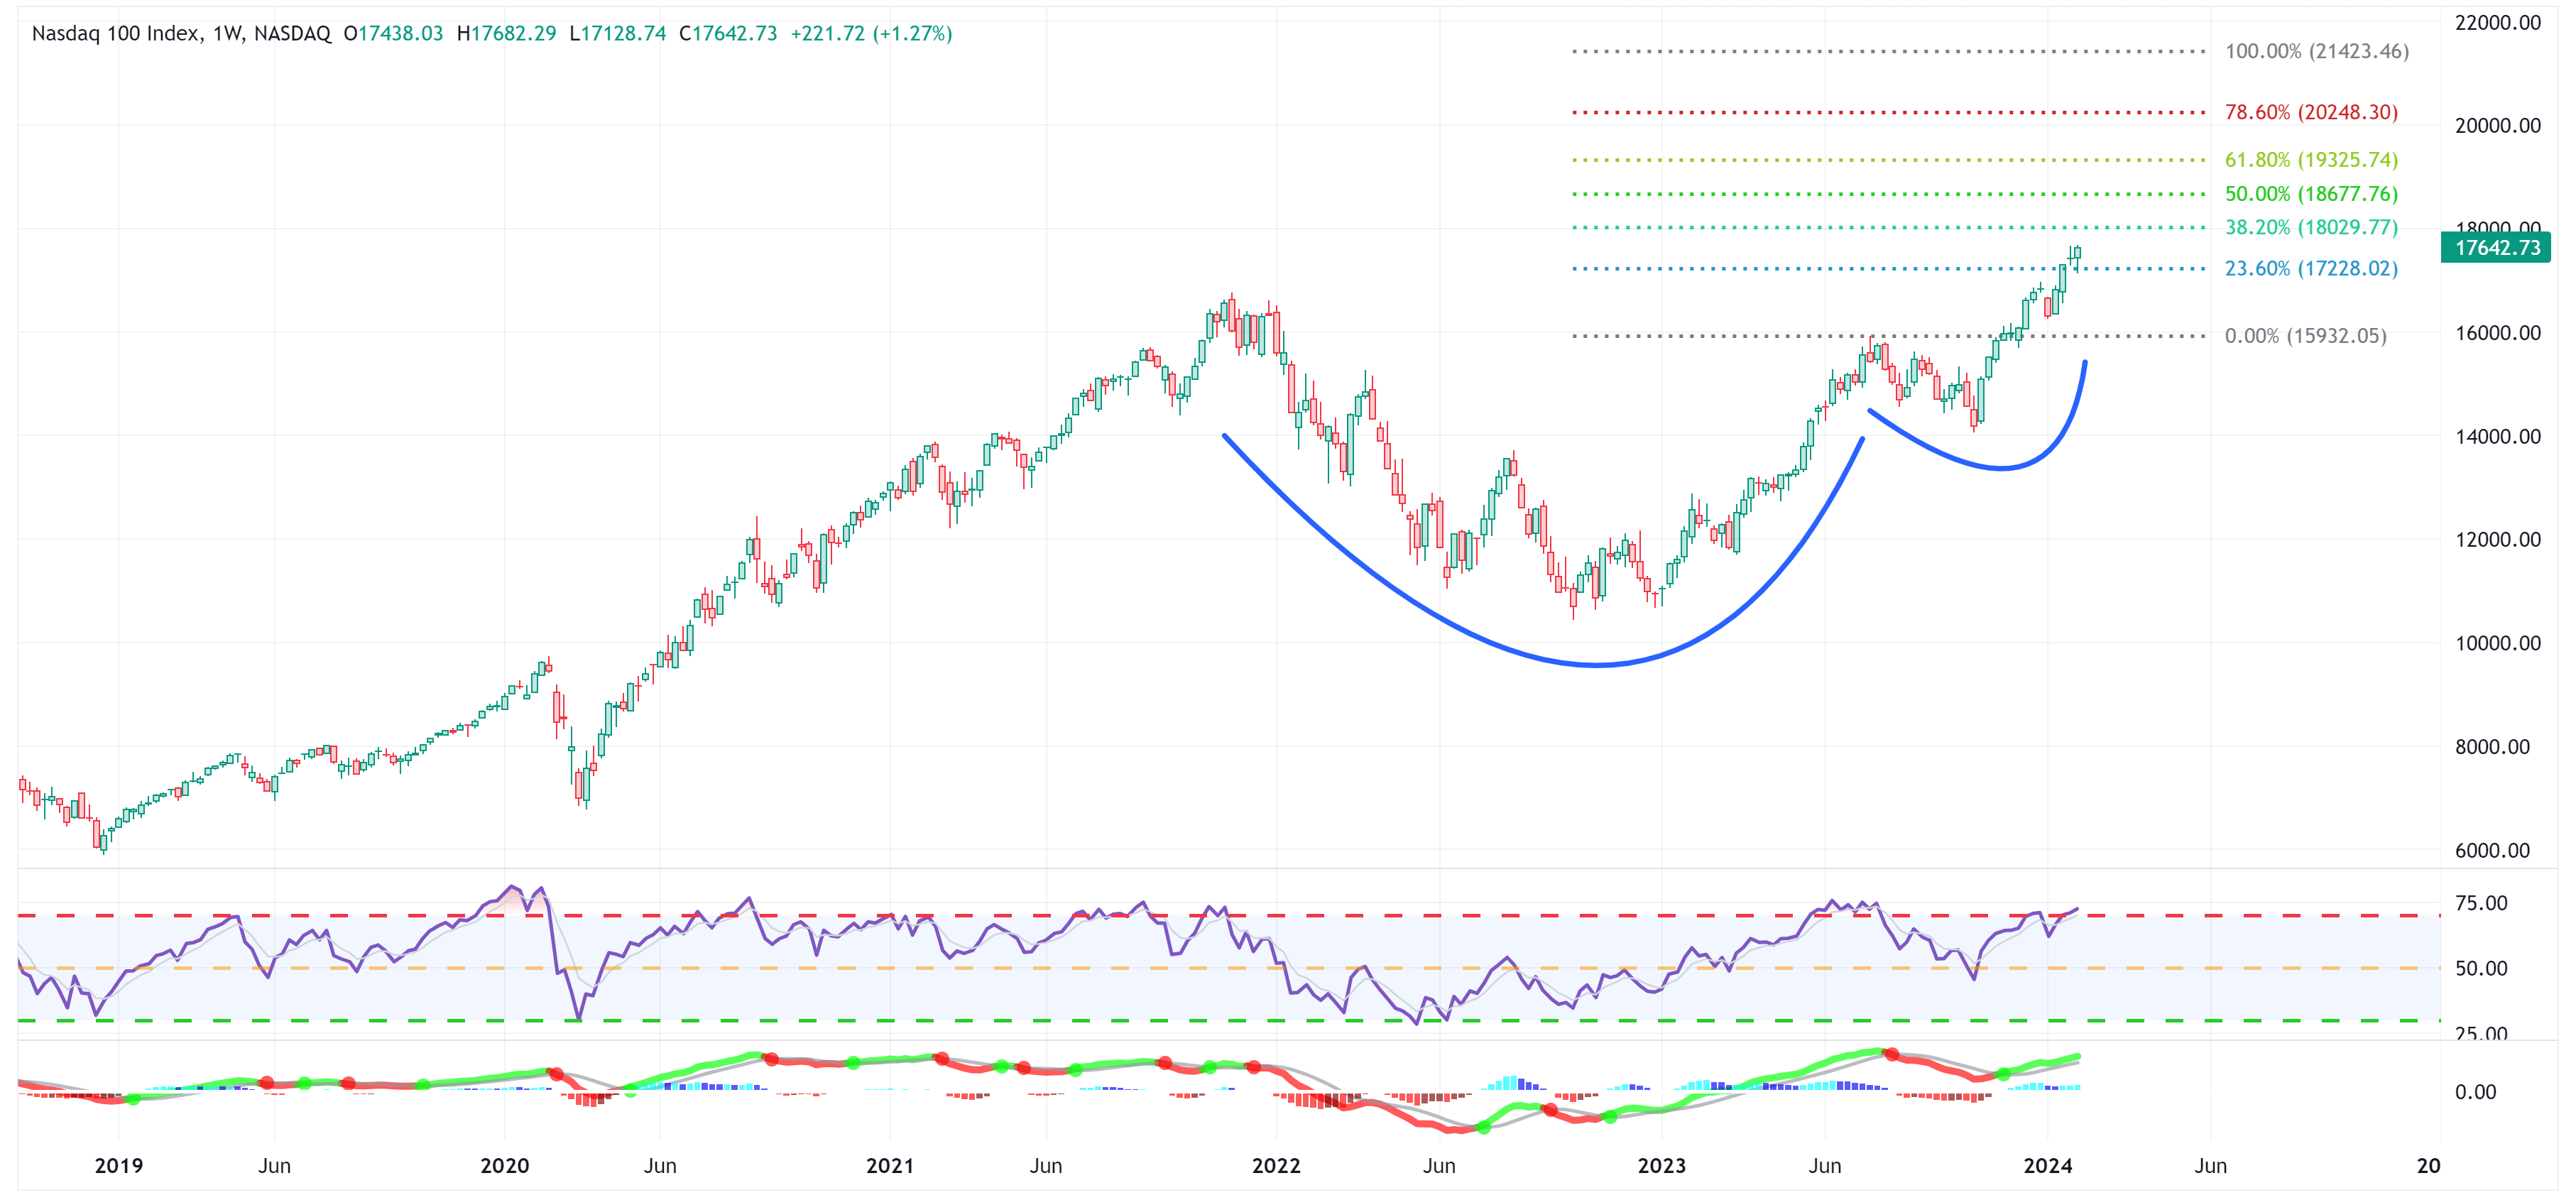
To that end, I have provided the following charts and targets for the S&P 500 and the NASDAQ.
S&P 500 - Target = 5,723
NASDAQ - Target = 21,423
Despite the strong week last week, I think the market could be giving us a signal that it may take a breather in the next week or two.
Let’s dig into a couple of charts to see why I think this could be the case and how far the decline could be.
First, let’s look at the S&P 500 on the daily chart.
Keep reading with a 7-day free trial
Subscribe to Skillman Grove Research to keep reading this post and get 7 days of free access to the full post archives.