Weekly Chart Review
Happy Memorial Day!
In honor of the Memorial Day weekend, this week’s newsletter will be much shorter than usual AND I am offering a MEMORIAL DAY SALE!
Click the button below to get 50% off for your first year! (Note: this offer expires June 1st.)
Regular readers know that I rarely offer discounted subscriptions so if you’ve ever considered joining our newsletter, now is the time to do it!
If you need an extra extra push, here are a handful of comments from our paid subscribers:
"I have enjoyed your weekly commentary and believe it will be of value to my practice."
"I enjoy the thought leadership...with historical data to back it up!"
"I enjoyed the charts and the critical independent thinking."
"I appreciate the level of detail you provide on the charting and would like to see how this could strengthen our investment process."
" Your writing is clear and easy to understand. You unpack your analysis step by step in a way that I can take in...the first time. "
"Really enjoy your weekly chart reviews & hope you will keep them going. Terrificly informative and well-timed! Thanks again"
NVDA
Last week, I saw the following quote via Bloomberg in response to NVDA’s blowout earnings on Wednesday and the subsequent move in its share price the following day (Thursday):
“Today’s (Thursday, May 23rd) a pretty unusual one insofar as the Nasdaq 100 is trading lower even as one of its biggest names is up huge (NVDA). In fact, this is only the seventh time in the past 34 years that we’ve seen a trading day like this, assuming all current prices hold to the close (Note: NVDA finished +9.32% and NDX finished -0.44% on Thursday).
Using data for all current members of the NDX (so there is clearly a possibility that we saw more days like this from names no longer in the index), I filtered out all days since 1990 when one of the top 3 market-cap stocks was up at least 7.5%, but the index itself was down. The list of precedents is a pretty motley one, including some of the darkest periods of the market’s history as well as the very early stages of the dot-com era.”
01/18/1990 - MSFT
01/16/1992 - INTC
11/11/1994 - CSCO
08/18/1995 - CSCO
01/19/2001 - MSFT
11/25/2008 - GOOGL
05/23/2024 - NVDA
If we plot these days on a chart of NDX, we get the following:
All six instances were associated with minor to major drawdowns in the coming weeks/months while three of the six were just in advance of or directly associated with a recession.
Asset Class Review
Each week we take a spin through the major asset classes in an attempt to discern a) what has changed, b) how markets are tilted (i.e., “Bullish” or “Bearish”), and c) where markets may be extended (either positively or negatively) which may provide an opportunity to either enter or exit a position.
We do this by looking at three different time periods: Daily (Short-Term), Weekly (Medium-Term), and Monthly (Long-Term). Additionally, we analyze the applicable Z-Scores to get a sense of overbought or oversold conditions.
NEW: “Trend Composite Score”
Last week, I added a “Composite” score to our Trend calculation. The “Composite” score is calculated as follows:
“Bullish” trend = +1.0
“Bearish” trend = -1.0
Weights are then assigned based on the time period:
Daily (Short-Term) = 25%
Weekly (Medium-Term) = 60%
Monthly (Long-Term) = 15%
This creates 8 possible outcomes:
Weekly Changes
Note that last week’s changes were largely “Bearish” on our Short-Term (i.e., Daily) time frame.
Overall Totals
Despite last week’s “Bearish” turn on the Short-Term time frame, the Medium-Term (“Weekly”) and Long-Term (“Monthly”) time frames still skew largely “Bullish” in aggregate.
US Equities
International Equities
Emerging Market Equities
Fixed Income
Commodities
Currencies
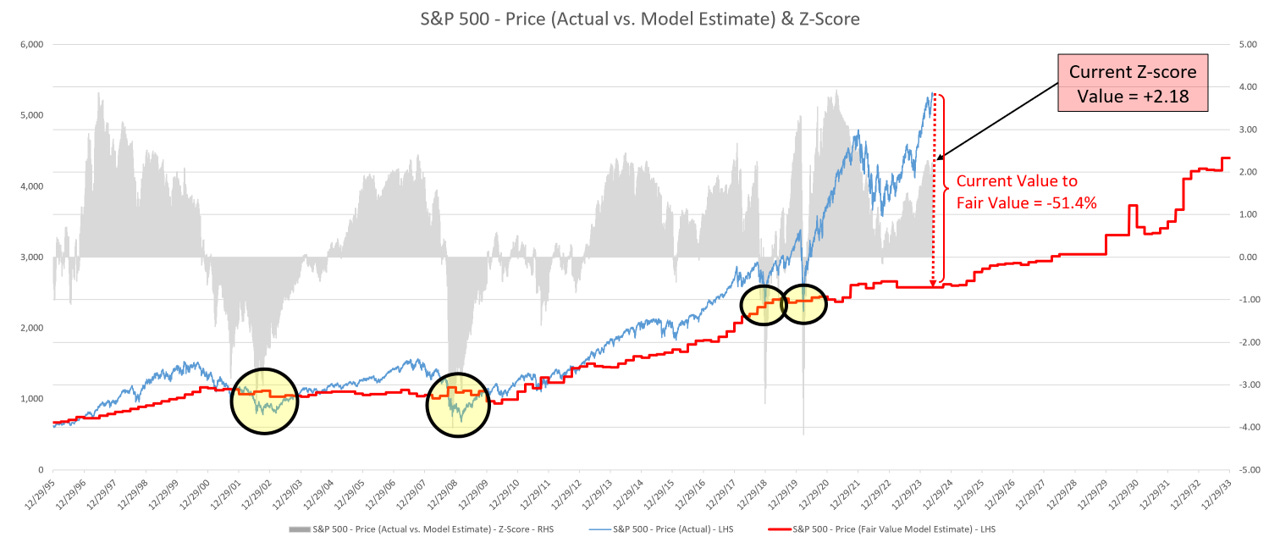
S&P 500 - Fair Value
Let’s close this week with an update on my S&P 500 fair value chart.
The red line in the chart below is the fair value I have constructed for the S&P 500. Based on my model, the current fair value for the S&P 500 is 2,577.23.
Friday’s close on the S&P 500 was 5,304.72.
This means it would take a decline of -51.4% from the S&P 500’s current value to its fair value.
Thank you, as always, for your support of this newsletter!
If you have found it helpful, please feel free to “like” it and share it with a friend or colleague.
Lastly, don’t forget about our Memorial Day Sale, click on the following link to get 50% off for the first year!
Let’s make it a great week!
Take care,
Jim Colquitt


