


Weekly Chart Review
The Bull Case...And Applicable Price Targets...

Last week was a historic week.
Here are just a few of the week’s key moments…
Trump was inaugurated for the second time.
The S&P 500 reached new all-time highs.
Crypto and AI euphoria continued to increase.
Trump called on OPEC+ to lower oil prices and the Fed to lower rates.
Trump suggested that Canada can become the 51st state if it wants to avoid tariffs.
Ironically, or probably not, most of the headlines above are directly (or indirectly) attributed to Trump, his presidency, and his administration’s ability to effect change over the next four years.
Theoretically, Trump does not influence OPEC+ or FOMC decisions, but markets moved at the mere mention by Trump that prices/rates should be lower. I fear that we’re now back to headline-watching more than ever.
So what do we do with all of this?
As I’ve said many times before, you have to ride the train you’re on but make sure not to miss your stop.
This week, we’re going to look at the bull case and assign price targets to the S&P 500 and each of the 11 underlying sectors.
We’ll also weave in a cautionary tale based on valuations and other key metrics.
Let’s dive in.
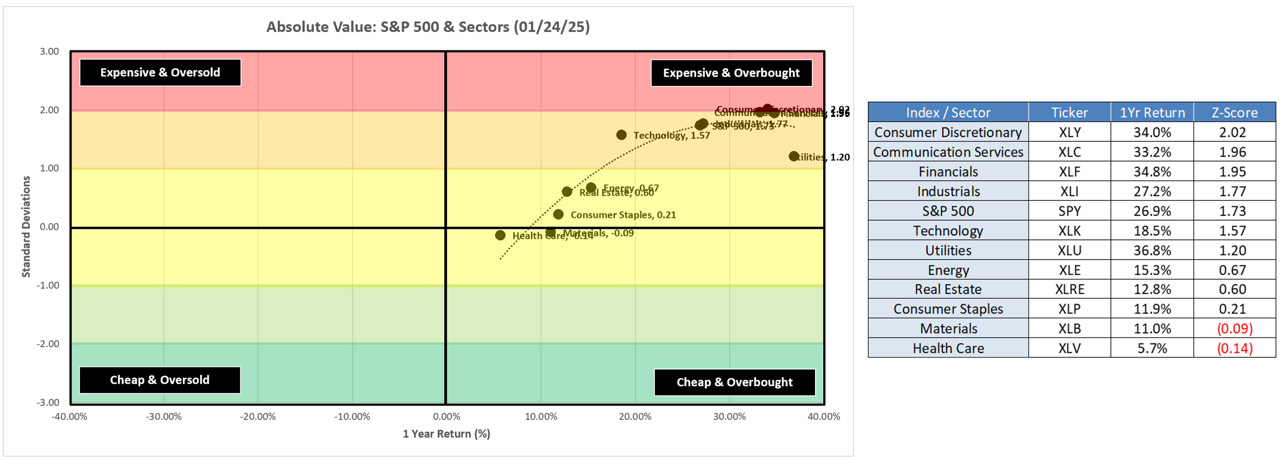
Let’s start by looking at the S&P 500 (SPY) and each of the 11 sectors.
In the image below, I am showing their “absolute” ranking based on returns over the previous 1 year.
The immediate takeaway is that almost every sector (and SPY) are in the top-right quadrant suggesting that they are “Expensive & Overbought”.
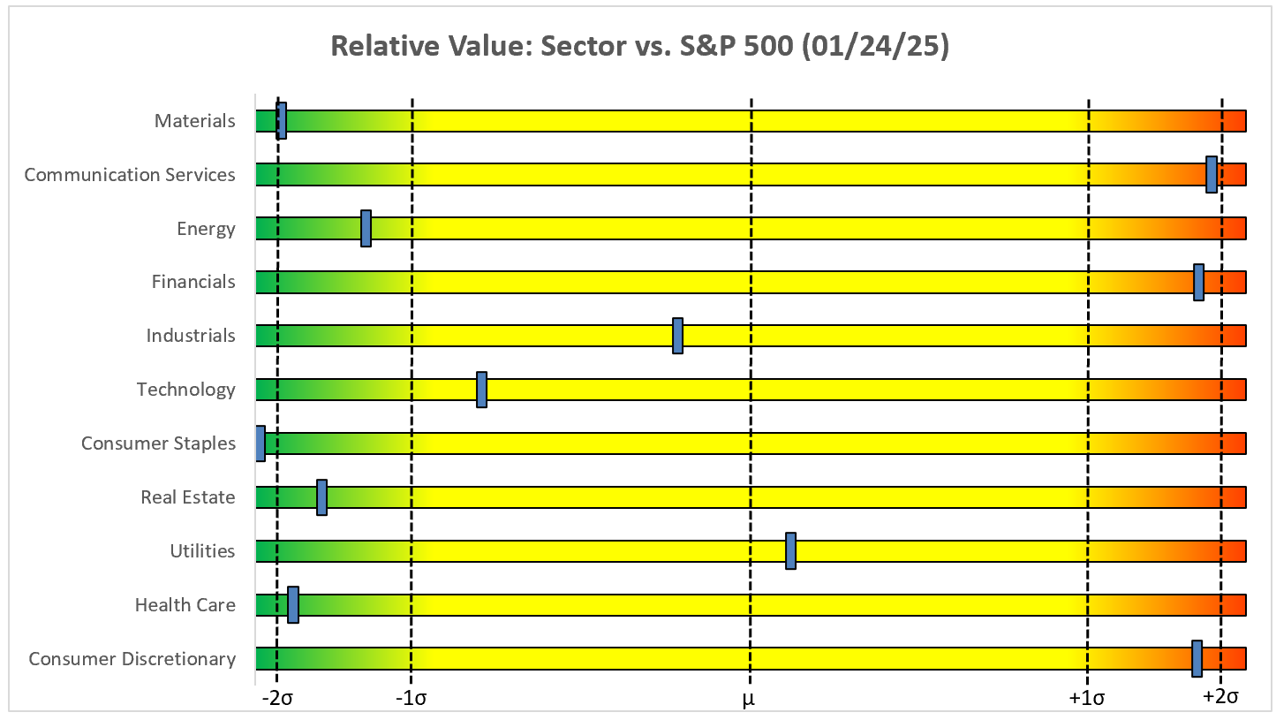
However, when we look at the sectors and how they have performed relative to SPY, we get a slightly different picture.
The image below would suggest that there have definitely been some winners and losers when compared to SPY as there are six sectors in the “Cheap & Oversold” quadrant.

Another way to view this relationship is by using our slider chart.
So, let’s talk price targets.
Keep reading with a 7-day free trial
Subscribe to Skillman Grove Research to keep reading this post and get 7 days of free access to the full post archives.