The Federal Open Market Committee (FOMC) will make its next decision on whether or not to raise rates on December 13, 2023.
There is currently a 97.8% chance that they will leave rates unchanged at the next meeting and maintain the current 5.25% to 5.50% target.
Over the last 30 - 40 years, any time the FOMC paused their rate hiking campaign for 5 months or more, they were done hiking rates.
The FOMC last raised rates on July 26th when they moved rates from the 5.00% to 5.25% target to the current target of 5.25% to 5.50%.
Assuming the FOMC does not hike rates at the December 13th meeting, and makes no intra-meeting hikes before December 26th, history would suggest that the Fed is done hiking rates.
2 Year - US Treasury
The 2 Year US Treasury is your clue.
Note in the chart below that typically when the UST 2Yr (blue line) falls below its 100-day moving average (red line) this signals that the Fed is at or near the end of its hiking cycle.
What comes next?
In the chart below, you can see that in 4 of the last 5 rate hiking campaigns, the pattern was as follows:
Hike —> Pause —> Cut —> Recession.
In the chart below, it is also worth noting that each recession was followed by a lower target rate than the previous recession.
Given that our last recession took rates to the 0% floor, where will the next recession take rates?
It is certainly possible that this rate hiking campaign will not end a recession, but history would suggest that only happens about 20% of the time.
With all of that said, it is not uncommon for the S&P 500 to rally leading up to a recession so it would not be out of place to see the S&P 500 rally further from current levels.
My only word of caution is simply to suggest that we may be at the point of picking up pennies in front of a steamroller.
Absolute Value & Relative Value
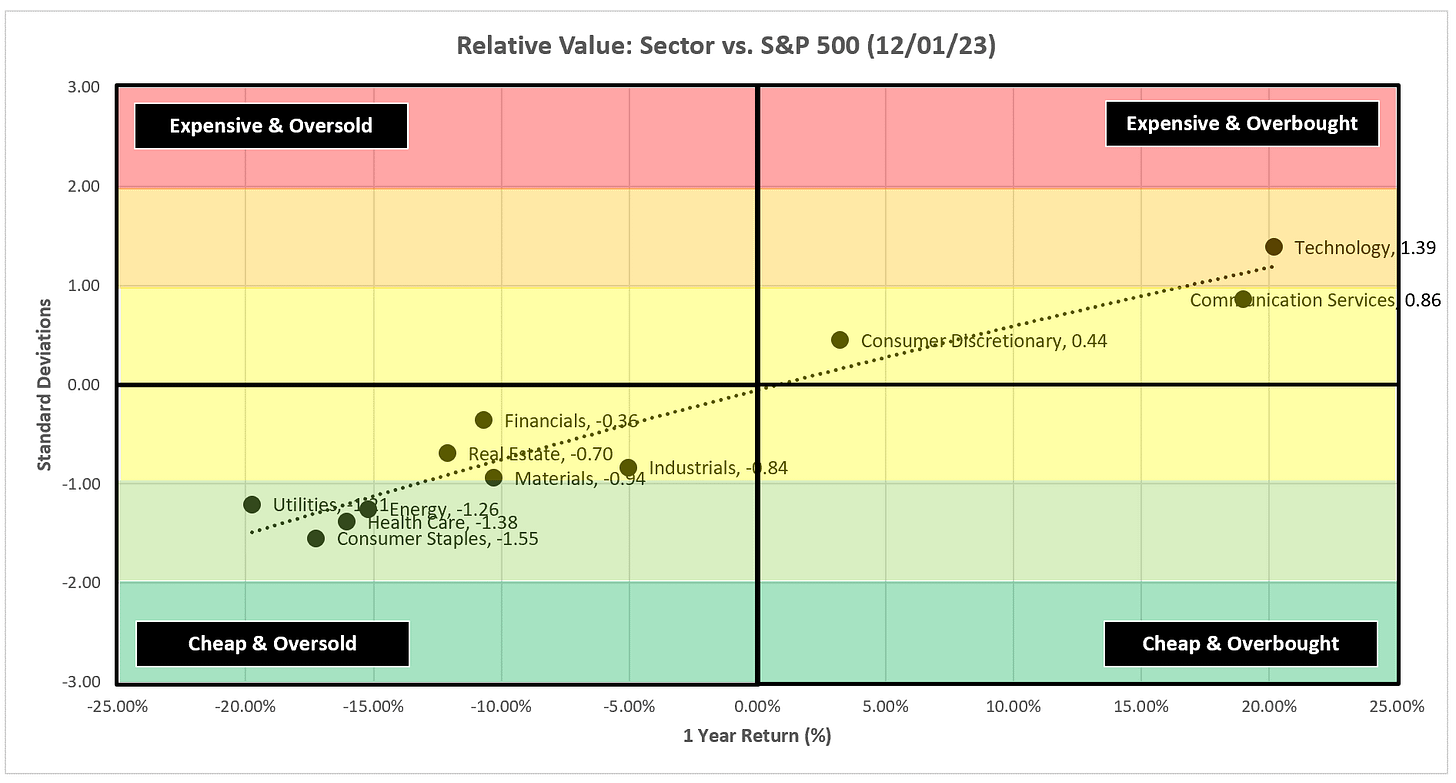
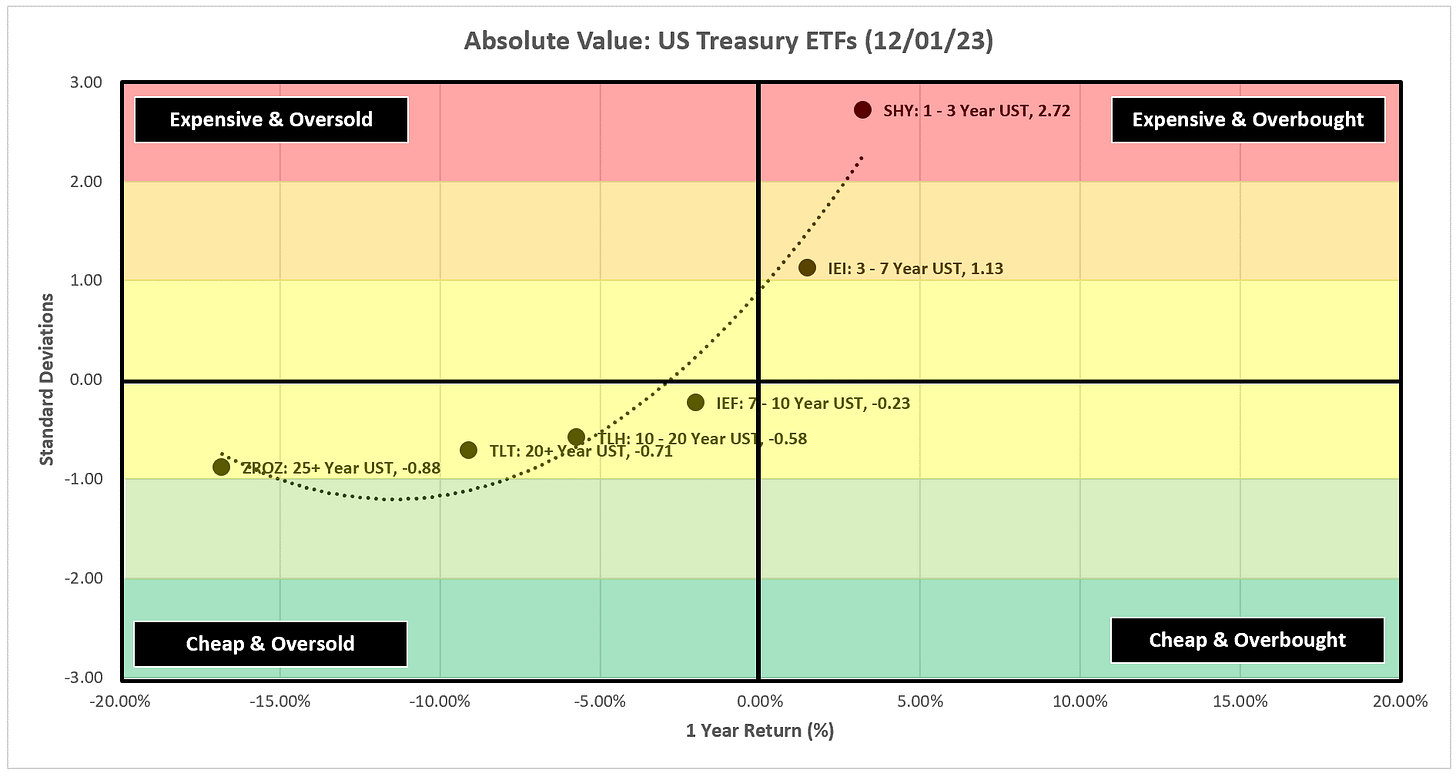
Here are the weekly Absolute & Relative Value charts.
Absolute Value - Equities
Relative Value - Equities
Absolute Value - US Treasuries
Chart Review
The S&P 500 continues its strong run and is just a stone’s throw away from recording a new high for the year!
With that said, the overarching theme for most of the charts below is that:
In many cases, overbought conditions on the RSI panel are now even more overbought than they were last week.
These conditions tend to “resolve” themselves by moving sideways or lower in the subsequent days/weeks.
In several cases, the MACD indicator has generated a “sell” signal.
The MACD indicator I use provides a “red dot” for a sell signal and a “green dot” for a buy signal.
S&P 500 Index
The overhead gap has been filled on the S&P 500 is now closing in on a new high for the year but note the “overbought” conditions on the RSI and that the MACD is losing strength and close to generating a “sell signal”.
Technology
XLC has generated a “sell signal” on the MACD and continues to appear as though it is forming a “rounding top”.
Technology and Communication Services have been the two best-performing sectors all year and if they start to roll over, I think the rest of the market may have trouble as well.
Communication Services
XLC has generated a “sell signal” on the MACD and continues to appear as though it is forming a “rounding top”.
Technology and Communication Services have been the two best-performing sectors all year and if they start to roll over, I think the rest of the market may have trouble as well.
Consumer Discretionary
XLY continues to march higher but note the RSI has almost reached “overbought” conditions and the MACD continues to lose strength.
Industrials
XLI had a tremendous week but watch the RSI. “Overbought” is now “extremely overbought”.
Materials
Similar to XLI, XLB had a tremendous week but again, watch the RSI as “overbought” is now “extremely overbought”.
Energy
XLE remains in no man’s land as it is under the trailing stop loss (which is a net negative) but remains towards the bottom of this channel which suggests it may have room to rise.
Financials
XLF broke through a couple of lines in the sand last week and now is facing a third. This is starting to sound like a broken record but note the RSI.
Real Estate
Strong week for XLRE. I’m calling a short-term target of 38.22 so we’ll have to see where it goes from there. Note the RSI.
Consumer Staples
XLP continues to move higher which is not overly unexpected if you think the economy might be slowing as that’s when people like to flock to the defensives.
Utilities
Similar story for XLU as XLP, we’ve seen a strong move over several weeks which feels like people tilting towards the defensives.
Health Care
Same song for XLV, a move towards the defensives that still have room to move higher.
US Treasury Review
The overarching theme for the US Treasury ETFs this week is that they continue to benefit from the move lower in rates.
Note also that several of these ETFs have perfectly filled the gaps we’ve discussed here for several weeks.
It wouldn’t surprise me to see a bit of a pullback sometime over the next week or two as gaps have been filled and RSI’s are approaching overbought levels; however, I think the bigger move higher is still to come.
ZROZ: 25+ Year UST
TLT: 20+ Year UST
TLH: 10 - 20 Year UST
IEF: 7 - 10 Year UST
IEI: 3 - 7 Year UST
SHY: 1 - 3 Year UST
Average Investor Allocation to Equities - Daily Chart Model
I will conclude this week with a snapshot of the daily version of my “Average Investor Allocation to Equities” model.
How to use this chart.
The blue line is the S&P 500.
The red line is my “fair value” model for the S&P 500.
“Current Value to Fair Value” is the amount the S&P 500 would “need” to decline from its current level to the “fair value” level.
“Current Z-Score Value” is a representation (in standard deviation terms) of the delta between the current price of the S&P 500 and the “fair value” price.
Historically, major corrections do not end until the Z-Score falls to somewhere between -3.0 & -4.0. The yellow circles denote the price of the S&P 500 the last four times this happened. Note where the price was at these points relative to the “fair value” line.
Let’s make it a great week and please feel free to share this piece with a friend or colleague if you found it valuable.


Terrific weekly write-up and chart review, as always. Thanks & have a great week!