Weekly Chart Review
Unemployment Rate & the "Doji" Candle...
On Friday of last week, we had the release of the all-important “jobs number”.
Nonfarm payrolls came in at +275k vs. a median forecast of +198k.
Note that February’s “beat” by +77k was coupled with a revision of -124k for January (original = +353k, revised = +229k).
The Unemployment Rate was also released on Friday and that’s where I would like to spend some time this week.
The Unemployment Rate came in at 3.9% vs. an expectation of 3.7%. On the surface, that doesn’t seem like a huge deviation but I’m more concerned about the trend we’ve seen since last May.
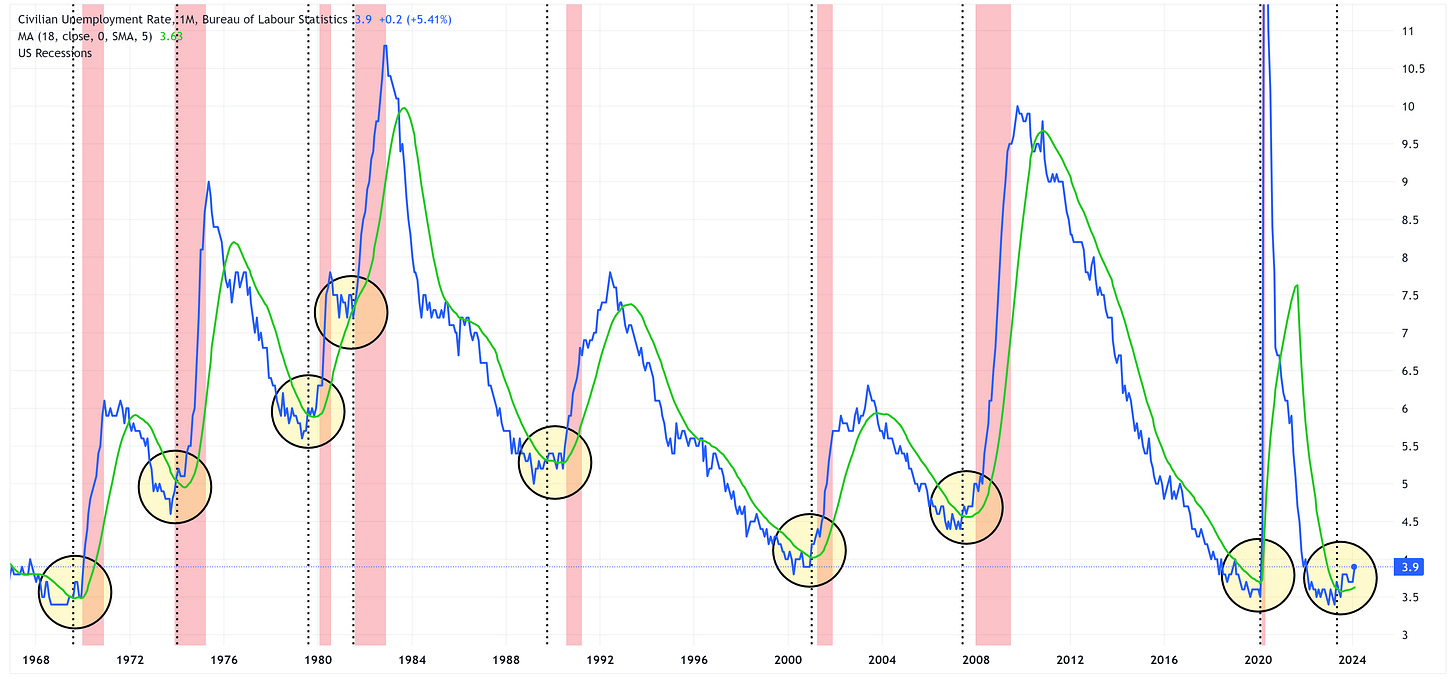
You may recall from a previous newsletter where I noted that when the Unemployment Rate crosses “up and through” its 18-month moving average, that is your “warning signal” that a recession is coming.
You can see this visually in the chart below.
Blue line = Unemployment Rate
Green line = 18-month moving average
Vertical dotted line = “up and through” crossover point
Vertical red shaded bars = recessions
In the current cycle, the Unemployment Rate first crossed “up and through” the 18-month moving average with the May 2023 report.
Fast forward to the most recent report (February 2024), and that makes 9 months since the Unemployment Rate first crossed “up and through” the 18-month moving average.
Why is this significant?
Here is what I noted in a previous newsletter with regard to the duration of the “advanced notice” and when a recession typically begins:
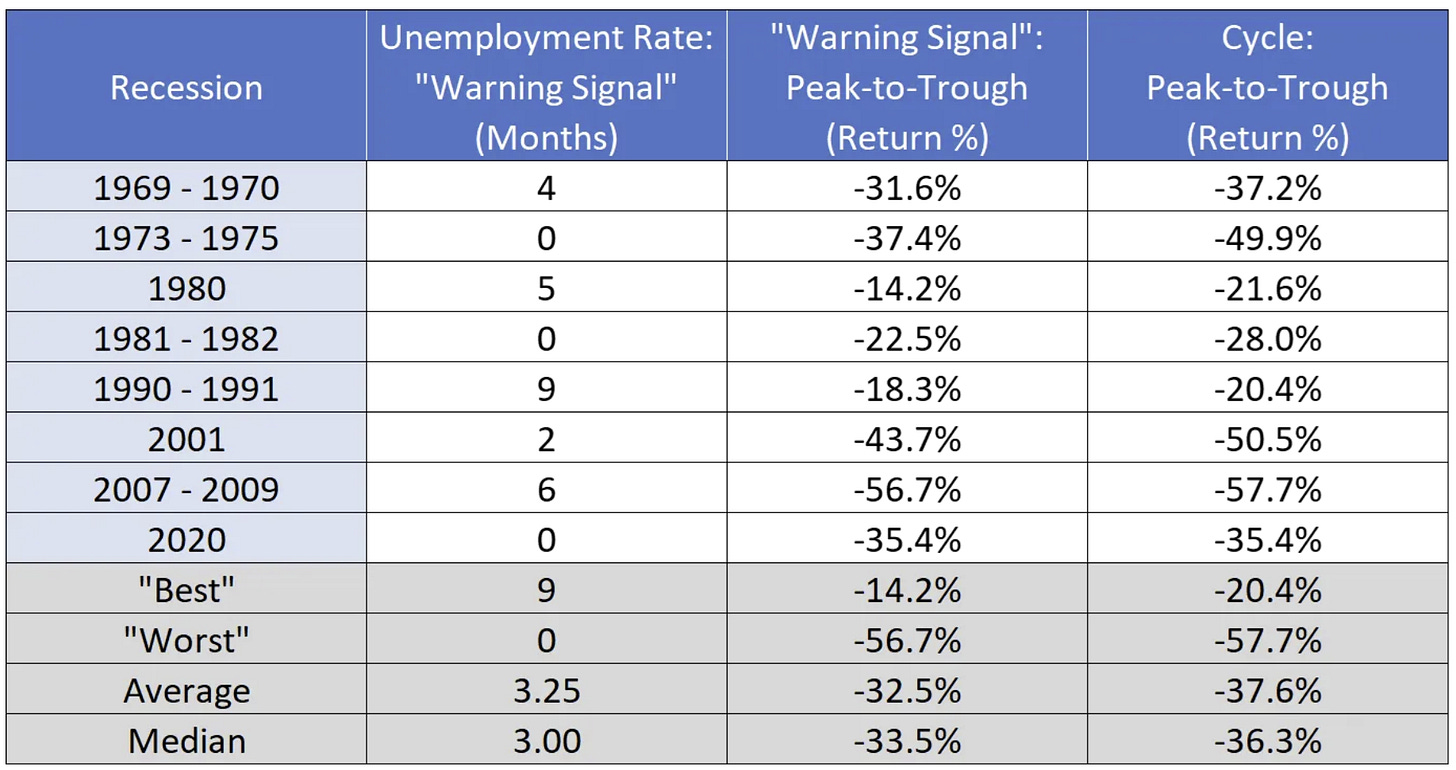
“The range of outcomes over the course of the previous 8 recessions is anywhere from 0 months to 9 months of “advanced notice” with an average of 3.25 months and a median of 3.00 months.”
This would suggest that we have now tied the record for the longest “advanced notice” at 9 months.
Does this mean that a recession is imminent? No, but we’re looking at an indicator that has accurately predicted the previous 8 recessions and it has now tied the record for the longest “advanced notice” that a recession is coming.
Could we see the “advanced notice” reach 10, 12, 15, etc. months before a recession begins, sure, but I think it’s fair to say that we’re getting long in the tooth.
Here is a table that shows the previous “warning signals” and the outcome for the S&P 500.
The median return from cycle peak to cycle trough is a return of -36.3%.
It is worth repeating, that this does not mean that a recession will start tomorrow, it simply means that we continue to see sign after sign that we could be in the latter stages of this recent rally.
Speaking of rallies, let’s check in with our two favorite “cup and handle” charts.
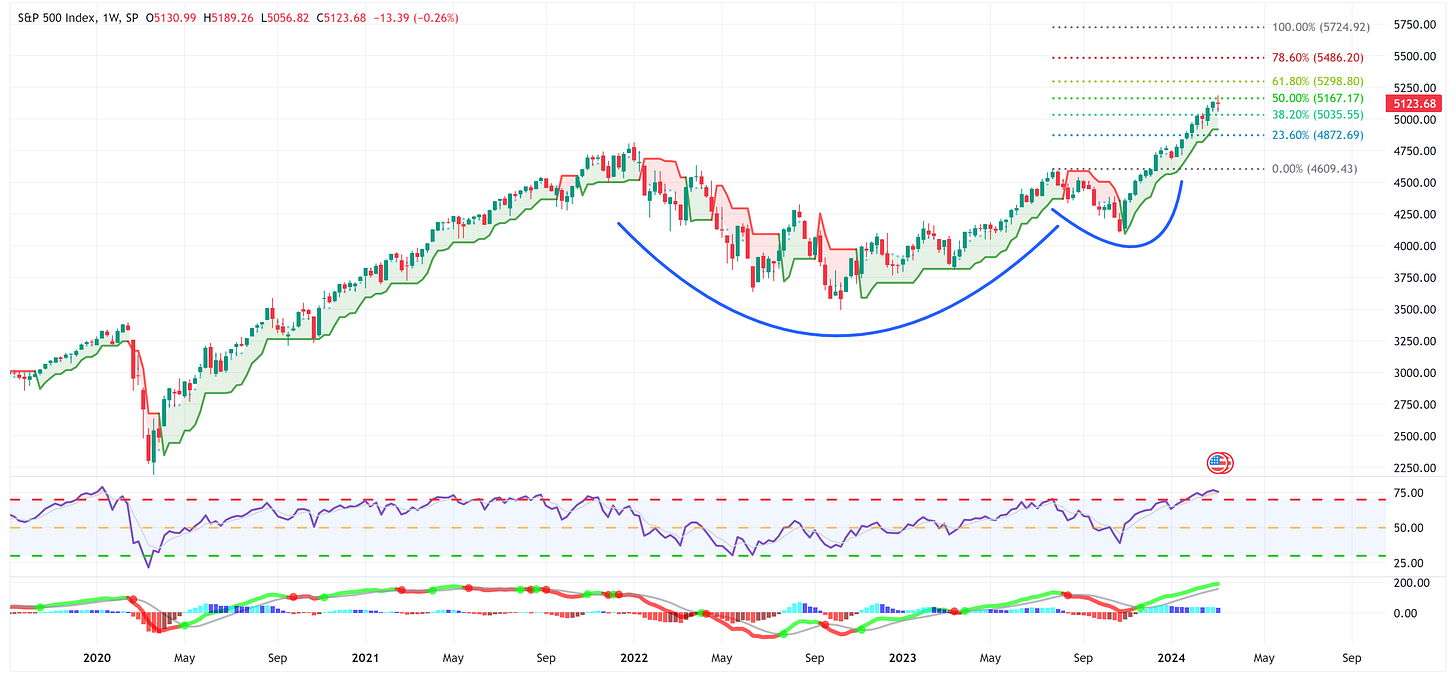
S&P 500
The S&P 500 returned -0.26% last week.
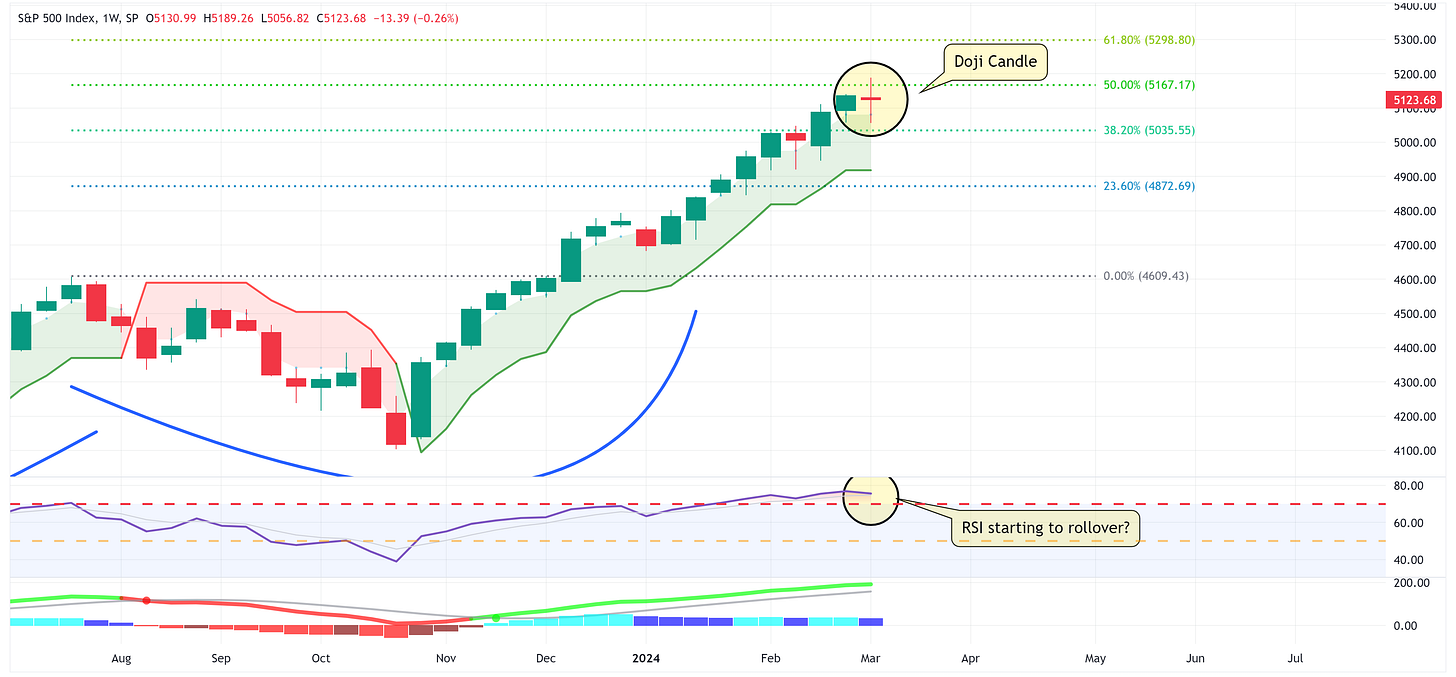
As noted above, the S&P 500 was only modestly lower for the week but I want us to focus on the zoomed-in chart below.
Note in the chart above that last week’s candle was a “Doji” candle.
Investopedia notes the following regarding “Doji” candles:
“Although rare, a doji candlestick generally signals a trend reversal indication for analysts, although it can also signal indecision about future prices.”
So at best, this candle suggests “indecision” and at worst, it signals a “trend reversal”.
I would also draw your attention to the RSI panel below the chart. While it hasn’t “rolled over” yet, it does appear to have peaked and is beginning to head lower. This could suggest that some amount of steam is starting to come out of the recent rally.
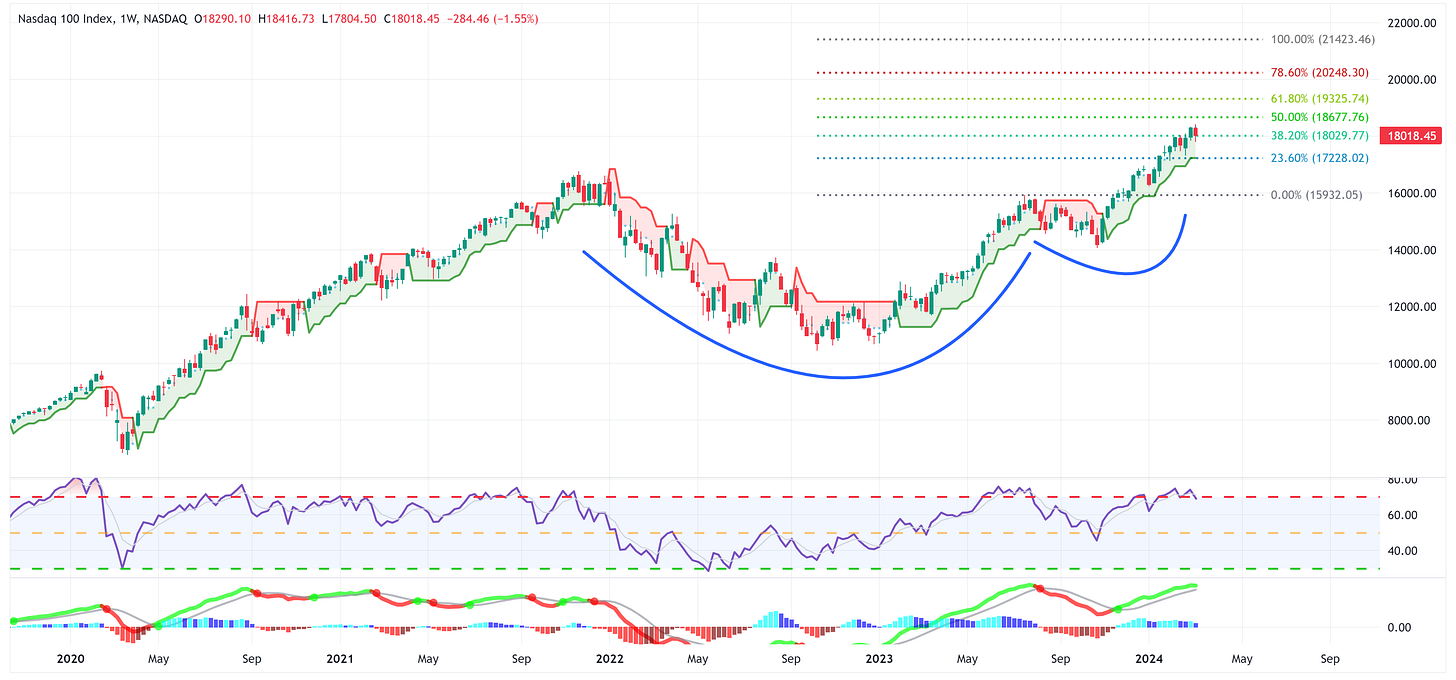
NASDAQ
Compared to the S&P 500, the NASDAQ had a worse week (lower by -1.55% vs. the S&P 500 which was lower by -0.26%) but it did hold the 38.2% Fibonacci line.
However, note that the RSI has now fallen below the “overbought” level of 70. This can be associated with a market that has reached a temporary high. For reference, look at a similar period which began in July 2023 and led to a -10% decline.
Rates
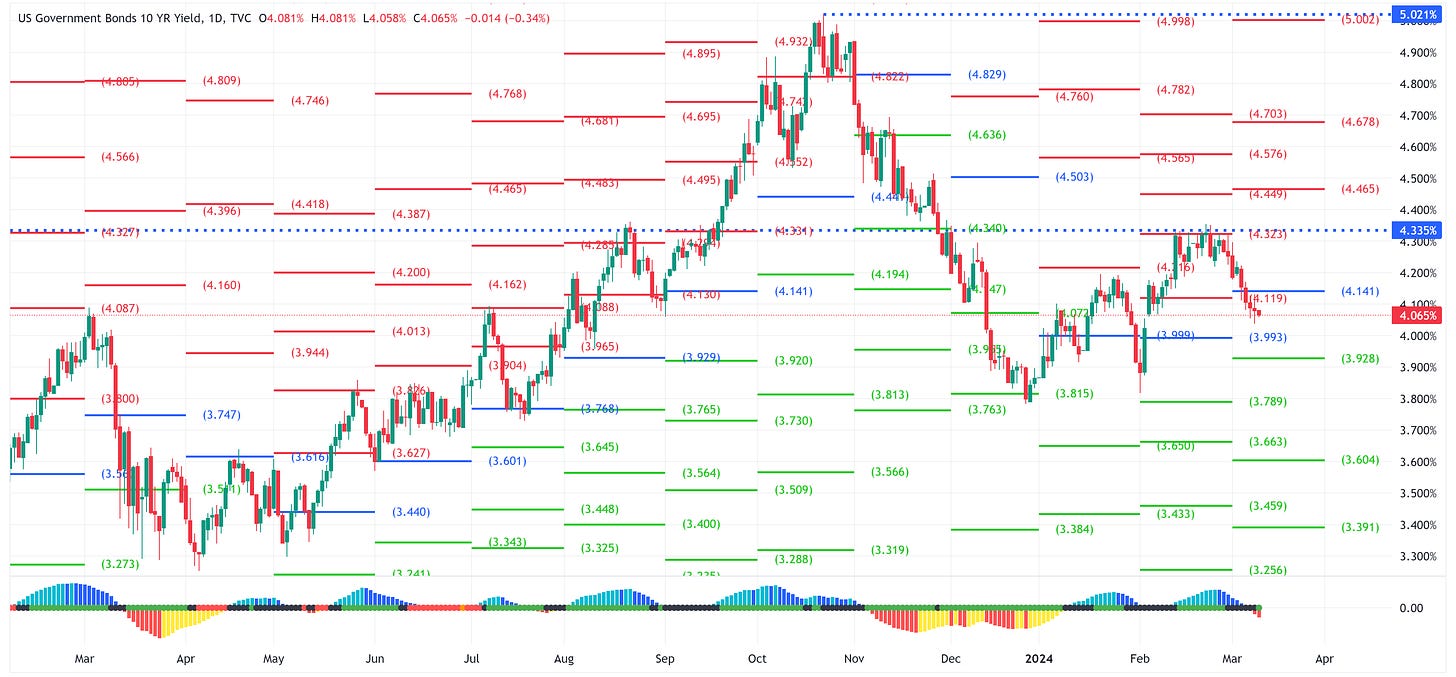
Last week, I noted the following regarding the UST 10-year:
“We had a strong rally in the UST 10-year to close out last week. The monthly pivot for the UST 10-year is 4.141% so it’s not inconceivable to see the 10-year move down to that level.”
Further, I noted:
“The first level of support below 4.141% is 3.928%”
This remains the key support level for now.
Asset Class Review
Let’s turn now to our asset class review.
Keep reading with a 7-day free trial
Subscribe to Skillman Grove Research to keep reading this post and get 7 days of free access to the full post archives.


