Weekly Chart Review
Negative tone to end last week but positive "overhead price gaps" abound that may initiate a rally this week...
Last week, the FOMC concluded its two-day meeting on Wednesday by announcing that they were leaving rates unchanged at 5.25% - 5.50%. This was largely expected as Fed Funds futures assigned a 98% - 99% probability of “no change” in the days leading up to the meeting.
However, what the market was not expecting was that the Fed came out and said:
They anticipate raising rates one more time in 2023.
They anticipate leaving rates higher for longer than initially planned.
Net/net, a much more hawkish outcome than anticipated by most.
I made the following comment last week with respect to the outcome of the FOMC meeting:
“If the Fed leans dovish, the market will rally; if the Fed leans hawkish, the market will slide lower.”
The S&P 500 was lower by -0.14% through Tuesday and ended the week lower by -2.93% which was weighted heavily towards the period directly following the conclusion of the FOMC meeting and the remainder of the week.
FOMC Credibility
Despite the fact that the FOMC has suggested that they plan to raise rates again in 2023 (which would mean in November or December), I’m not convinced the market believes them.
The tables below show the probability of the FOMC rate hikes at each meeting. The table on the left was from a week ago (i.e., before the FOMC meeting) and the table on the right is the current probabilities.
Note that the “current” chart still shows no rate hikes and that the probabilities have hardly changed despite the FOMC’s “one more hike” and “higher for longer” rhetoric.
It’s not until the September 2024 meeting that you have a different expected outcome from last week to this week’s probabilities, and I can assure you a lot will change from now until then so those probabilities are virtually useless.
The key question then becomes: “Why does the market not believe the Fed…or at least not yet?”
It’s probably too simplistic to break this down into a binary decision, but all else being equal, if I thought the economy was strong/expanding and could sustain another rate hike, I think I would start pricing it in.
Alternatively, if I thought the economy was weaker than expected and couldn’t sustain another rate hike, I probably wouldn’t start pricing it in regardless of what the FOMC was saying.
Again, a very simplistic approach but as Albert Einstein once said: “Everything should be made as simple as possible, but not simpler.”
If the Fed is bent on raising rates again this year, they have some work to do to convince the market. To that end, watch for the usual cadre of Fed speakers and the Wall Street Journal’s correspondent, Nick Timiroas, to support this narrative in the coming weeks if the Fed feels they are getting behind on convincing the market that they are going to hike again in 2023.
Absolute Value & Relative Value
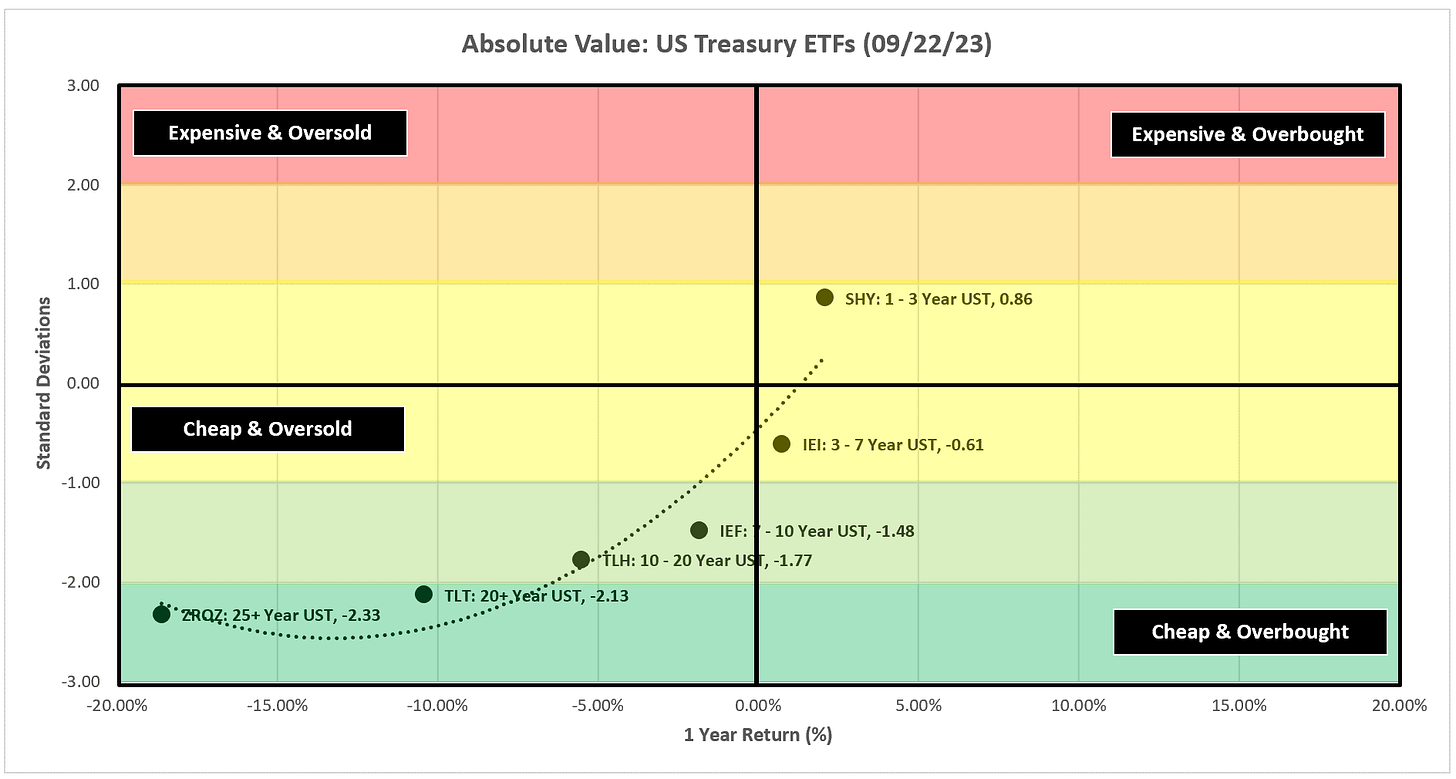
Here are the usual absolute and relative value charts. Recall, that I have added “absolute value” charts for different duration US Treasury ETFs as I continue to believe there will be a rotation out of equities and into US Treasuries when the market goes “risk off” at some point in the not-too-distant future.
Absolute Value - Equities
I know I sound like a broken record, but the vast majority of sectors and the S&P 500 continue to live in the upper-right “Expensive & Overbought” quadrant on an absolute basis.
Relative Value - Equities
As has been the case for the vast majority of the year, Communication Services and Technology remain in the “Expensive & Overbought” quadrant, but this could change if the current market weakness continues.
Absolute Value - US Treasuries
The longer-duration products like ZROZ and TLT had a tough second half of the week last week which puts them even further into the “Cheap & Oversold” quadrant.
Sector & US Treasury Review
Last week saw a sharp move lower on Thursday and Friday for most sectors and the S&P 500 Index. Interestingly, this sharp move lower created some “overhead gaps” that need to be filled.
These gaps were generated on the daily chart whereas I typically look at the weekly charts in the analysis below. With that said, I’ll call them out where applicable.
Coming into this week, I think the market will try to stage a rally at some point to fill these gaps. The big question will be whether or not the market can hold onto that rally and keep moving higher or if we get a continued move lower this week once we fill the gaps.
S&P 500 Index
The chart above is the daily chart for the S&P 500 Index. Note the yellow box. This is the gap that I believe has a chance of getting filled this week. The top end of the gap is 4,401.38.
We also have a H&S pattern to contend with. The H&S target for the S&P 500 is 4,065.
Below is the typical weekly chart for the S&P 500. In both cases (daily and weekly), the S&P 500 is below the trailing stop loss; therefore, you should be biased towards the short side until proven otherwise.
Technology
Technology continues to look weak but similar to the S&P 500, XLK has a gap that needs to be filled which would need to see a price of 166.53 to close the gap.
Beyond that, note that XLK is in no man’s land as it has lost the support of the moving averages and likely will not see support until 23.6% Fib at 161.04.
Communication Services
XLC continues to hang in there but had a tough week last week breaking the blue trend line.
Similar to the items above, XLC has a price gap that needs to be filled at 66.52.
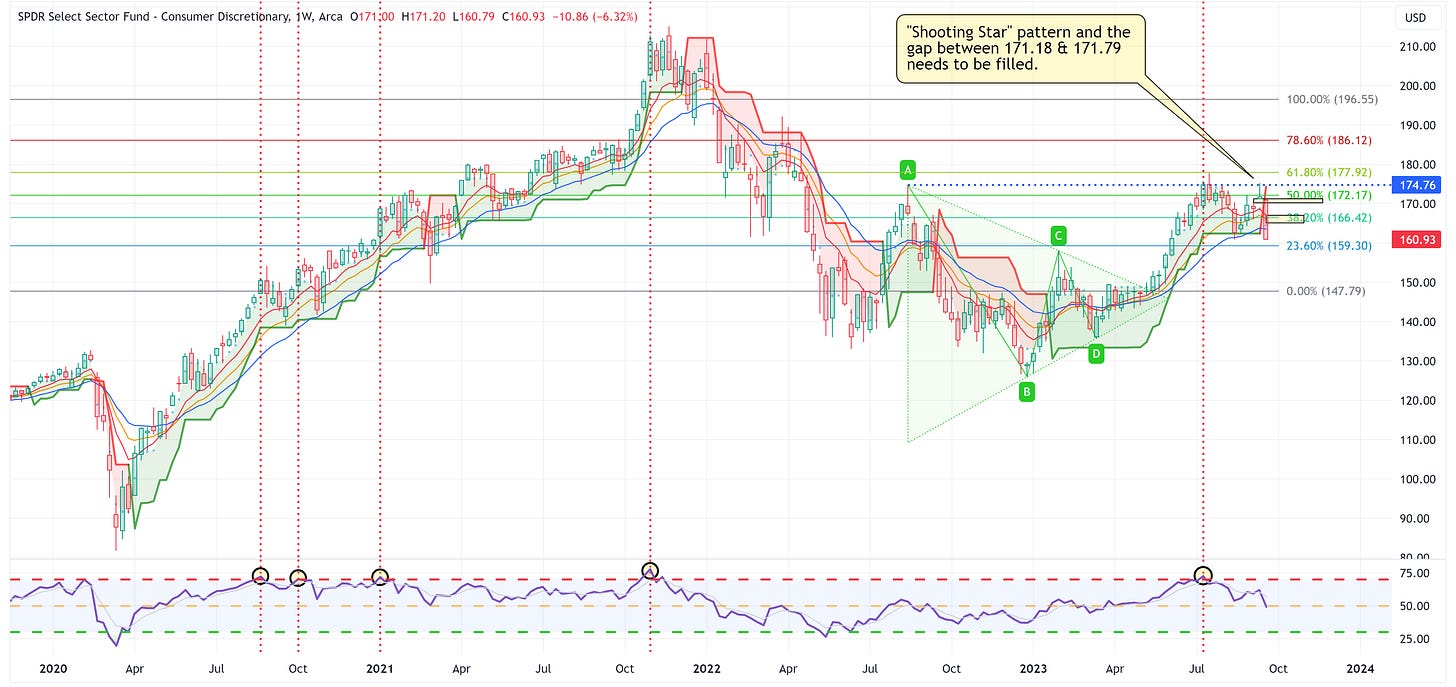
Consumer Discretionary
Last week, I called out the gap that XLY needed to fill, and candidly, I had no idea it would fill it so dramatically. With that said, it created another “overhead gap” at 167.08 that needs to be filled so maybe we see a snapback rally to start the week.
Industrials
A rounding top and H&S pattern that has a target of 99.61; however, there is a gap that needs to be filled at 103.78 which could delay the target the move lower.
Materials
Similar to XLI, XLB has a H&S pattern that is calling for a target of 74.42 but has a price gap that needs to be filled at 80.01.
Energy
Energy was down on the week but note that a) it did not have a violent move lower creating a price gap, b) it found support at the 8 EMA, and c) remains above the trailing stop loss. Net/net, on a bad week, it had a pretty solid outcome which suggests the 111.94 remains in play.
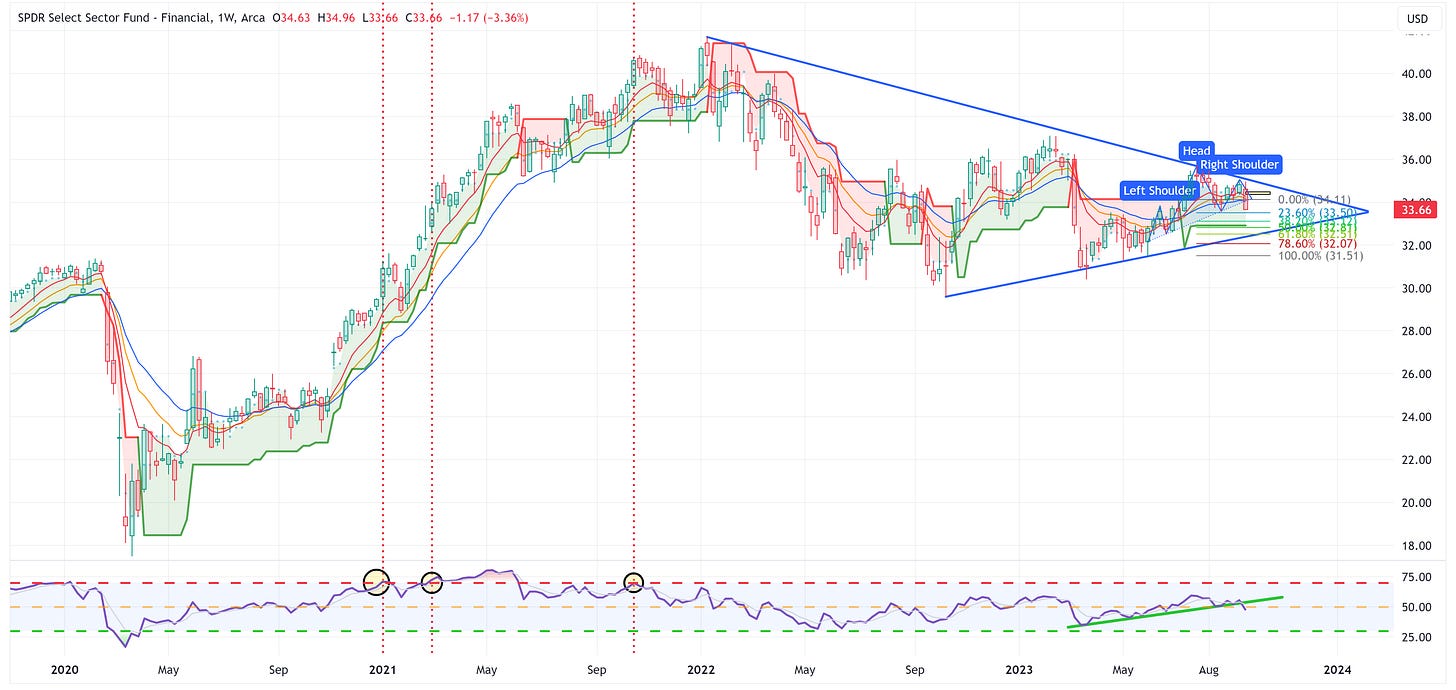
Financials
XLF has created a H&S pattern with a target of 31.51 but similar to others, has a price gap that needs to be filled at 34.48.
Real Estate
After an eternity of indecision, XLRE has decided to break the symmetrical triangle to the downside. It has also created a H&S pattern that calls for a target of 31.89. Note: similar to others, it also has a price gap at 36.03 that needs to be filled.
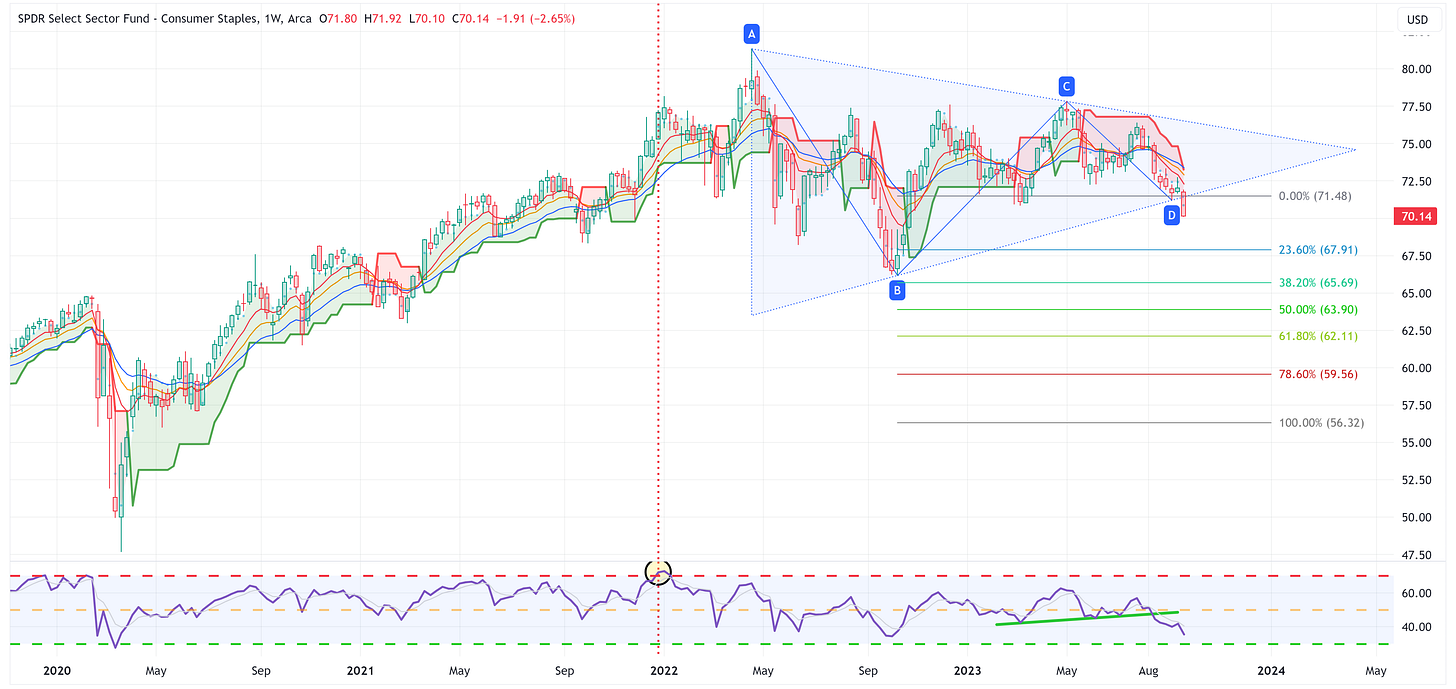
Consumer Staples
Similar to XLRE, it appears XLP has chosen to break to the downside thus creating a target of 56.32. I’m skeptical that XLP will fall that far but it could possibly go to the 50.0% Fib at 63.90.
Utilities
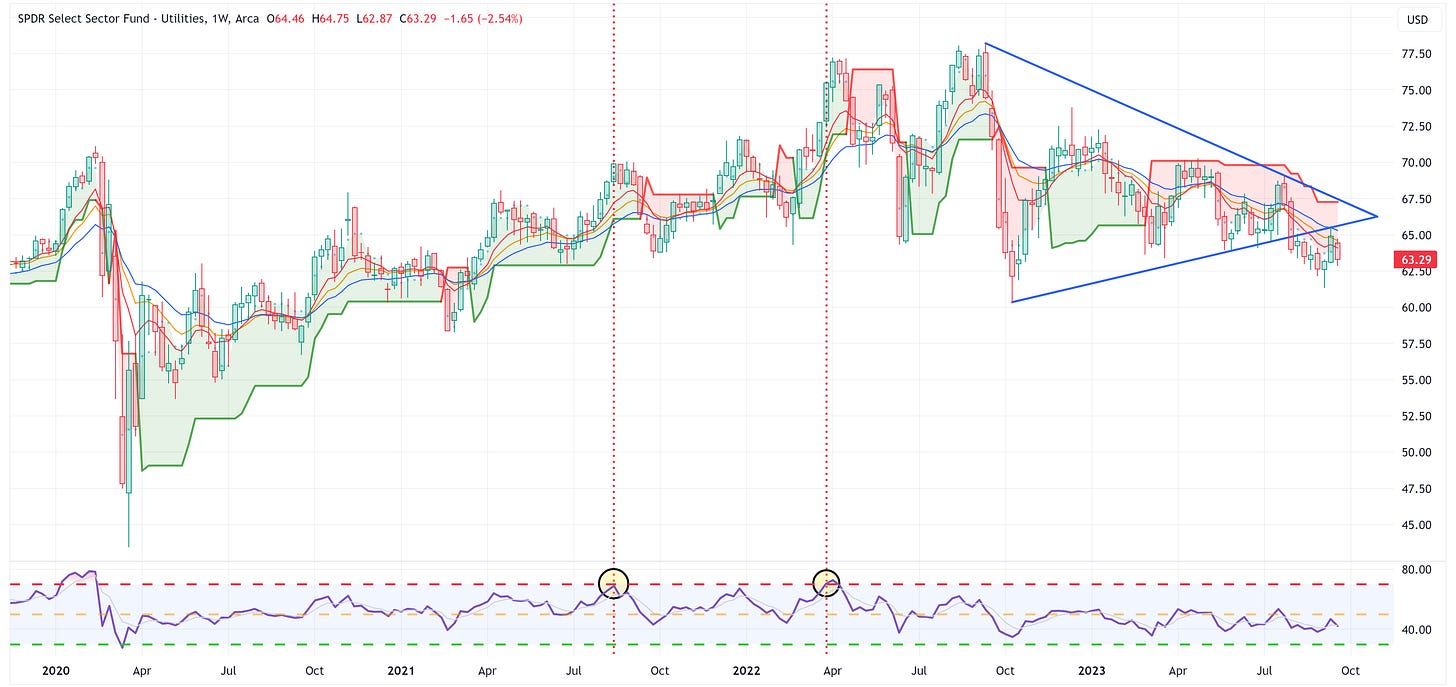
I continue to have no really good answer for the XLU chart. The one thing I can say with certainty is that it is below the trailing stop loss and that is a net negative.
Health Care
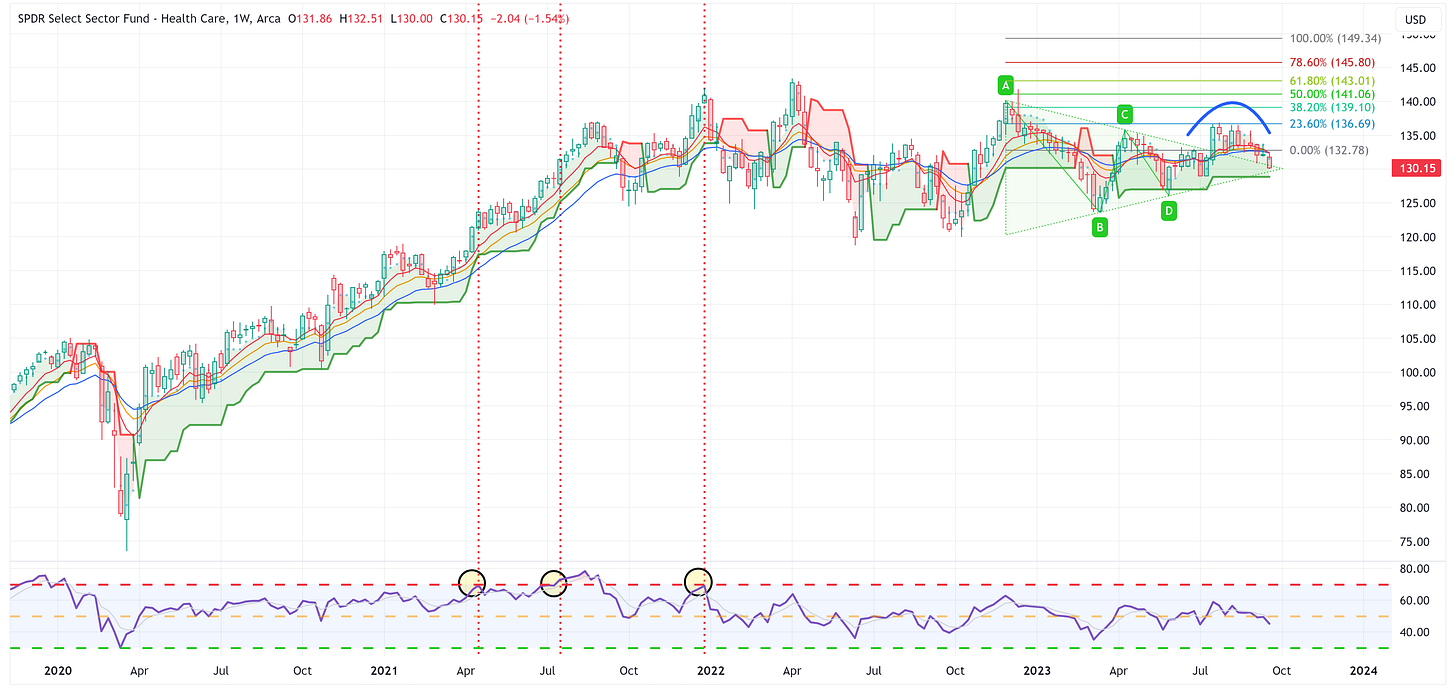
XLV looks like it is trying to create a rounding top but it remains above the trailing stop loss. Hopefully, it can find support off the top side of the symmetrical triangle.
ZROZ: 25+ Year UST
With the move higher in longer-duration US Treasury yields this week, some of the longer-duration US Treasury ETFs had a tough couple of days.
With that said, note that a) the move lower created a price gap that needs to be filled (at 78.64), and b) the RSI is suggesting that ZROZ is moving into “oversold” territory.
I continue to believe these longer-duration ETFs (i.e., ZROZ, TLT, etc.) are going to be huge winners but if you get involved now, you may have to stomach a rough patch or two. With that said, the alternative is you get in too late (or not at all) and miss out on the trade entirely.
TLT: 20+ Year UST
Same song for TLT, but the gap level that needs to be filled is 93.04.
TLH: 10 - 20 Year UST
Same song for TLH, but the gap level that needs to be filled is 102.34.
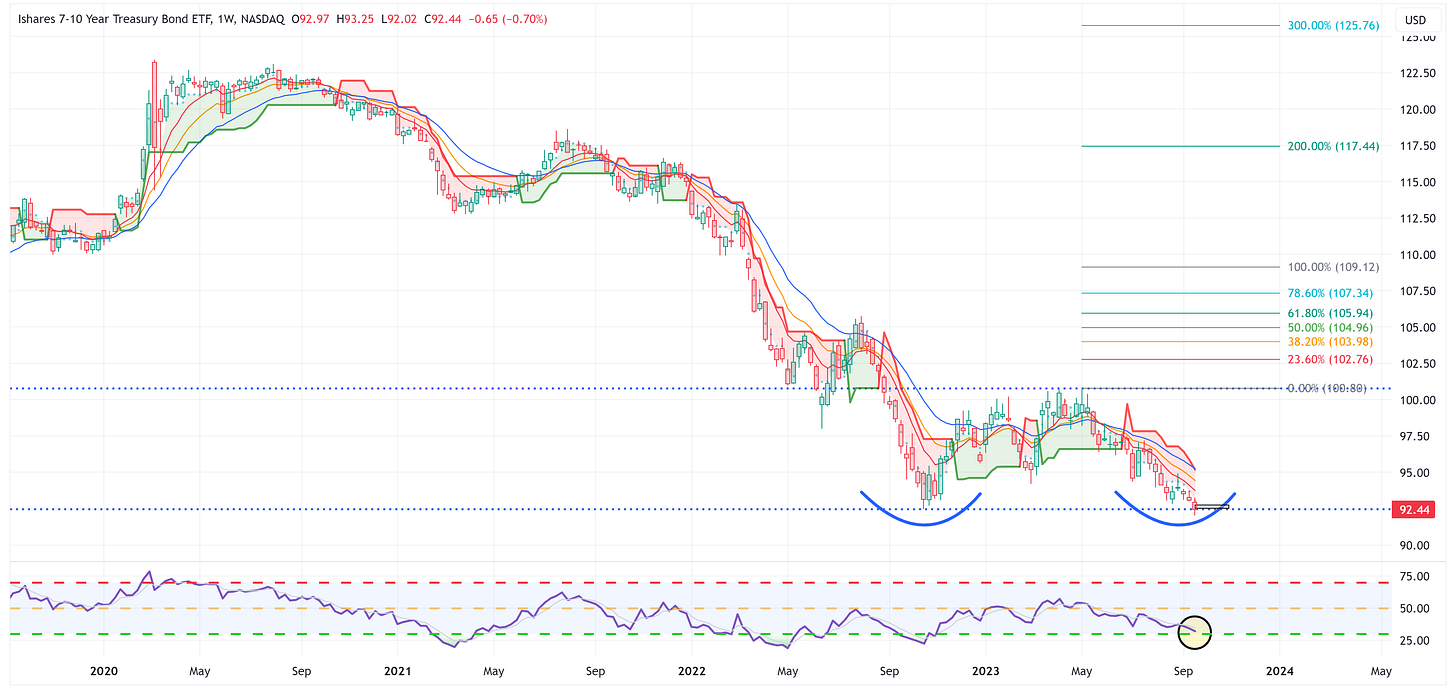
IEF: 7 - 10 Year UST
Same song for IEF, but the gap level that needs to be filled is 92.75.
IEI: 3 - 7 Year UST
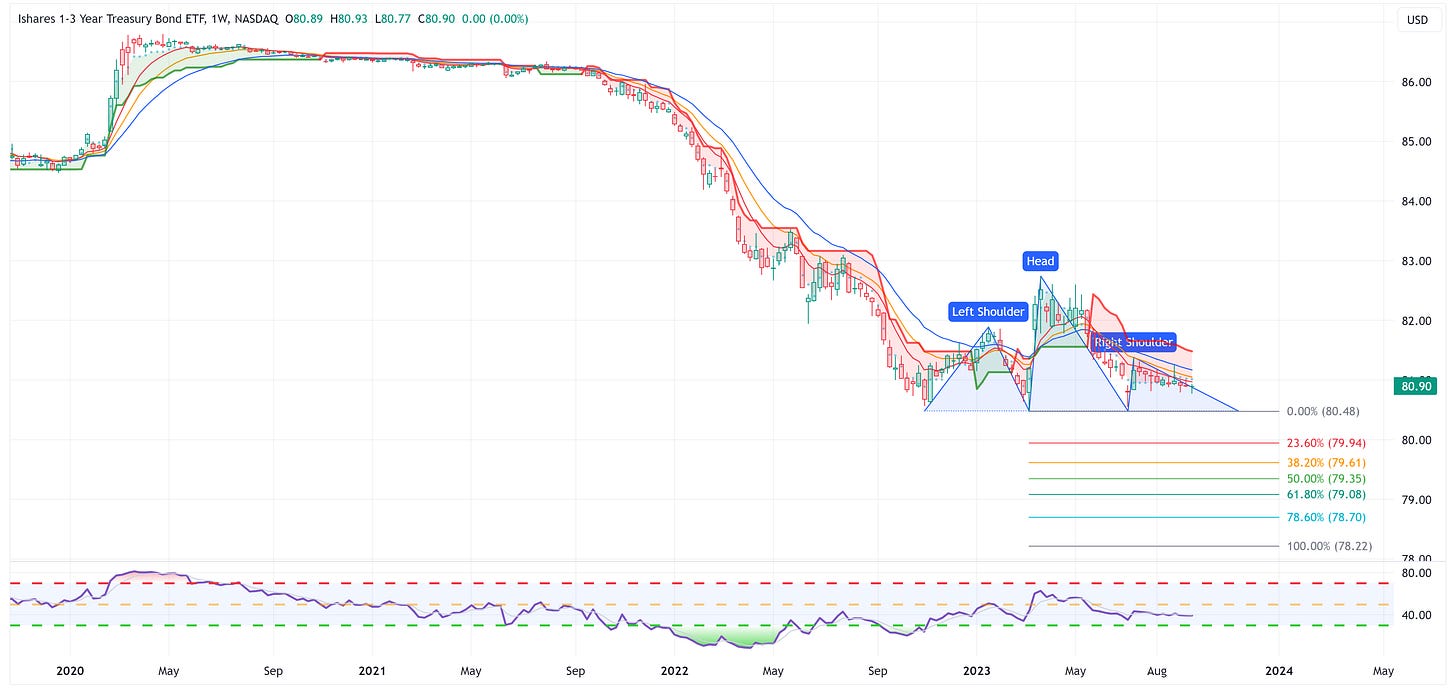
I noted last week that the price action for IEI and SHY would suggest that the Fed might not be done with their rate hikes. If they aren’t done with rate hikes, these two ETFs likely move lower in line with the prescribed H&S pattern targets.
Alternatively, if the Fed Funds futures market is correct and there are no additional rate hikes coming, these two ETFs likely will move sideways or rally.
SHY: 1 - 3 Year UST
Average Investor Allocation to Equities - Daily Chart Model
I will conclude this week with a snapshot of the daily version of my “Average Investor Allocation to Equities” model.
How to use this chart.
The blue line is the S&P 500.
The red line is my “fair value” model for the S&P 500.
“Current Value to Fair Value” is the amount the S&P 500 would “need” to decline from its current level to the “fair value” level.
“Current Z-Score Value” is a representation (in standard deviation terms) of the delta between the current price of the S&P 500 and the “fair value” price. Historically, major corrections do not end until the Z-Score falls to somewhere between -3.0 & -4.0.
Until next week…


