

Hey everyone, it’s Jim.
I hope you had a great weekend and a Happy 4th of July to everyone in advance!
Every year on the 4th of July, I push pause for a minute to do two things:
First, I give thanks to God for the country in which we live. Our country isn’t perfect, but it is by far the best one out there and we should be thanful for that and we should recognize how blessed we are to live here.
Second, I read the Declaration of Independence (here) from start to finish. In doing so, I try to put myself in the shoes of our Founding Father’s. What an incredible undertaking and an incredible document that continues to stand the test of time.
A quick programming note, due to the holiday and my travel schedule this week, next week’s newsletter may be a bit more condensed and potentially a day late. We’ll see what I can get done from the road.
With that out of the way, let’s jump into this week’s newsletter…
In this week’s newsletter:
Stay Informed
Key Macro Events From Last Week (ICYMI)
Key Macro Events To Watch This Week
The Market Map
Application - S&P 500
Deep Dive
New All-Time Highs! What Should We Expect From Here...
S&P 500 Fair Value Model
The Market Map - Extended Analysis
Major US Indices
11 Major US Equity Sectors
US Treasuries
Stay Informed
Key Macro Events From Last Week (ICYMI)
Here’s what moved markets last week:
📈 Global Manufacturing & Services PMI (June, flash)
U.S. S&P Global flash composite PMI at 52.8, reflecting continued growth; Manufacturing PMI at 52.0, Services PMI slightly cooled to 53.1. (Links - 1, 2, 3)
Composite index pointed to moderate U.S. expansion at quarter-end, though inflationary pressures remain due to tariffs.
🏠 Housing Market (May)
Existing Home Sales
Slight increase of 0.8% to 4.03 million annualized units, but still the slowest May pace since 2009; median price rose to $422,800. (Link)
New Home Sales
Plummeted 13.7% to a 623,000 SAAR—the largest monthly decline since October 2024; inventory rose to 507,000 homes (9.8-month supply). (Link)
💳 Consumer Confidence & Sentiment
Conference Board Confidence (June): declined to 93 from 100, reversing modest May gains. (Link)
University of Michigan Sentiment: improved to 60.7 in June (from 52.2), though still below pre‑pandemic norms. (Link)
📉 Jobless Claims (week ending June 21)
Initial claims dropped 10,000 to 236,000, below expectations (~244k); the 4‑week average fell to 245,000. (Link)
Continuing claims (for week ending June 14) rose 37,000 to 1.974 million—the highest since November 2021; the 4‑week average climbed to 1.941 million.
💵 Personal Income & Real Spending – May (released June 27)
Personal income fell 0.4% MoM, the largest retreat since September 2021. (Link)
Consumer spending dropped 0.1%, marking the second drop this year; spending on goods fell 0.8%, while services edged up 0.1%. (Link)
📌 Core PCE (May 2025)
Month-over-month: +0.2% (up from +0.1% in April), slightly above expectations. (Link)
Year-over-year: +2.7% (up from +2.6% in April), exceeding the Fed’s 2% target.
Key Macro Events To Watch This Week
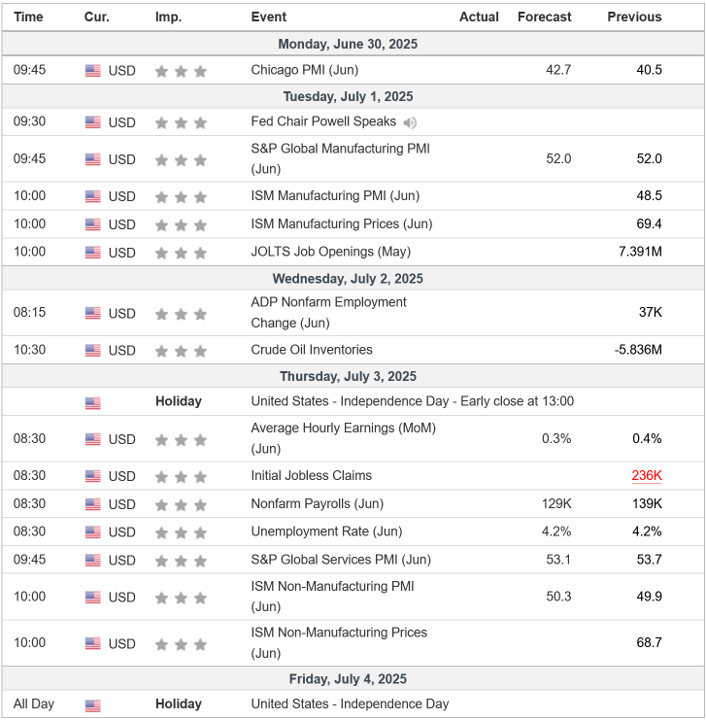
I expect that it will be a low-volume / low-activity week with many people out for the 4th of July holiday, but Nonfarm Payrolls and the Unemployment Rate will still warrant attention.
We are running a “4th of July” sale for 70% off your first year. This offer expires at the end of the 4th of July weekend so you have to sign up before midnight on July 6th.
The Market Map - Application - S&P 500
This week, we’re going to combined this section with our usual “Deep Dive” section.
I want to explore what we could expect from the market (i.e., the S&P 500) now that we’ve reached new all-time highs and we’ll do so from a few different points-of-view.
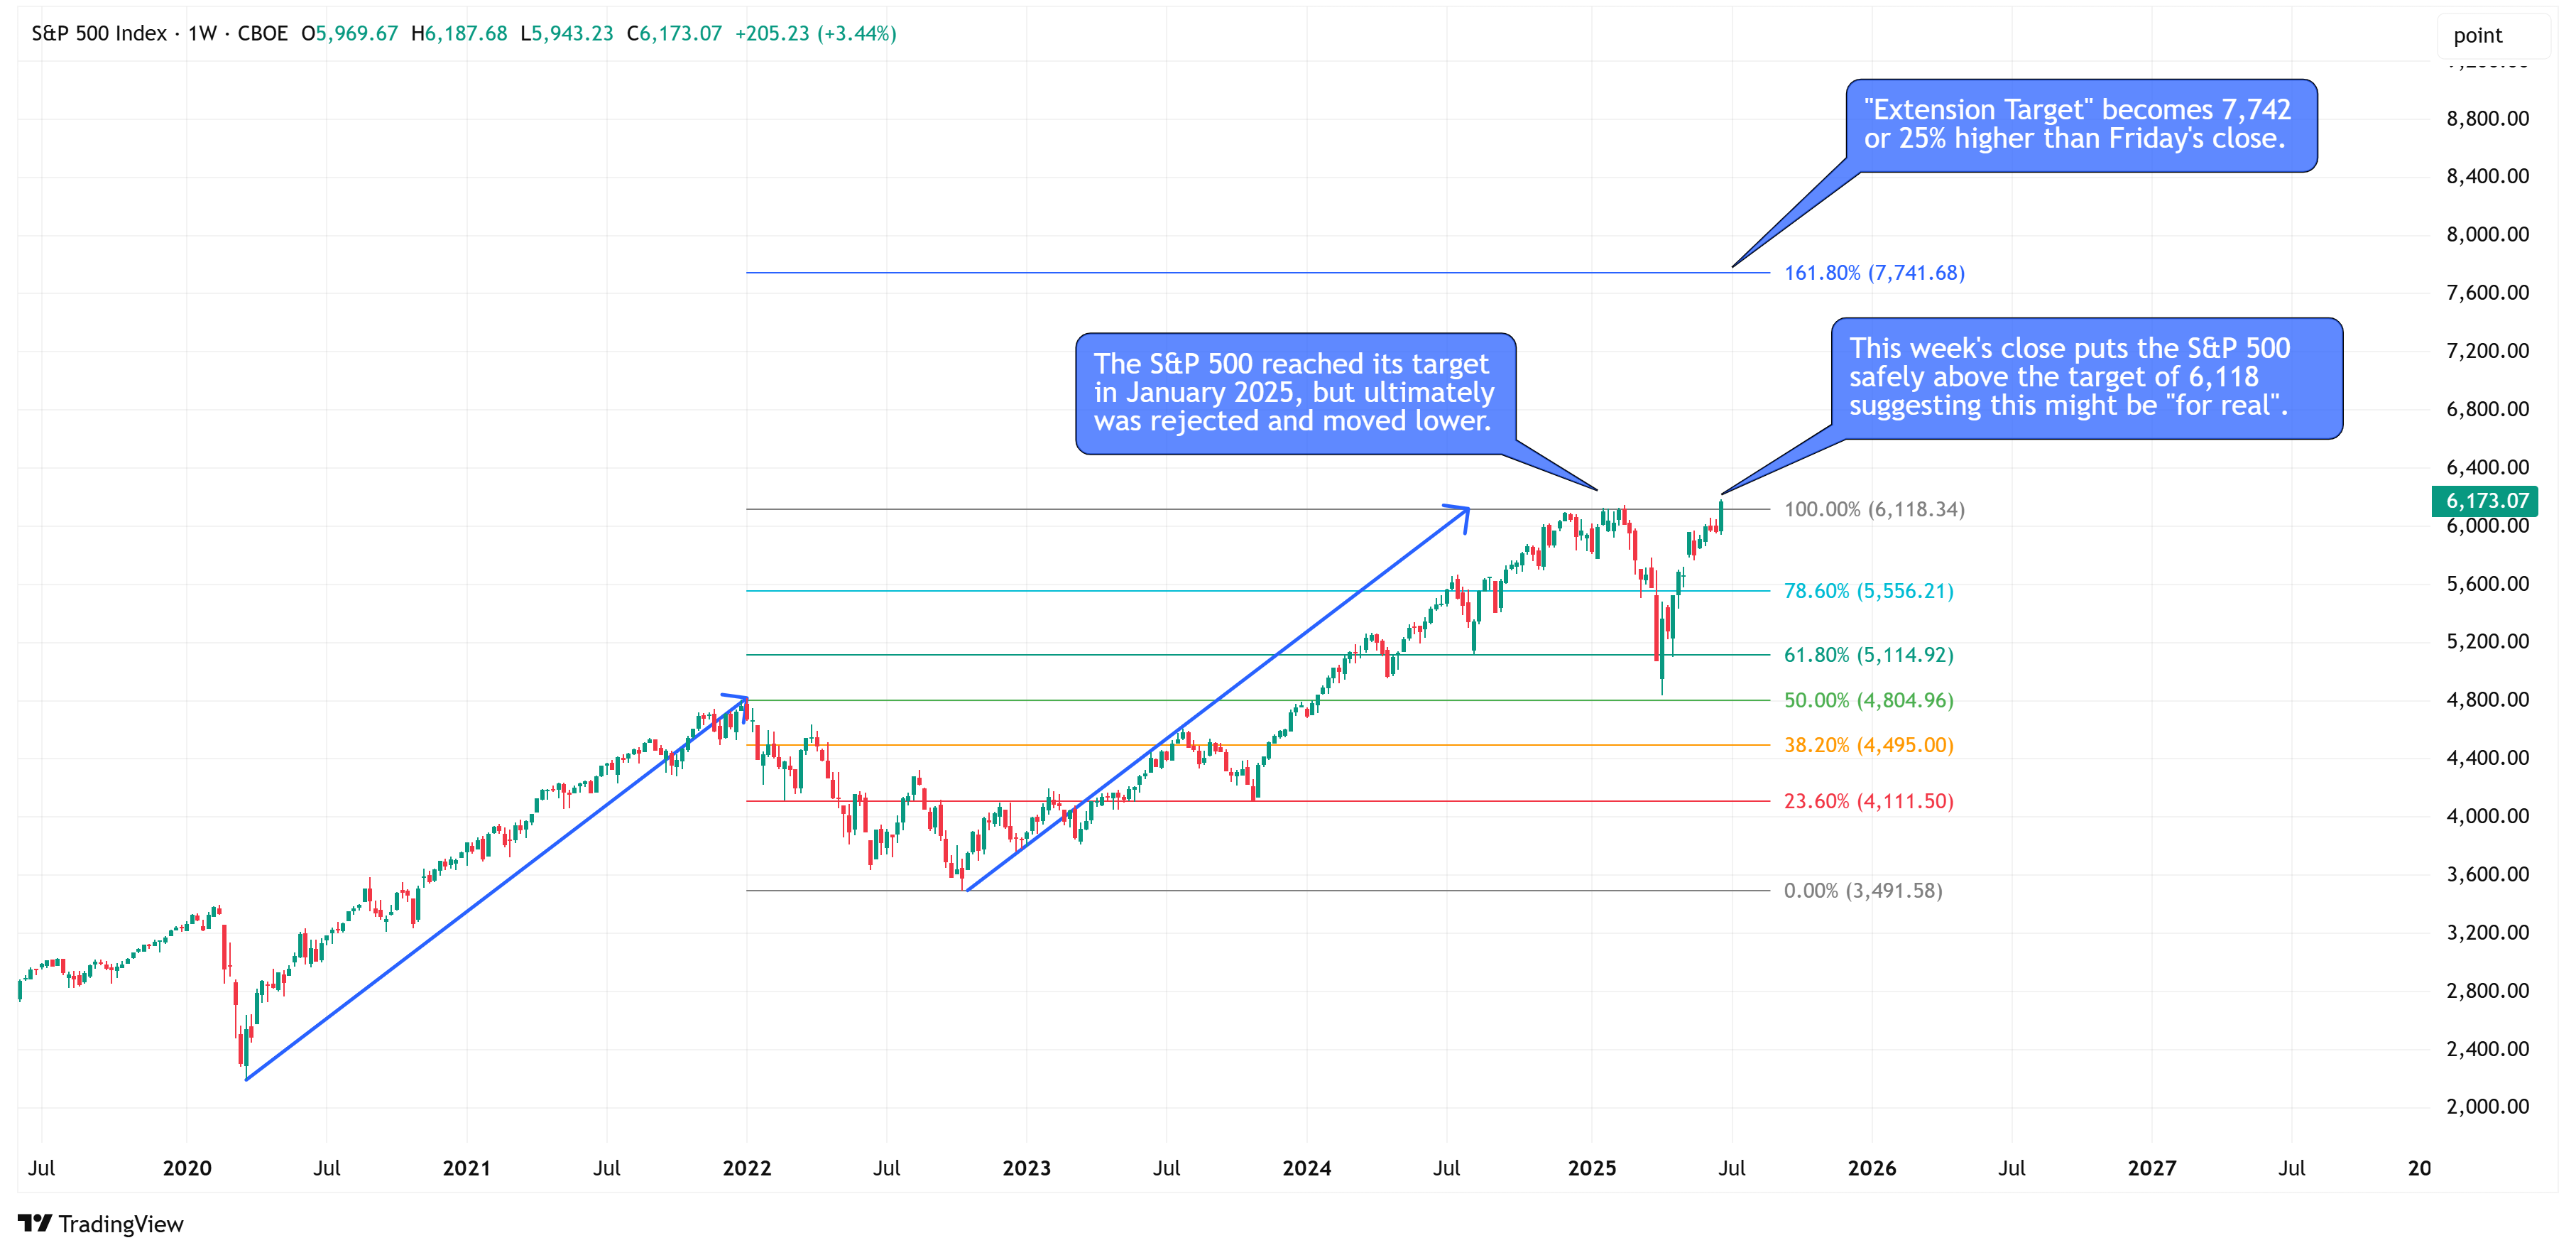
POV #1:
There’s no two ways about it, reaching new all-time highs is inherently bullish.
Looking at the weekly chart (see below) and using very basic technical analysis, we can see that 6,118 was the “measured move” target when considering the lows from 2020 vs. the highs from 2022 and then mapping that distance from the lows of 2022.
The question you’re probably asking now is “Where do we go from here?”
The bullish case would suggest a move to ~7,741, which is simply the “extension target” based on the technical pattern outlined above.
POV #2:
Yes, we reached new all-time highs but we kind of limped across the finish line.
If we look at the daily chart of the S&P 500 futures (I wanted to be able to show the volume - bottom panel) we find something interesting.
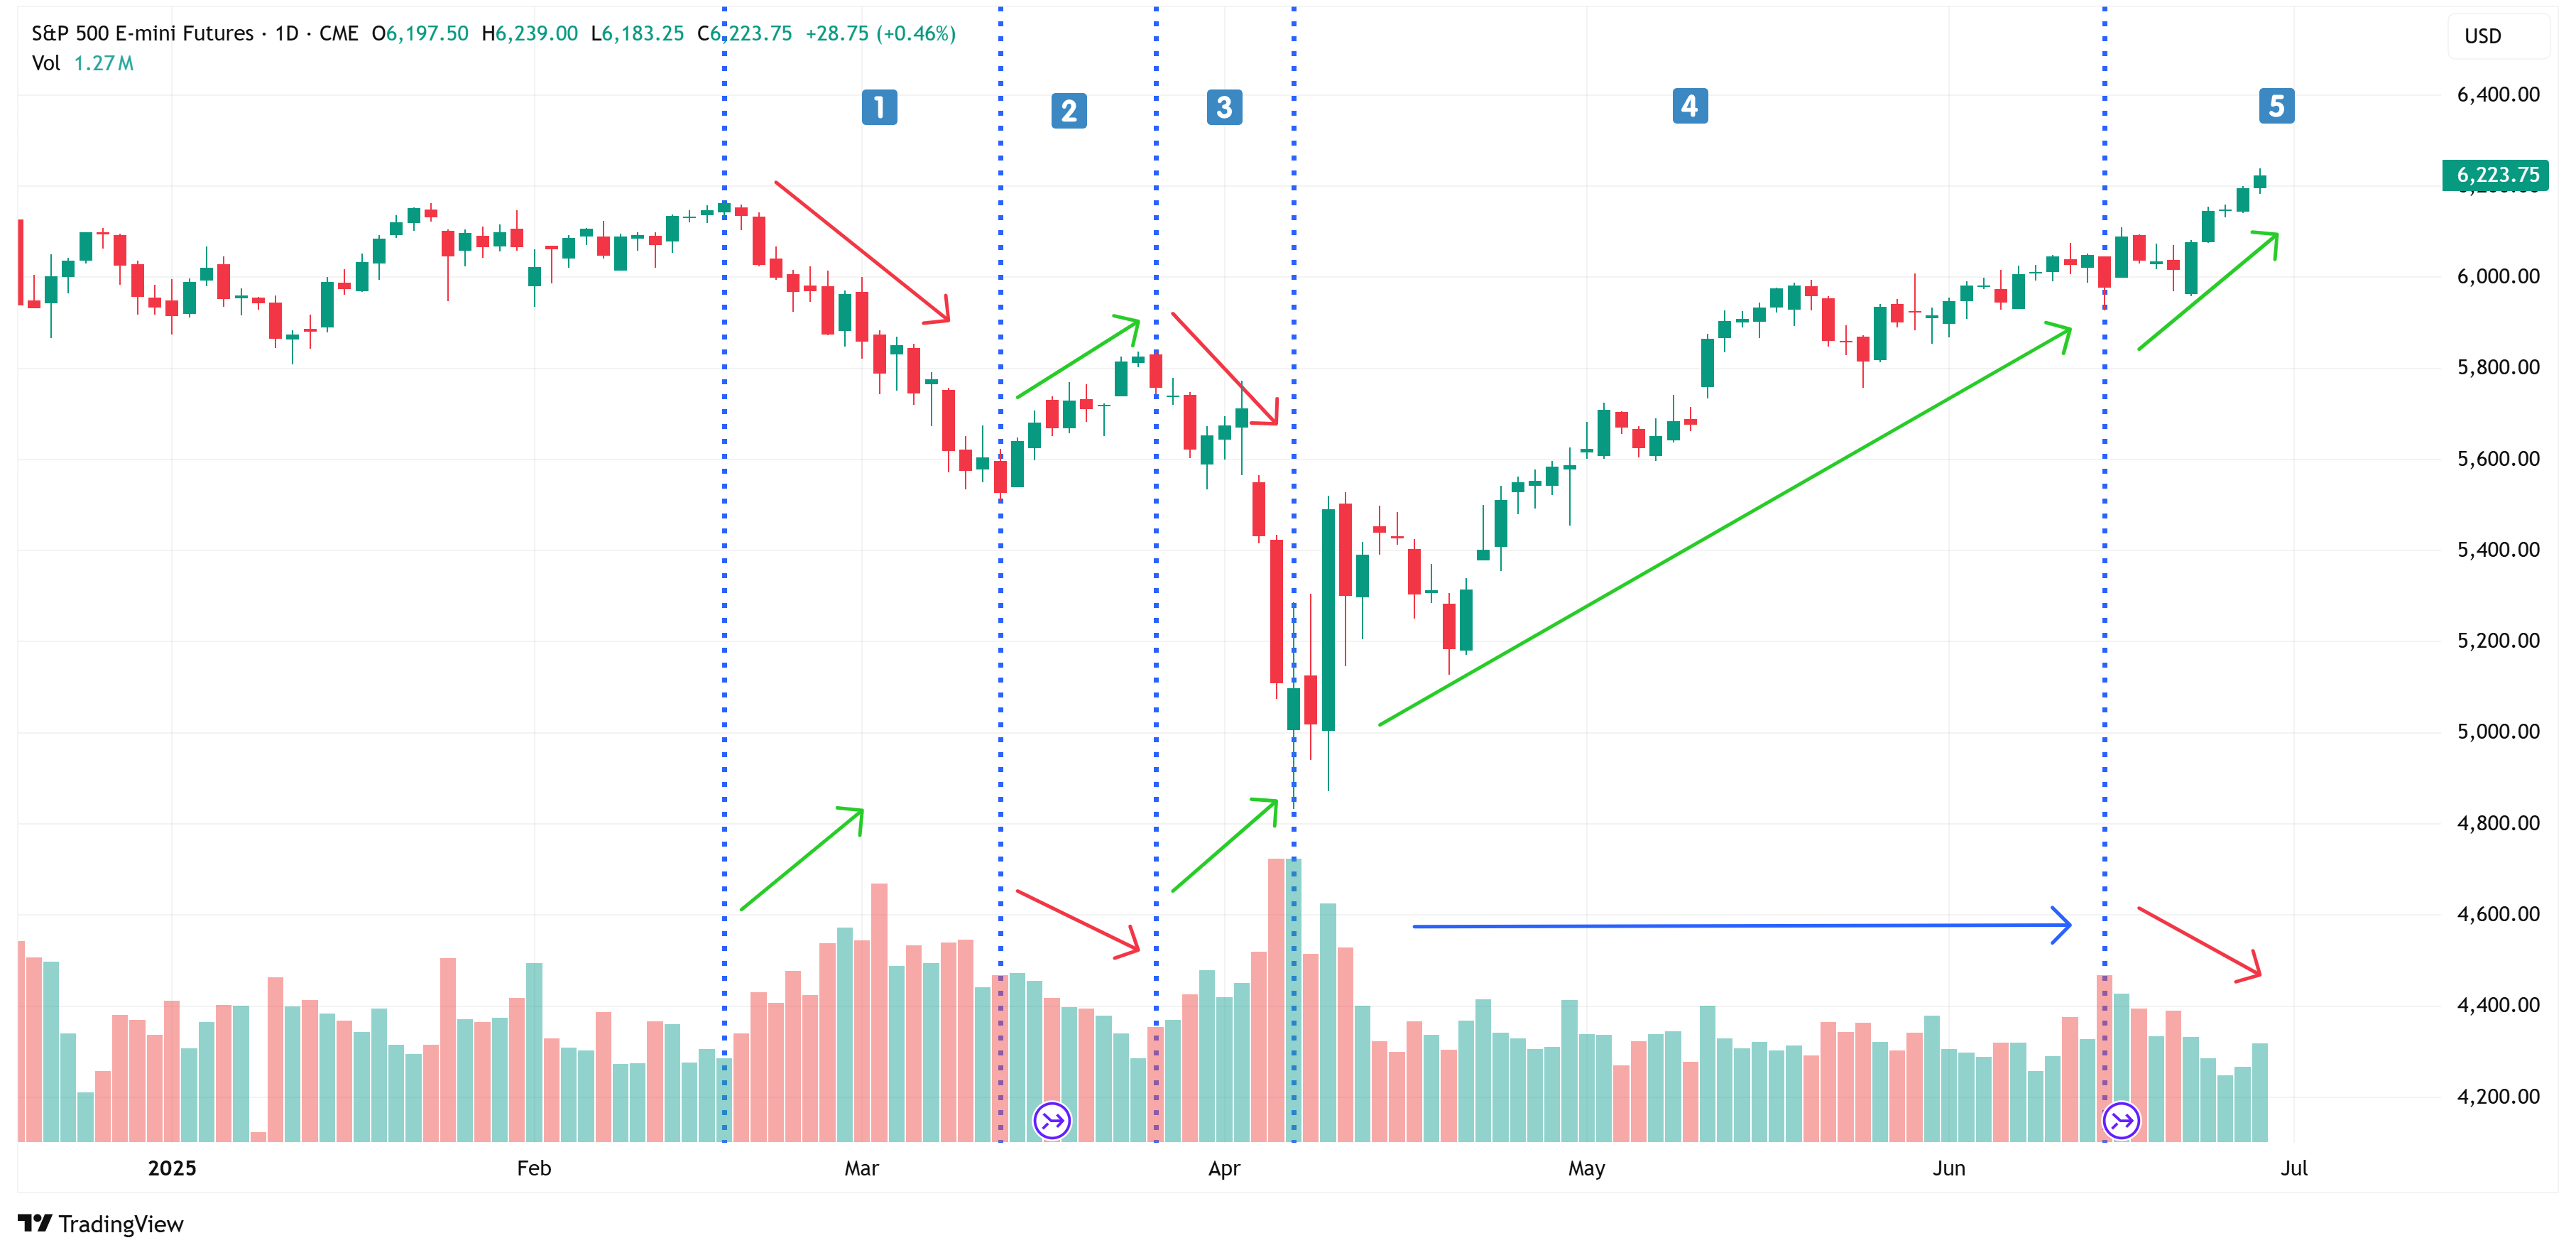
Notice that in the February - March selloff, volume was increasing (column 1) but then as the market tried to rally back into early April, it did so on declining volume (column 2).
Any time you see a substantial move (in either direction), ideally, you want to see that move validated by increasing volume (or at a minimum, volume that isn’t declining).
Fast foward to column 3 and we see the tariff announcement selloff take place with increasing volume.
Column 4 shows a substantial rally but effectively sideways volume that was on average lower than year to date volume.
Column 5 shows the last push towards all-time highs and notice that it took place on declining volume.
My very unscientific qualitative assessment is that the market is not necessarily on board with the bullish attempts we’ve seen so far year-to-date.
I can’t give you a reason for that, maybe it’s valuations, the perceived lagged tarriff impact, the lack of Fed rate cuts, honestly, I don’t know but it is something to monitor going foward.
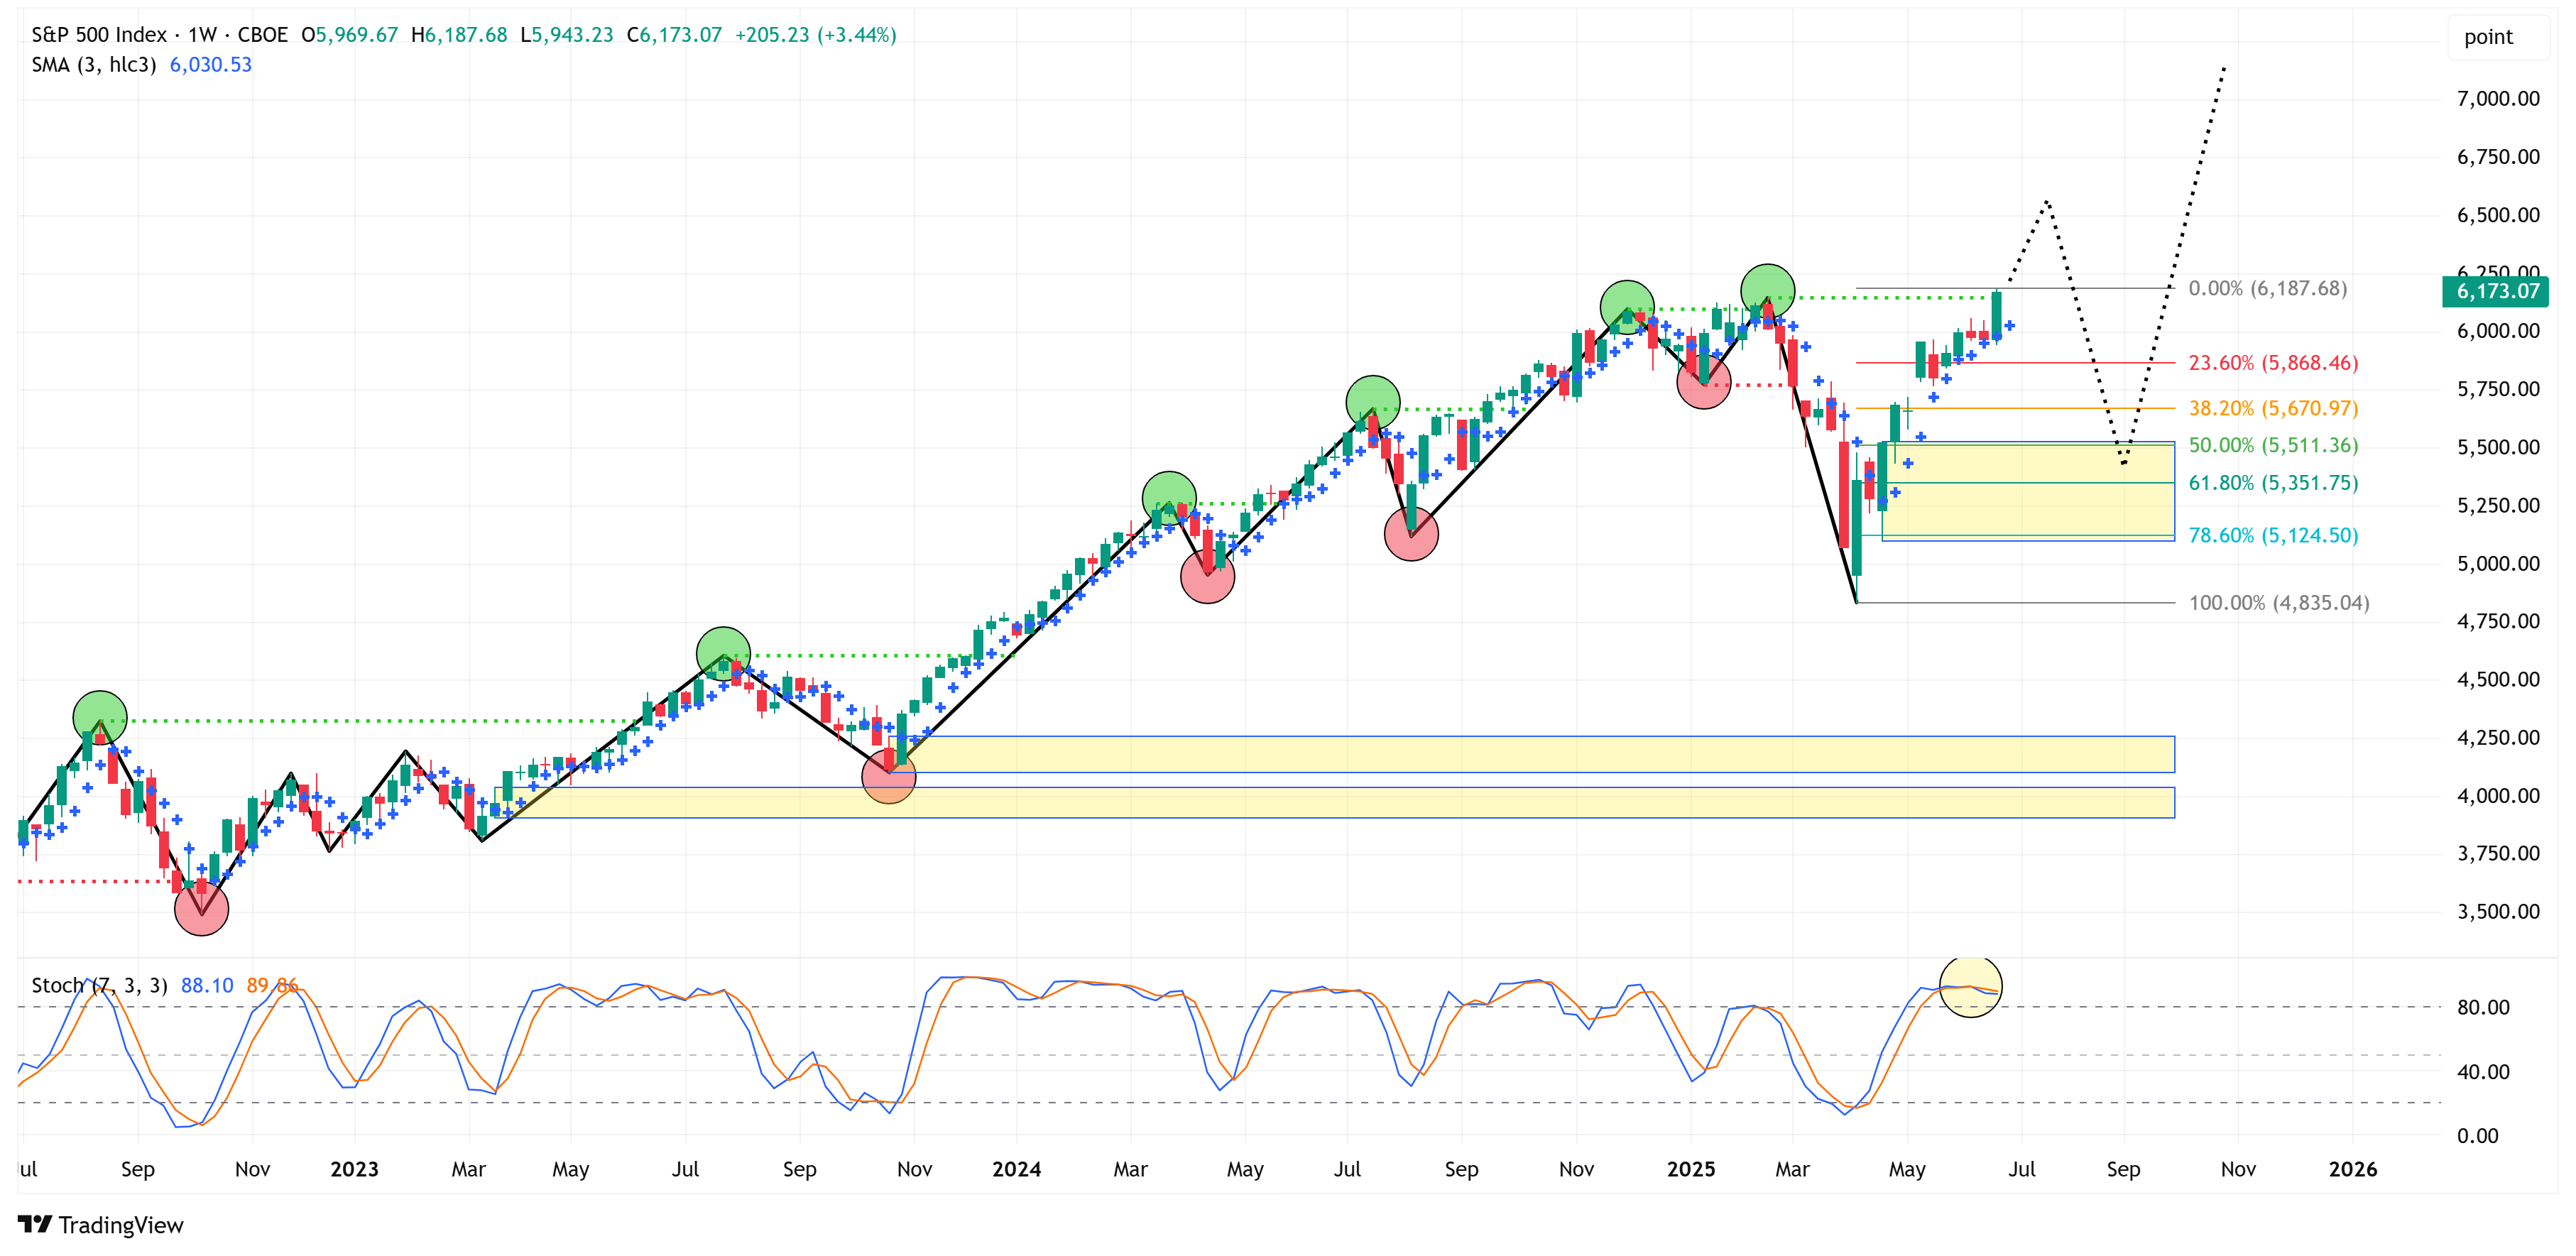
POV #3:
Expect a continued move higher but keep an eye on the “overbought” conditions as noted in the stochastic in the bottom panel of the chart below.
If you look at the weekly chart above, you’ll notice that there were a number of pullbacks and then moves higher as the market rallied from the lows of 2022 to current highs.
We should expect the same as we move forward and often these pullbacks begin from “overbought” conditions.
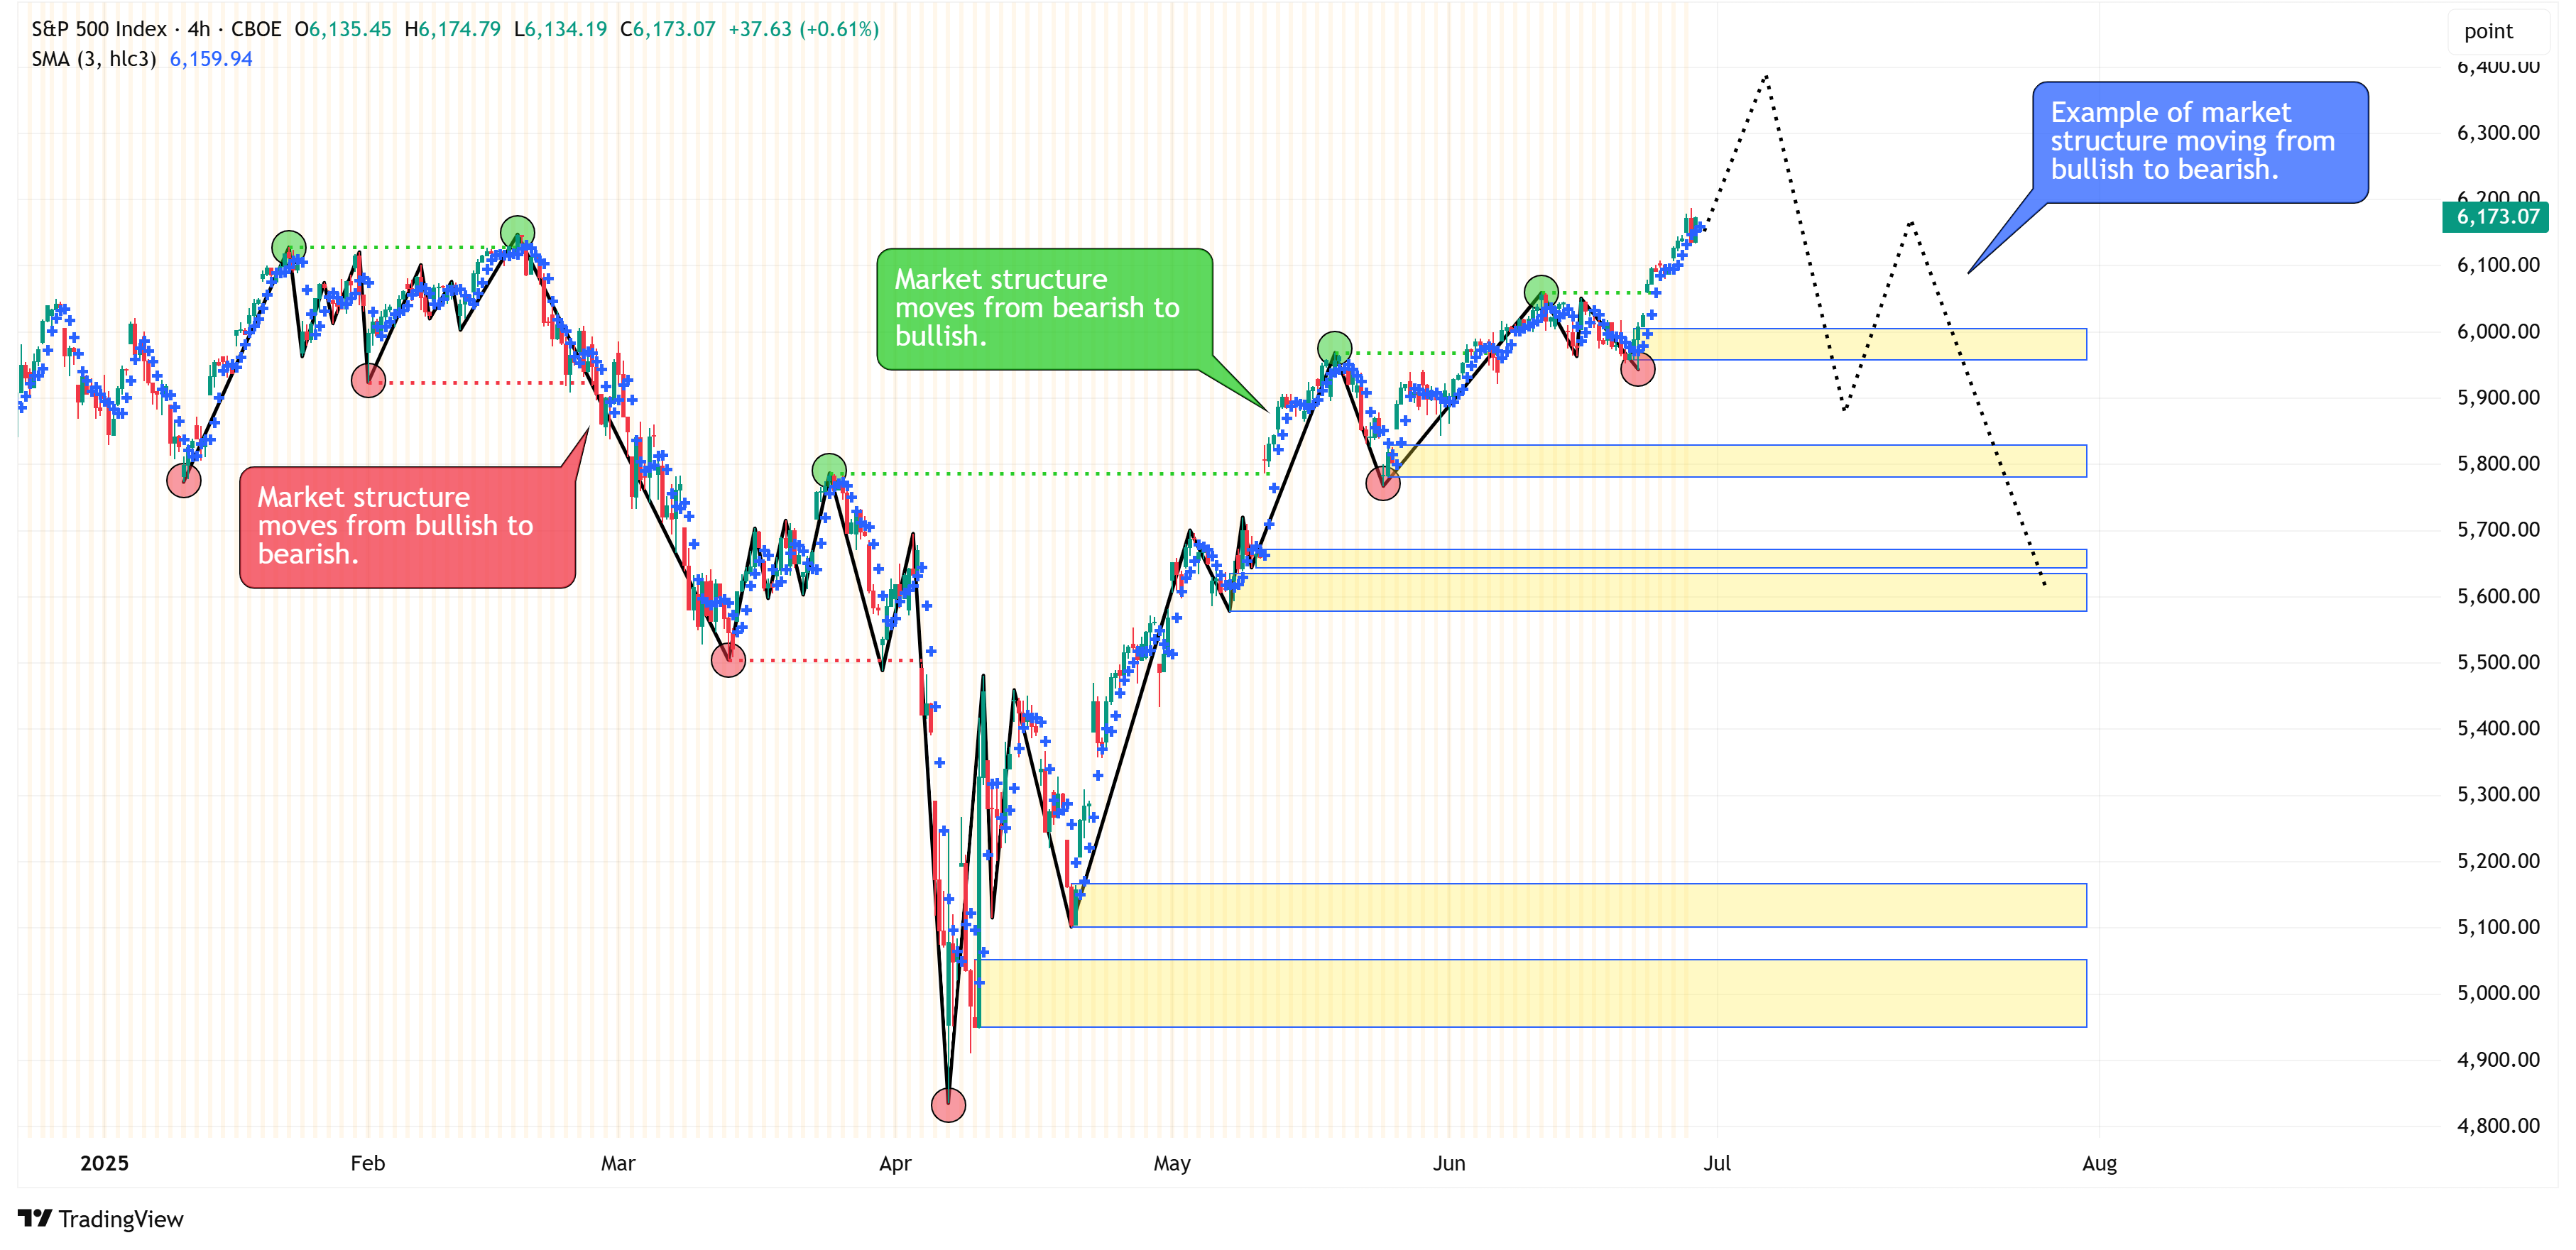
Let’s turn to the weekly “market structure” chart we’ve been using for some time now.
As an aside, going forward, I’m going to highlight the supply/demand zones with yellow boxes (see chart below). These are areas where we should expect price to gravitate towards over time and can be used as key pivot points for pullbacks, etc.
Combining market structure with our supply/demand zones, it would not be unreasonable to see the market continue to push higher but then retrace back to the demand zone as I’ve outlined with the dotted line in the chart below.
This will be an ideal spot for someone looking to get long, especially if our stochastic indicator moves to “oversold” conditions by that time.
POV #4:
All else being equal, the break to new all-times is bullish and suggests a continued move higher.
With that said, we need to watch the 4-hour time frame to get a clue as to when we might see a retracement as outlined above.
This will manifest itself with the market structure on the 4-hour time frame shifting from bullish (current state) to bearish.
Until we get this shift, we should assume markets are moving higher.
Final thoughts:
New all-time highs is bullish and we should recognize that.
There will be pullbacks along the way, those should be considered buying opportunities (for now).
As it stands currently, the weekly chart does not turn bearish until we close below 4,835.
This can change if structure changes in the future, I’ll keep you posted if/when that happens.
The sections that follow are for paid subscribers only.
In these sections, we will discuss our proprietary:
S&P 500 Fair Value Model
This model provides a guide for:
a) How far the S&P 500 could decline in the next recession.
b) When to get back into the market after it has declined.
The Market Map - Extended Analysis
We will call out specific price objectives (up trends vs. down trends, targets, stop losses, etc.) on the following:
Major US Indices
11 Major US Equity Sectors
US Treasuries
Don’t miss our “4th of July” sale…sign up before midnight on July 6th to take advantage of all the analysis below this section…
Keep reading with a 7-day free trial
Subscribe to Skillman Grove Research to keep reading this post and get 7 days of free access to the full post archives.