


Weekly Chart Review
Inflation rising? Maybe not...and what that may mean for the market and your portfolio...

This past weekend, I had the privilege of attending the RIA 2025 Economic Summit hosted by RIA Advisors.
Speakers included Lance Roberts (@LanceRoberts) and Michael Lebowitz (@michaellebowitz) and there was a panel hosted by Thoughtful Money founder, Adam Taggart (@menlobear).
To say that it was exceptional is an understatement and I thought I would use this week’s newsletter to highlight a few key points they made.
If you haven’t heard of RIA Advisors or Thoughtful Money, I highly recommend checking them out on all the usual social media channels/forums.
Note: they have given me permission to reuse some of their slides, where applicable, below.
Now, let’s examine some of the weekend's takeaways and consider how they may impact the markets, and potentially your portfolio, in 2025.
Inflation
The biggest takeaway was RIA’s view on inflation and how it differs from the current market narrative.
The current market narrative suggests that inflation is coming back and that it may be here for longer than we expect.
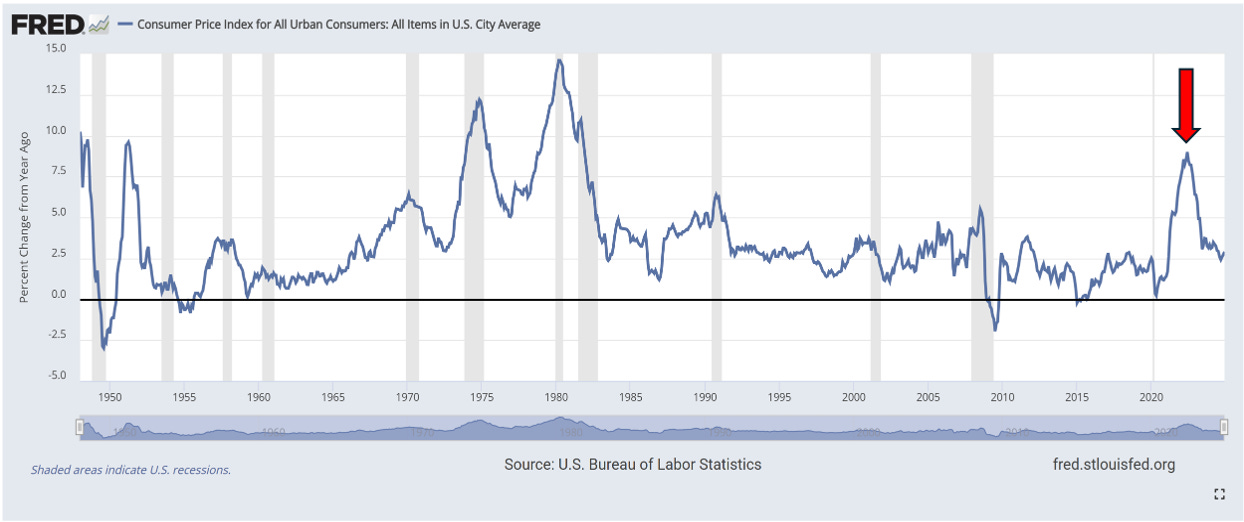
I think we can all agree that inflation has been “stickier” than the FOMC would like (i.e., it hasn’t fallen to their 2% target) but that doesn’t necessarily suggest that inflation is heading back towards the highs of 2022 (see chart below).
RIA shared the following chart which suggests that the current inflation narrative doesn’t jibe with reality.
They point to 8 different inflation metrics, 6 of which have fallen since June while only 2 have risen (see red/green boxes in the chart below).

If that is the case, how do we explain the rise in US Treasury 10-year (UST10) yields that we’ve seen since September of last year?
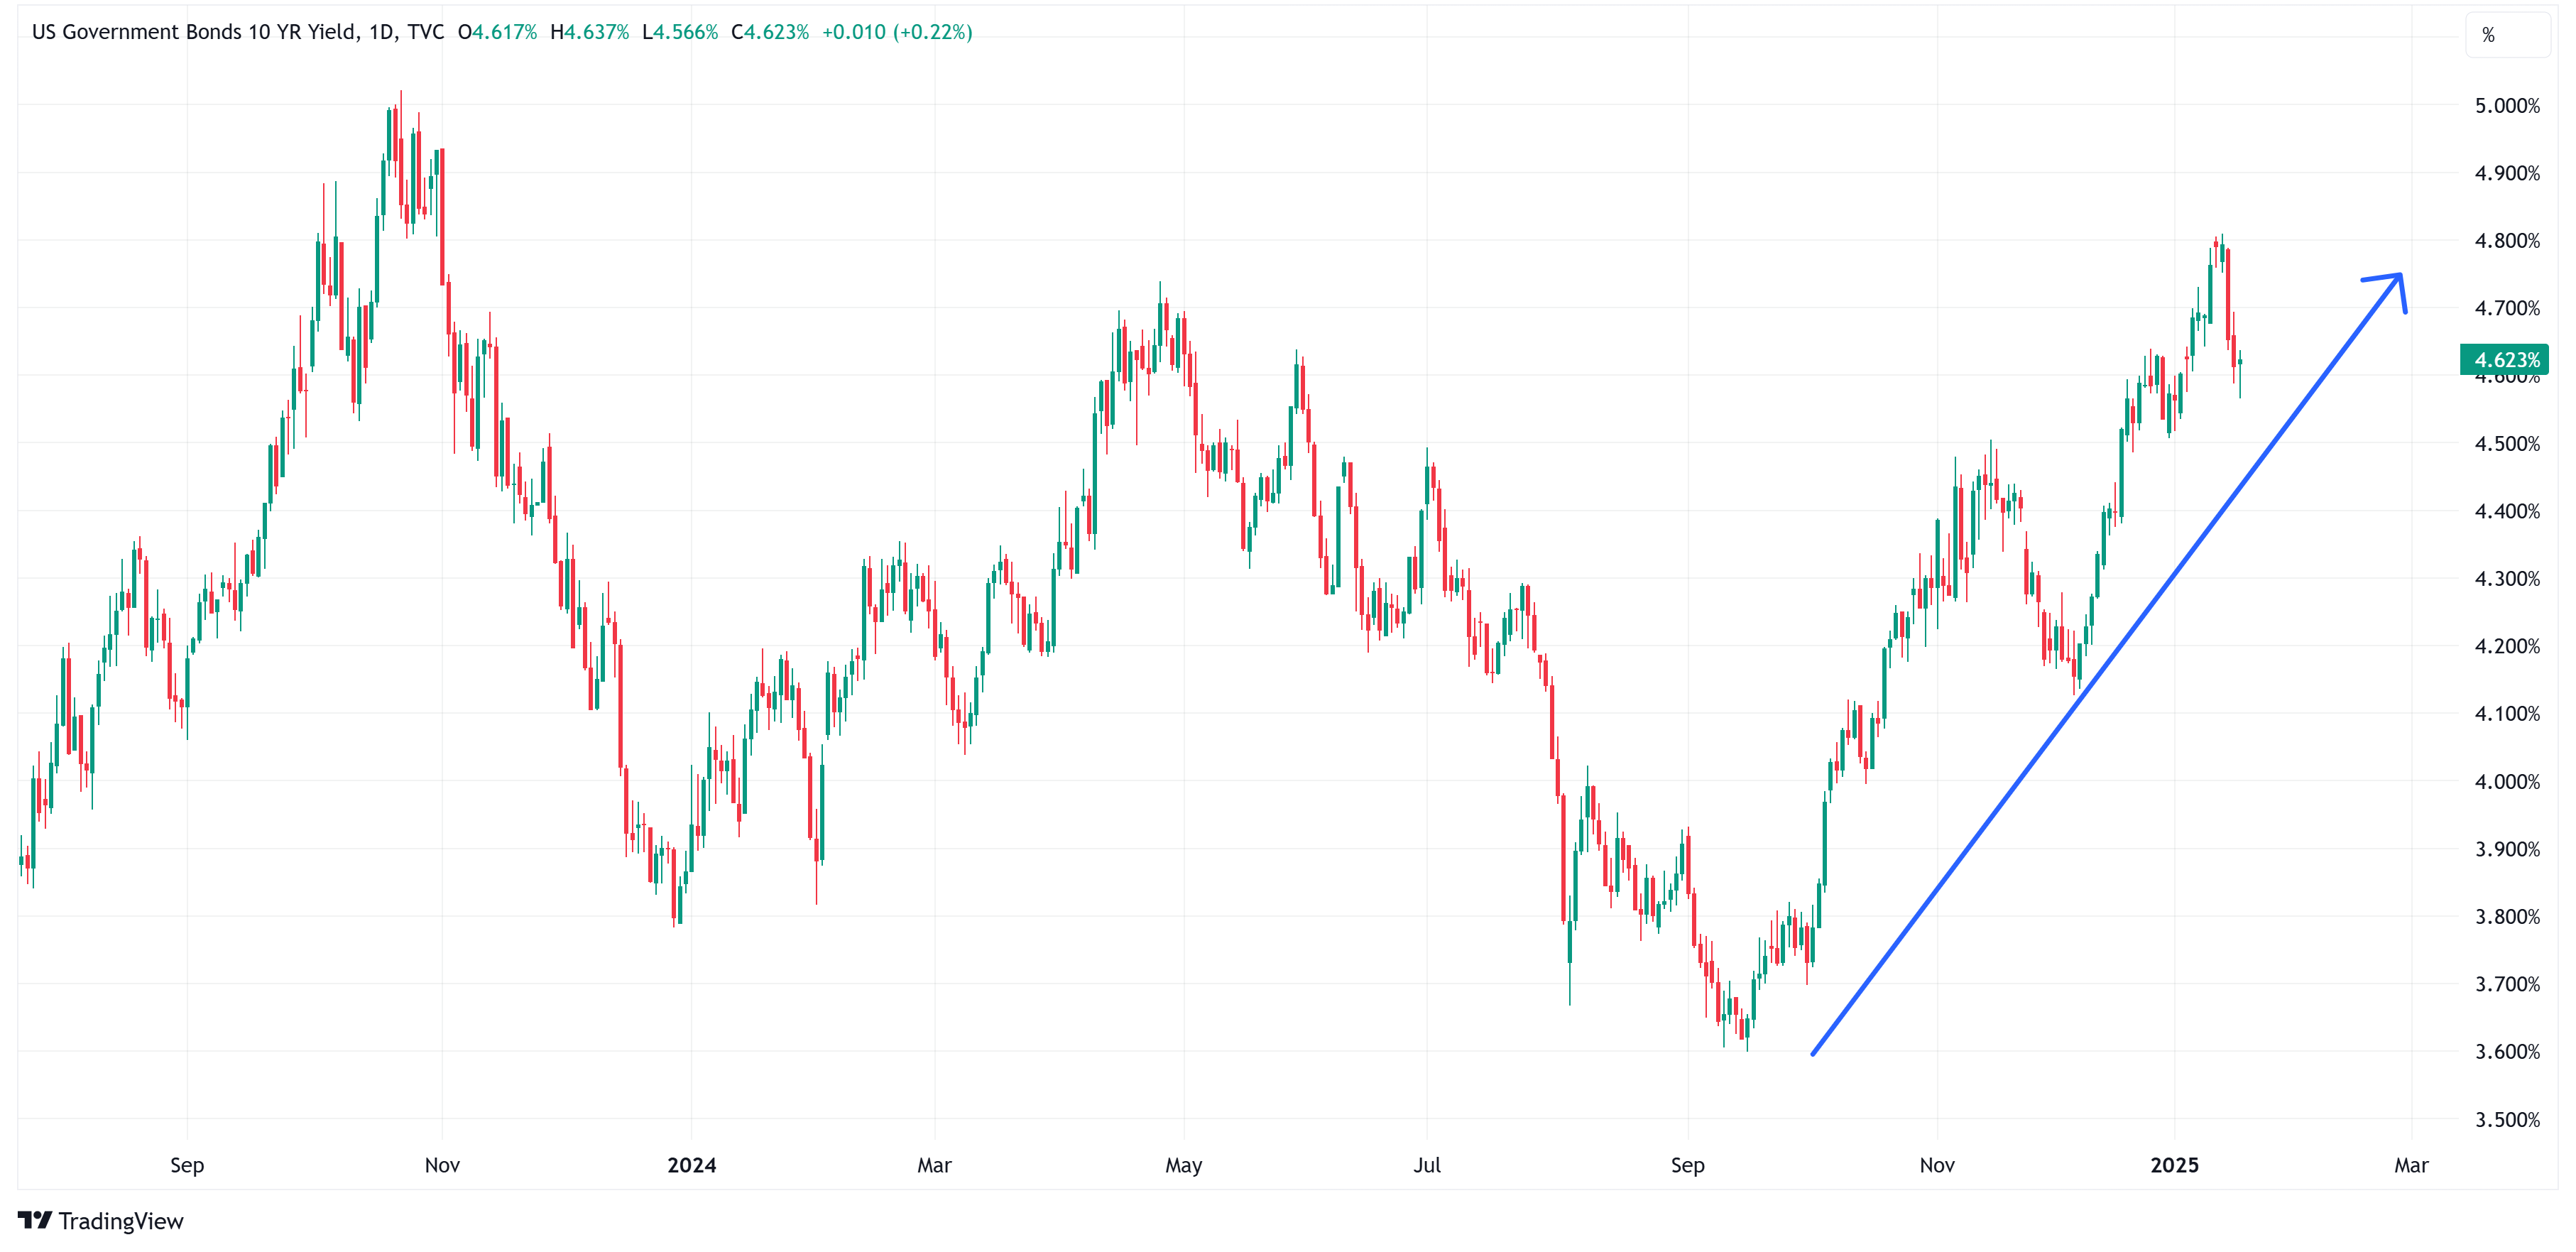
RIA would suggest that it is a function of market sentiment (i.e., “term premium or discount”) and not necessarily based on underlying fundamentals.
Note the difference between the orange and blue lines in the chart below and even more importantly, the “Difference” histogram along the bottom of the chart.
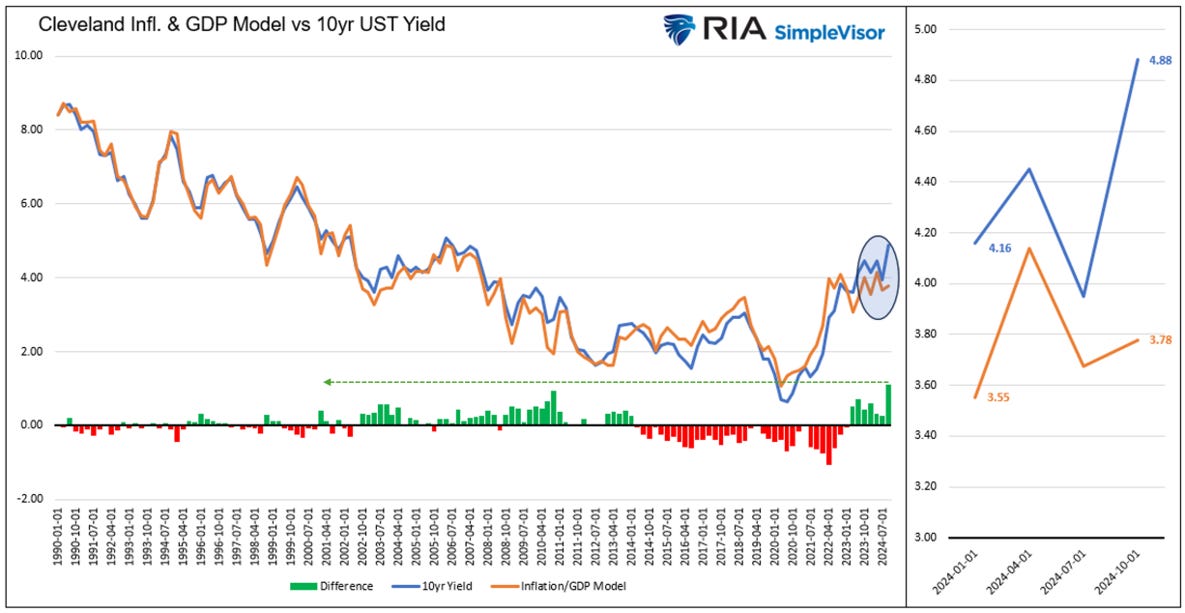
The “Difference” histogram in the above chart is +3 standard deviations of its typical average (see the red “Current” dot in the chart below).

For this to normalize, either inflation expectations have to rise or the UST10 yields have to fall (or some combination of both).
So which is it?
RIA argued that given the “interconnectedness” of the global economy, it’s more likely that the US is slowing (i.e., the directionality of most of the rest of the world) vs. growing; therefore, inflation should be coming down and not rising.

This would suggest that for the “term premium” chart above to normalize, we’ll likely see a greater decline in UST10 yields than an increase in inflation.
If that is the case, then it’s possible that UST10 yields could be nearing the end of their topping range.
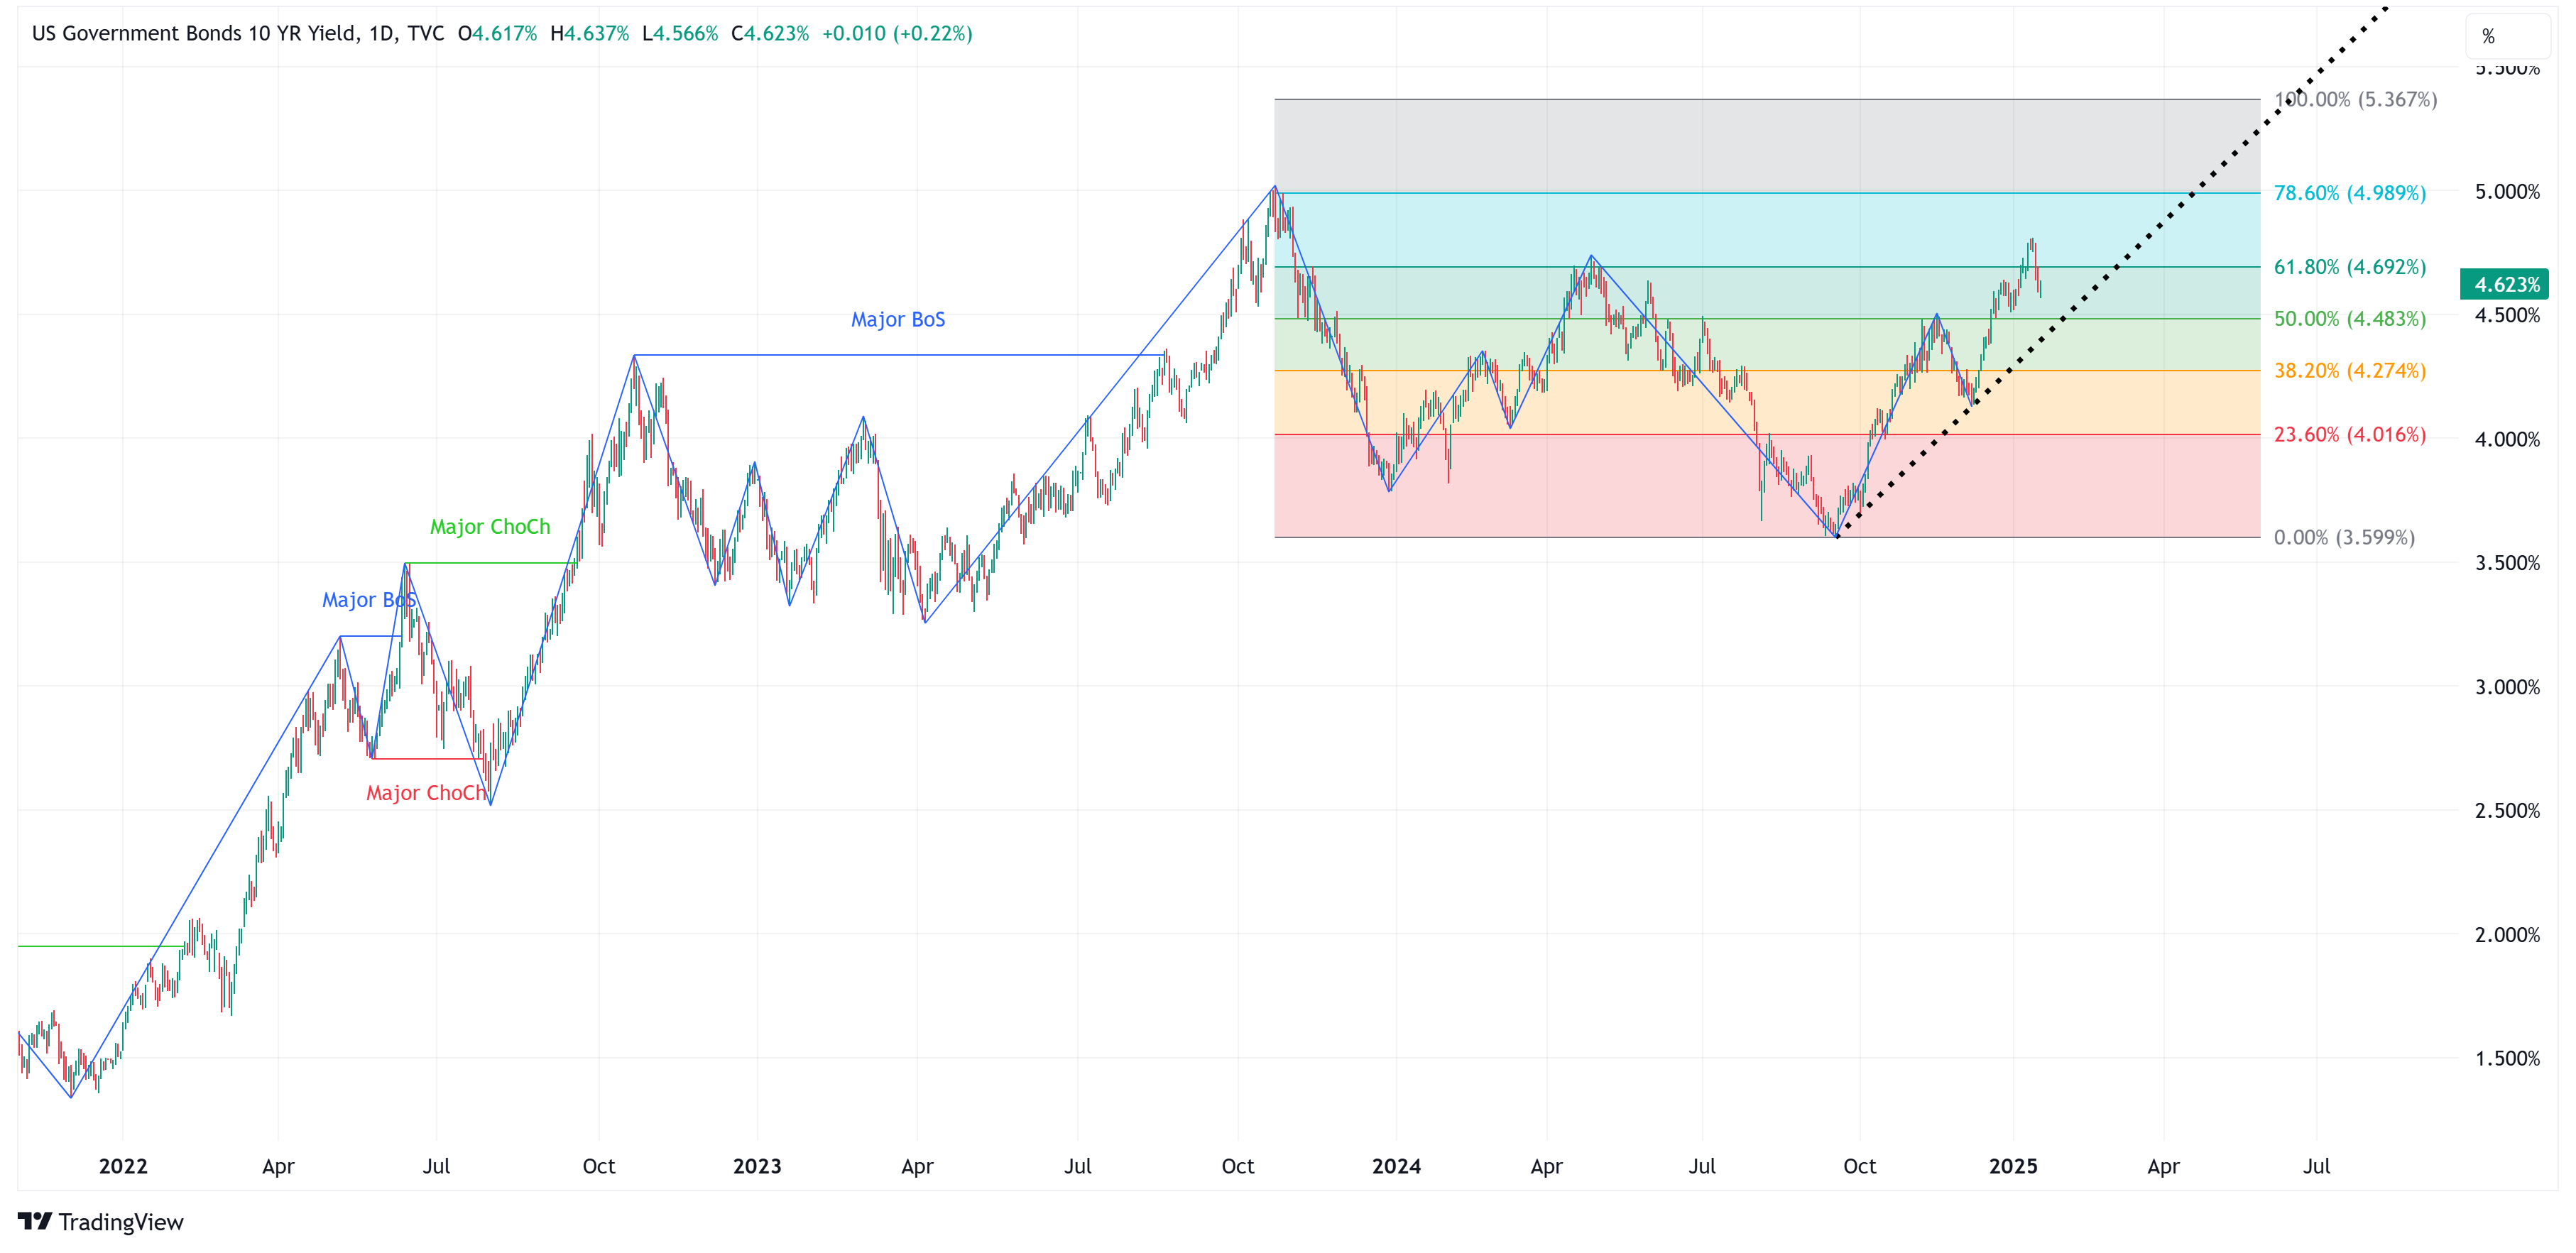
I have argued for some time now that, based on technicals, it wouldn’t be out of the realm of possibilities to see the UST10 yield trade as high as 5.37% (see the chart below).
This still might be the case, but if it’s not and yields are set to decline, how will we know?
One easy way to tell that this might be underway is to see UST10 yields fall below the black dotted trend line in the chart above.
For UST10 yields to fall appreciably, they have to break down and through that black dotted line, until then, assume they are moving higher with 5.37% as a target.
Let’s say UST10 yields do start to turn and head lower. If that happens, very quickly, you’re going to see ETFs like TLT and ZROZ (i.e., longer duration Treasury funds) put in a bottom and start trading higher.
Looking at the charts, it certainly seems like TLT and ZROZ could be in the process of putting in an inverse head & shoulders bottom. If so, this would equate to price targets of TLT = ~$122 and ZROZ = ~$111.
TLT
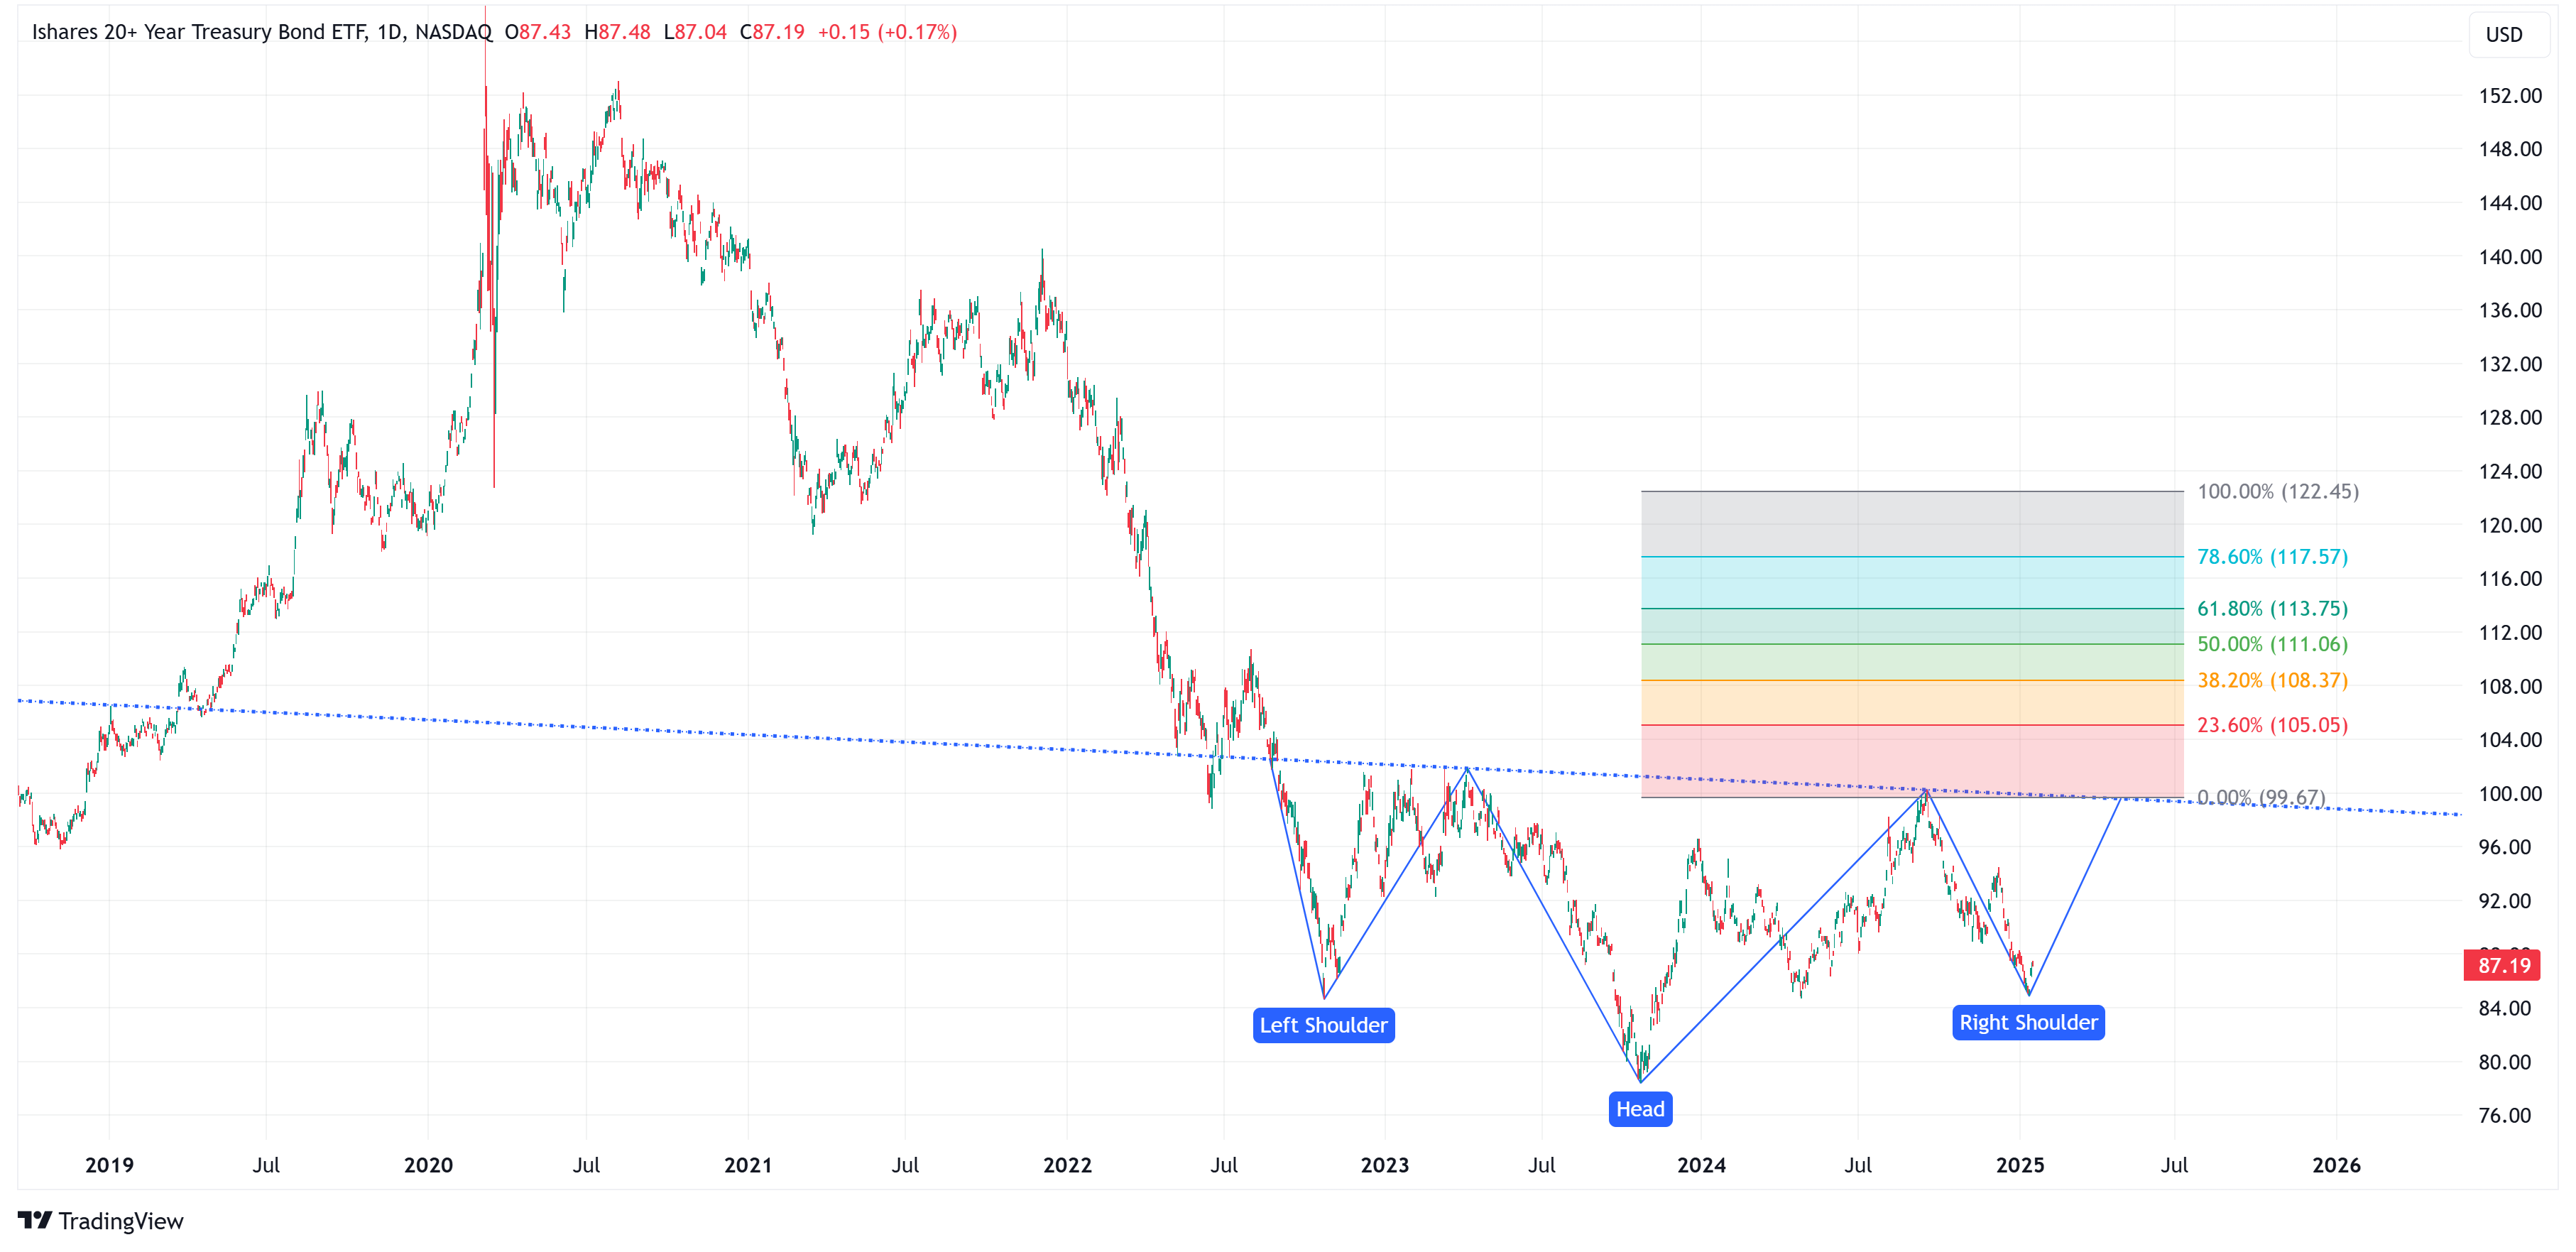
ZROZ
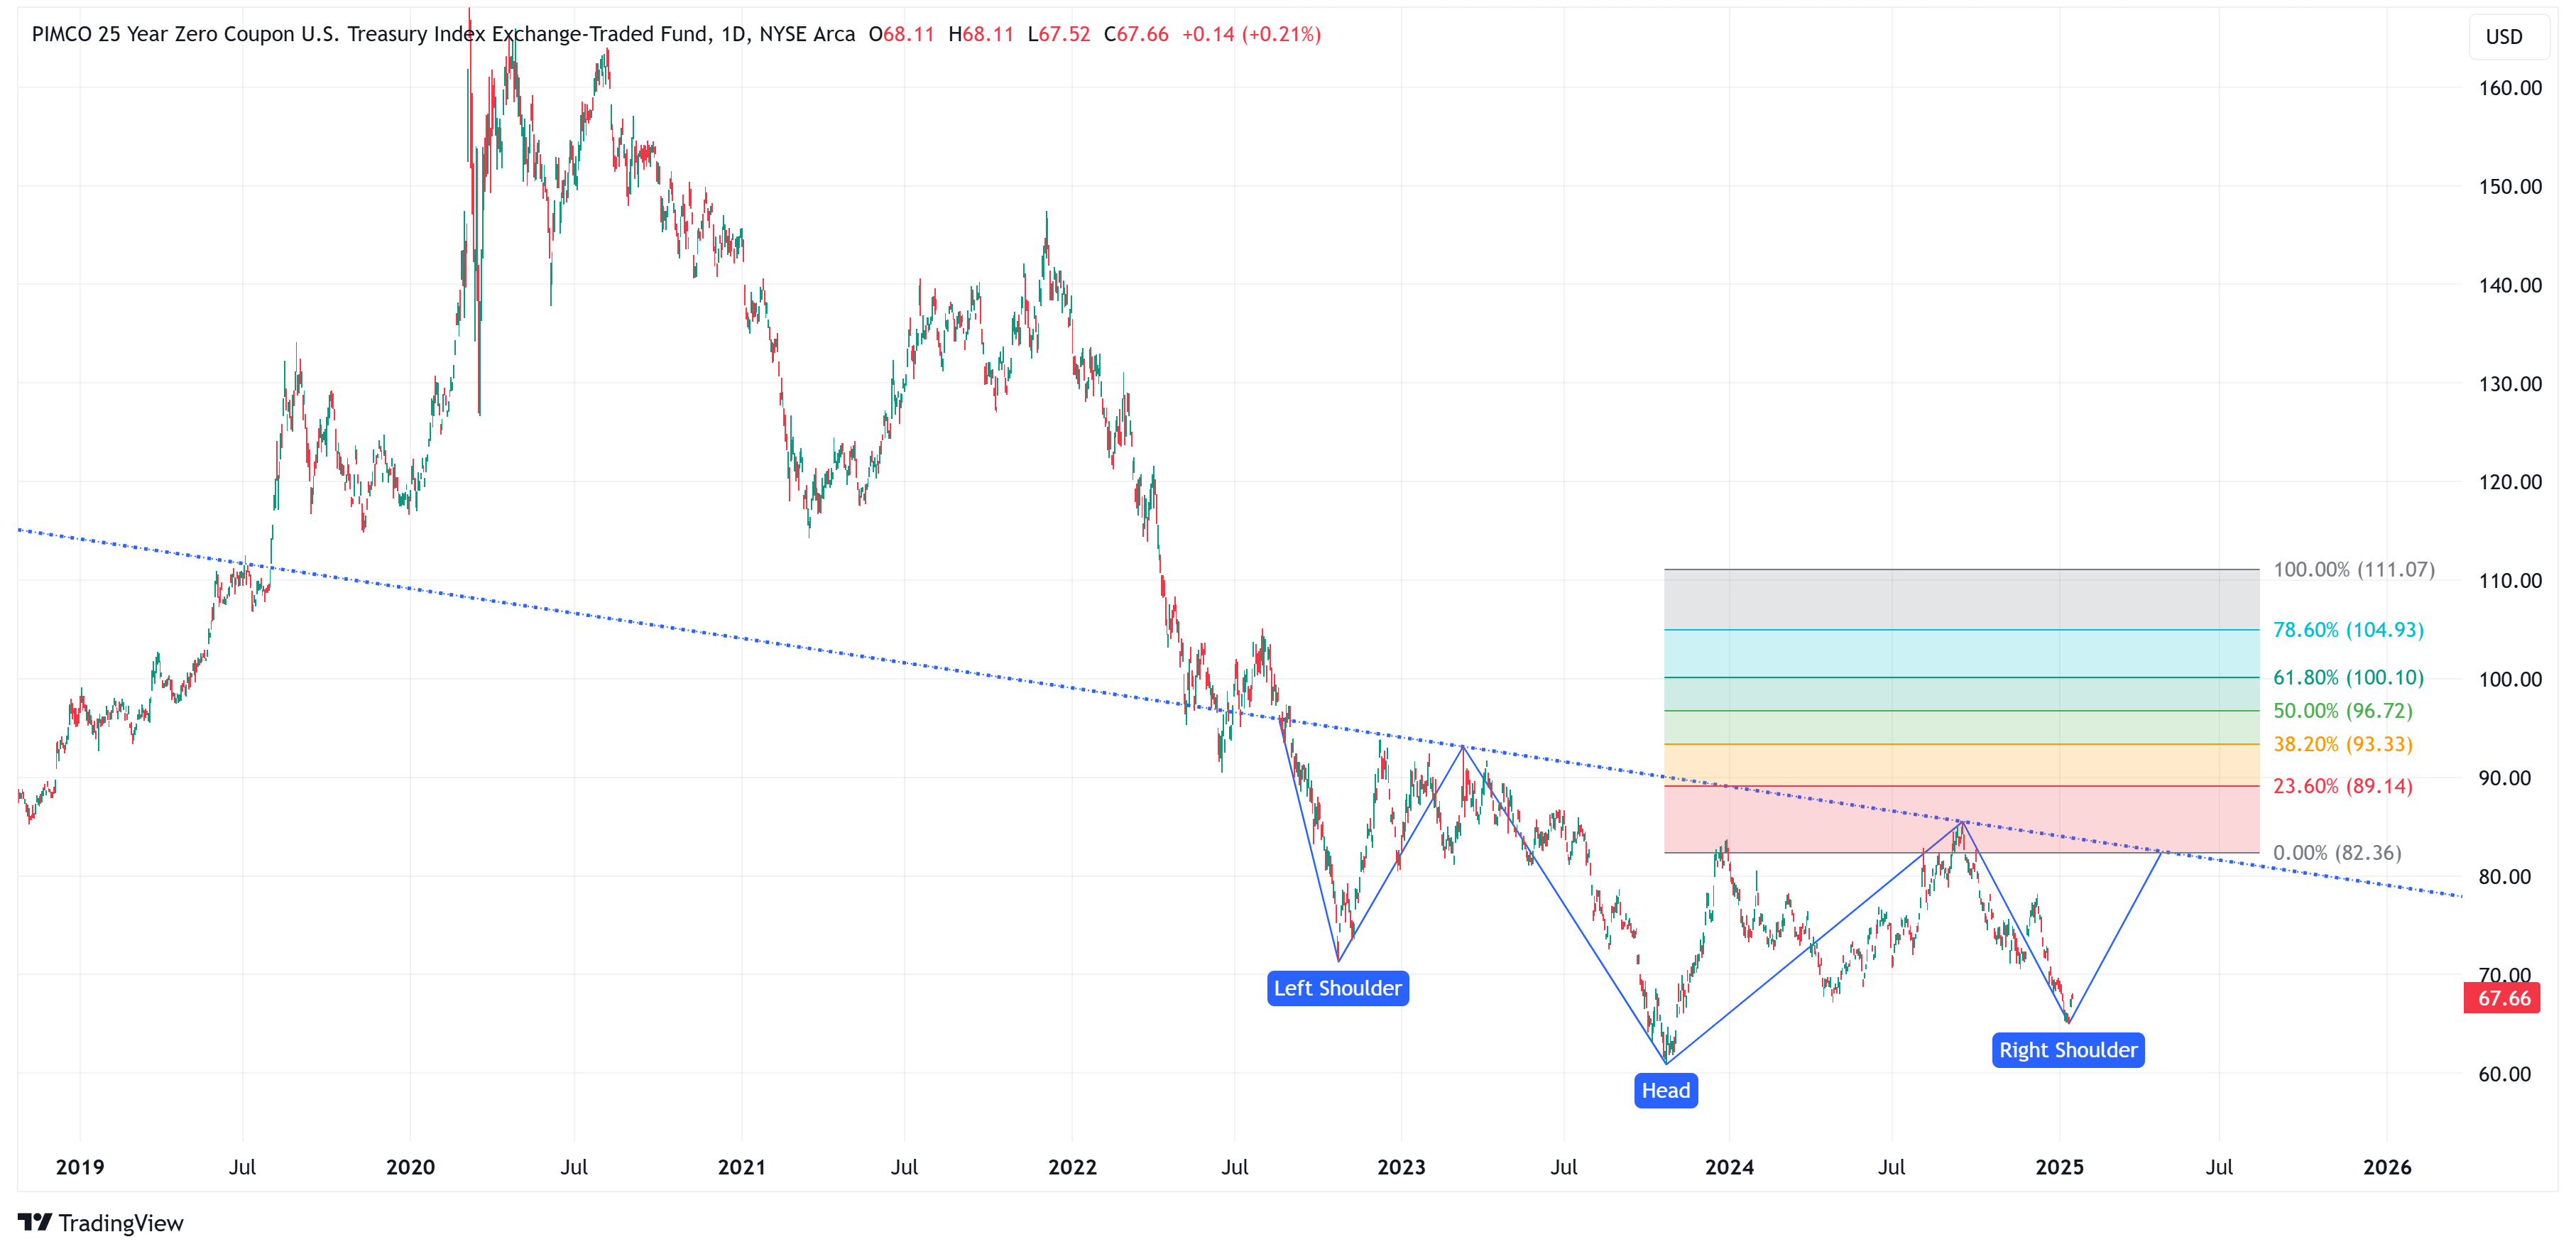
To be abundantly clear, we haven’t seen this turn happen yet so the “right shoulder” of both charts could still move lower but the charts do appear as though an inverse head & shoulder pattern could be in the making (but not confirmed as of yet).
Now, let’s turn our attention to equities.
Keep reading with a 7-day free trial
Subscribe to Skillman Grove Research to keep reading this post and get 7 days of free access to the full post archives.