
Weekly Chart Review
September Seasonality...

Hey everyone, it’s Jim.
I hope you have had a great Labor Day Weekend so far!
Usually, I would send this email out on Tuesday morning after a holiday weekend, but I wanted you to have more time to read this one, and I want to tell you about a special new feature we’re launching for paid customers…
✨ 🚀 Exclusive Benefit for Paid Subscribers 🚀✨
Starting this month, we’re adding a powerful new feature to your Weekly Chart Review subscription: a monthly live webinar!
In these sessions:
We’ll walk step-by-step through our systematic “Market Map” process so you can learn to read the market like a pro.
We’ll have a “Chart Talk” session where we will pull up the charts you request in real-time, apply our analysis, and make a call on where the chart might head next.
We’ll have an “Open Mic” Q&A session where you can ask any questions you have about the market, our “Market Map” process, charts, or anything else.
There is one catch…this is only available to subscribers with an annual paid subscription.
If you don’t have a paid subscription, click on the button below to sign up for our best offer yet, only $99/year.
If you’re already a paid subscriber and would like to join our monthly webinar, please reply to this email and say “Count me in!”.
Once you have been verified as a paid subscriber, you’ll receive additional details about the webinar, how to join, etc.
Note: the webinar is tentatively scheduled for the evening of Tuesday, September 23rd.
I look forward to seeing you at the webinar!
In this week’s newsletter:
📰 Stay Informed
Key Macro Events From Last Week (ICYMI)
Key Macro Events To Watch This Week
🗺️ The Market Map
S&P 500
🔎 Deep Dive
September Seasonality…
📊 S&P 500 Fair Value Model
📈 The Market Map - Extended Analysis
Major US Indices
11 Major US Equity Sectors
US Treasuries
Currencies
Commodities
Fixed Income
📰 Stay Informed
Key Macro Events From Last Week (ICYMI)
Here’s a quick recap of the key data releases from last week:
🏠 New Home Sales (July, released Aug 25)
Sales of new single-family homes fell 0.6% to 652,000 annualized units, below expectations despite a strong June revision.
June’s sales were revised up sharply from 627,000 to 656,000.
Year-over-year, July sales were down 8.2%, signaling continued strain in housing amid elevated mortgage rates.
👉 Read more
🇺🇸 GDP Growth – Q2 Revised (released week of Aug 25)
The U.S. economy’s Q2 growth rate was revised upward to 3.3% annualized, up from the initial 3.0% estimate.
The revision reflects a sharp drop in imports (following an earlier front-loading of inventories) and stronger consumer spending.
👉 Read more
💵 Consumer Spending & PCE Inflation (July)
July consumer spending rose 0.5%, marking the strongest month-over-month gain in four months, led by purchases of vehicles, clothing, and recreational goods.
The headline PCE Price Index increased 0.2% month-over-month, while core PCE inflation rose 0.3%, with the annual core rate reaching 2.9%—its highest since February.
Despite stronger demand, these inflation levels keep markets anchored on expectations for a 25 bps Fed rate cut in September.
👉 Read more
Market Takeaway
The U.S. economy shows a tale of two trends: resilient consumption and GDP growth, contrasted by ongoing housing market stress and sticky core inflation. Together, these dynamics reinforce cautious optimism for a September Fed rate cut as long as labor metrics remain soft.
Key Macro Events To Watch This Week
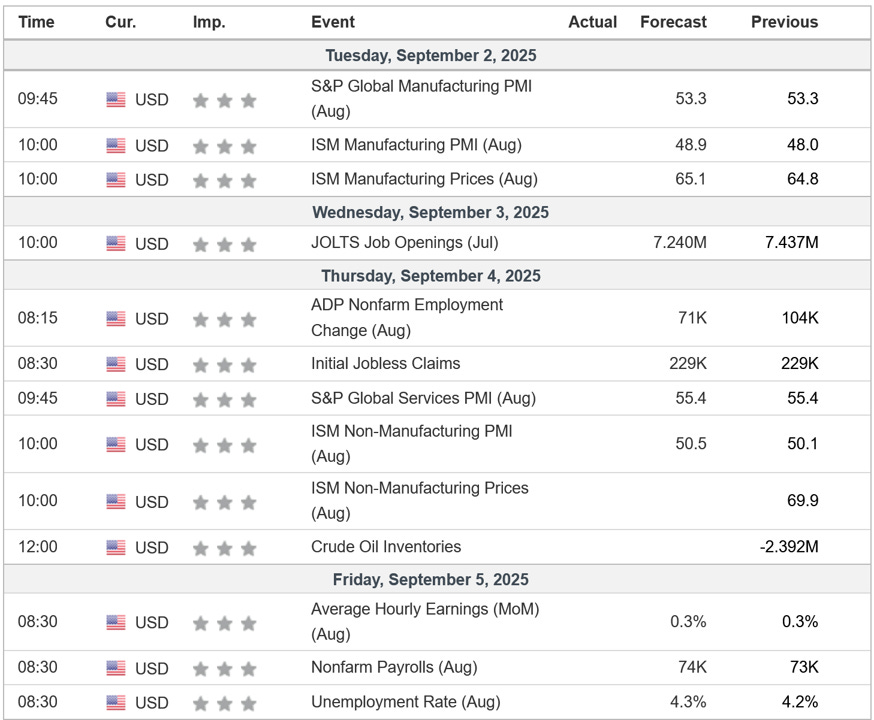
Employment data will be the week’s marquee event—softness would further validate the near-term rate cut narrative.
🗺️ The Market Map - S&P 500
We use this section each week to “Map the Market” using our proprietary, systematic methodology to gauge a) the current trend of the market and b) where the market may be heading over the medium term.
Most of our readers are long-term investors, so we focus on the weekly charts; however, our methodology can be used on any timeframe.
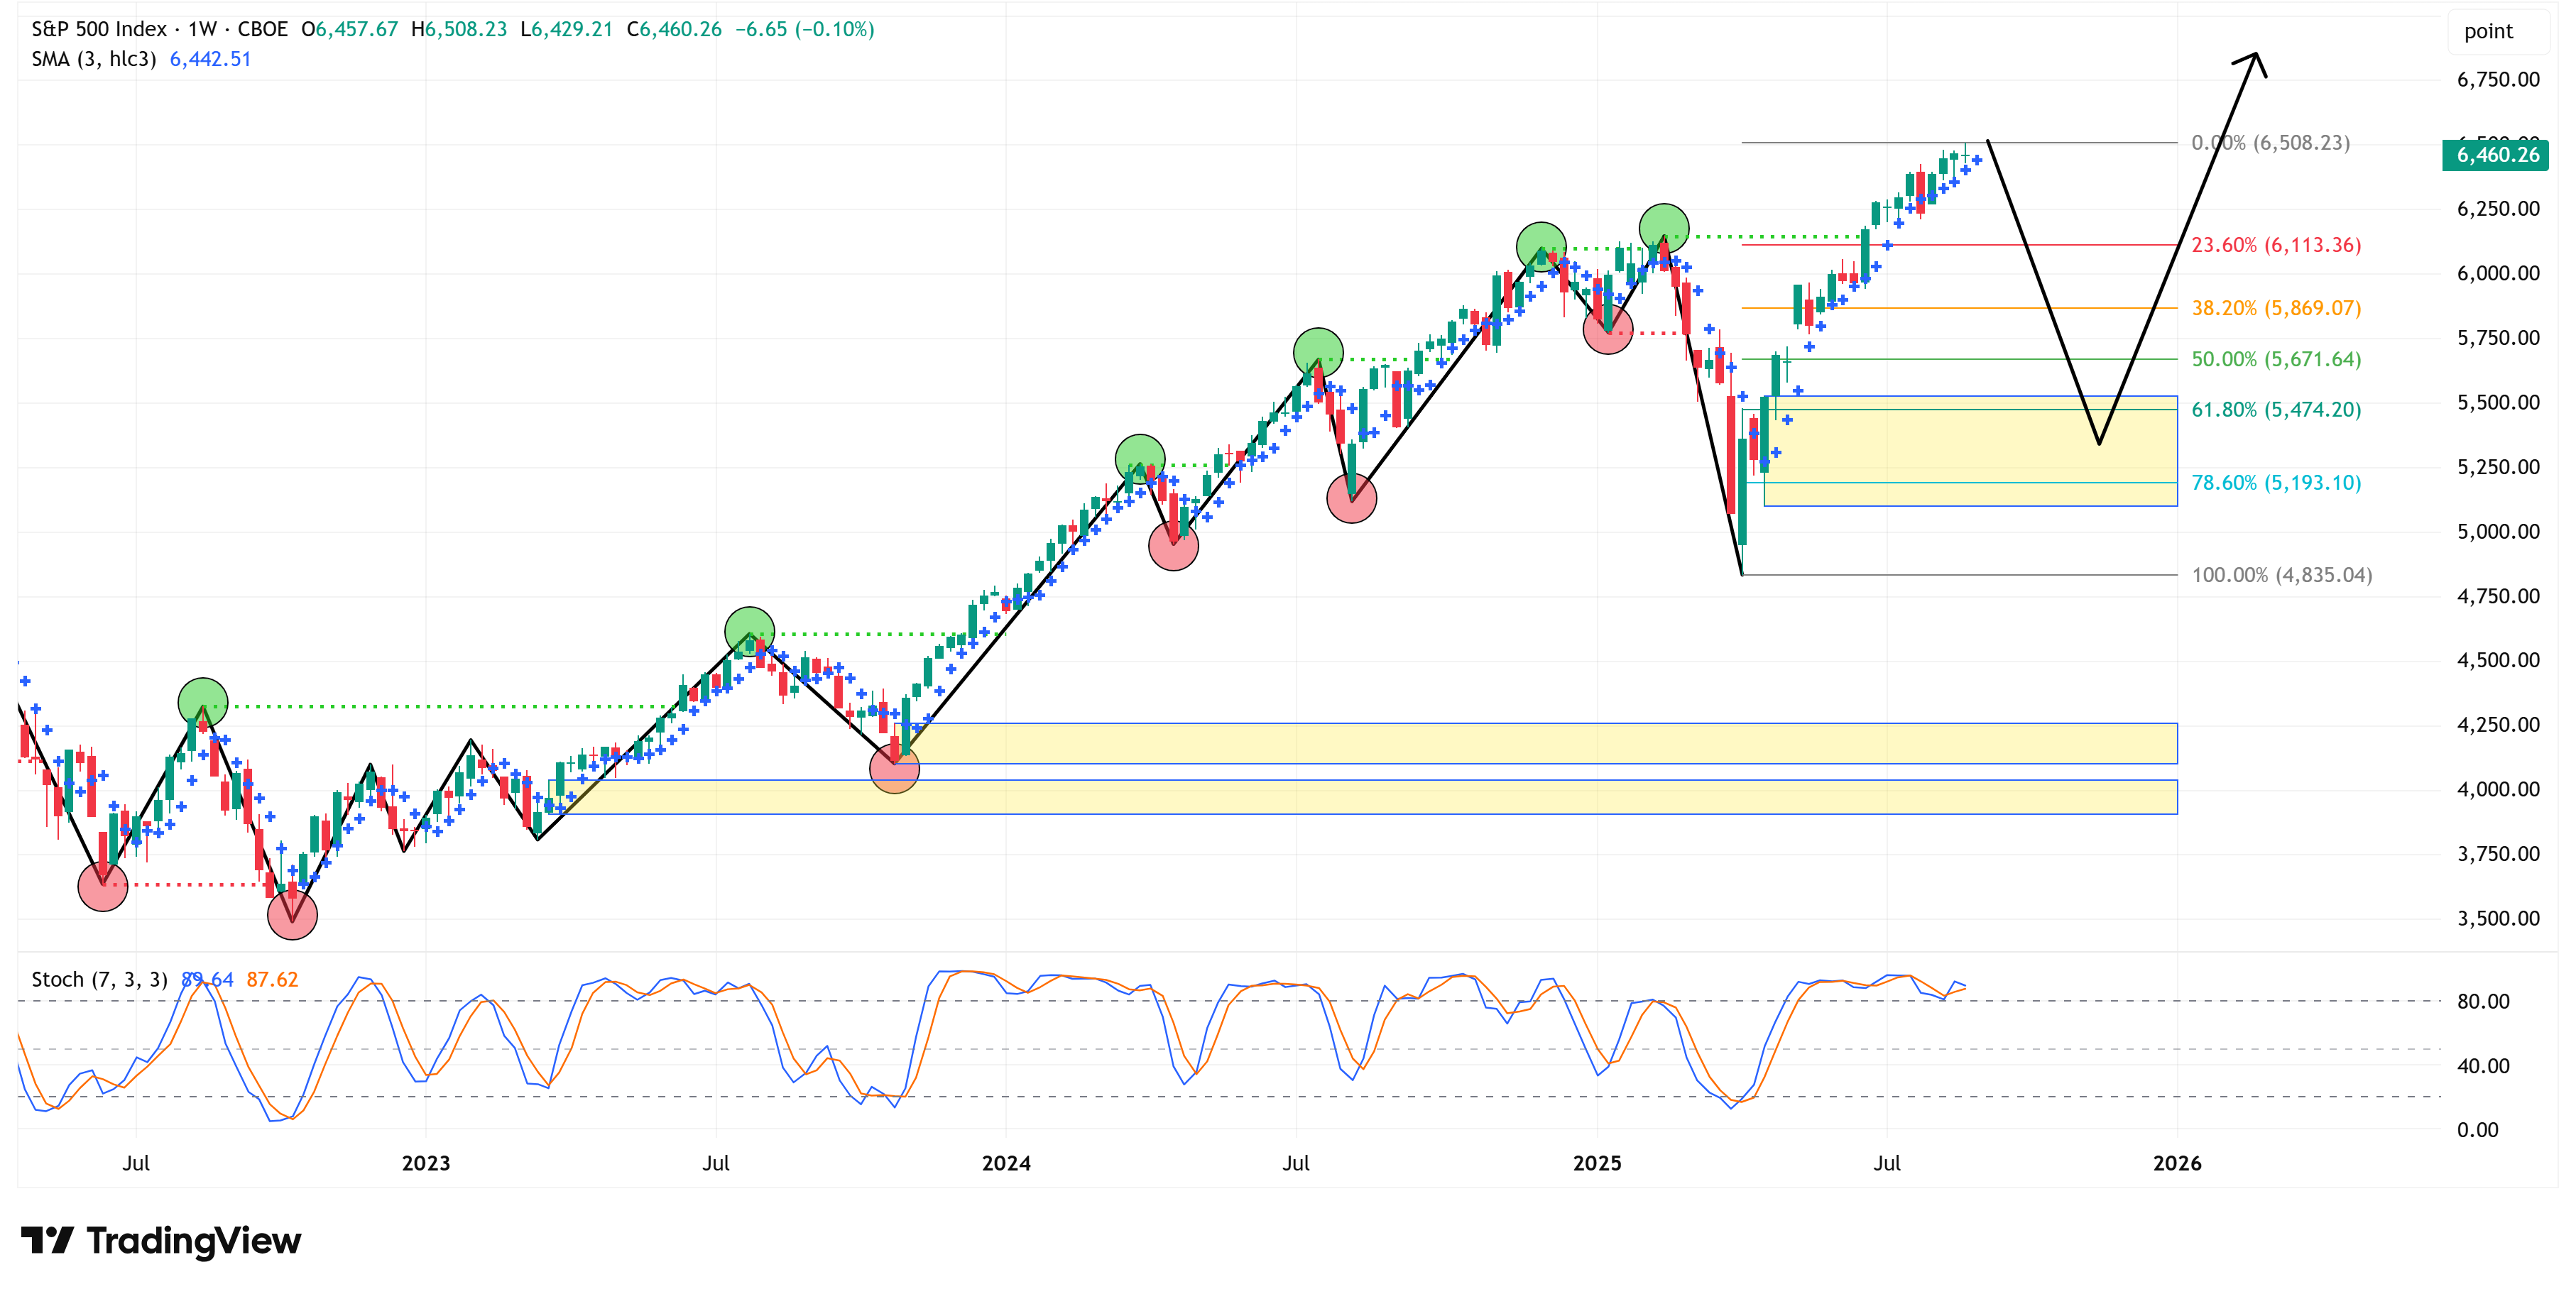
Let’s start by looking at the weekly chart.
The S&P 500 fell by -0.10% last week but remains in an uptrend.
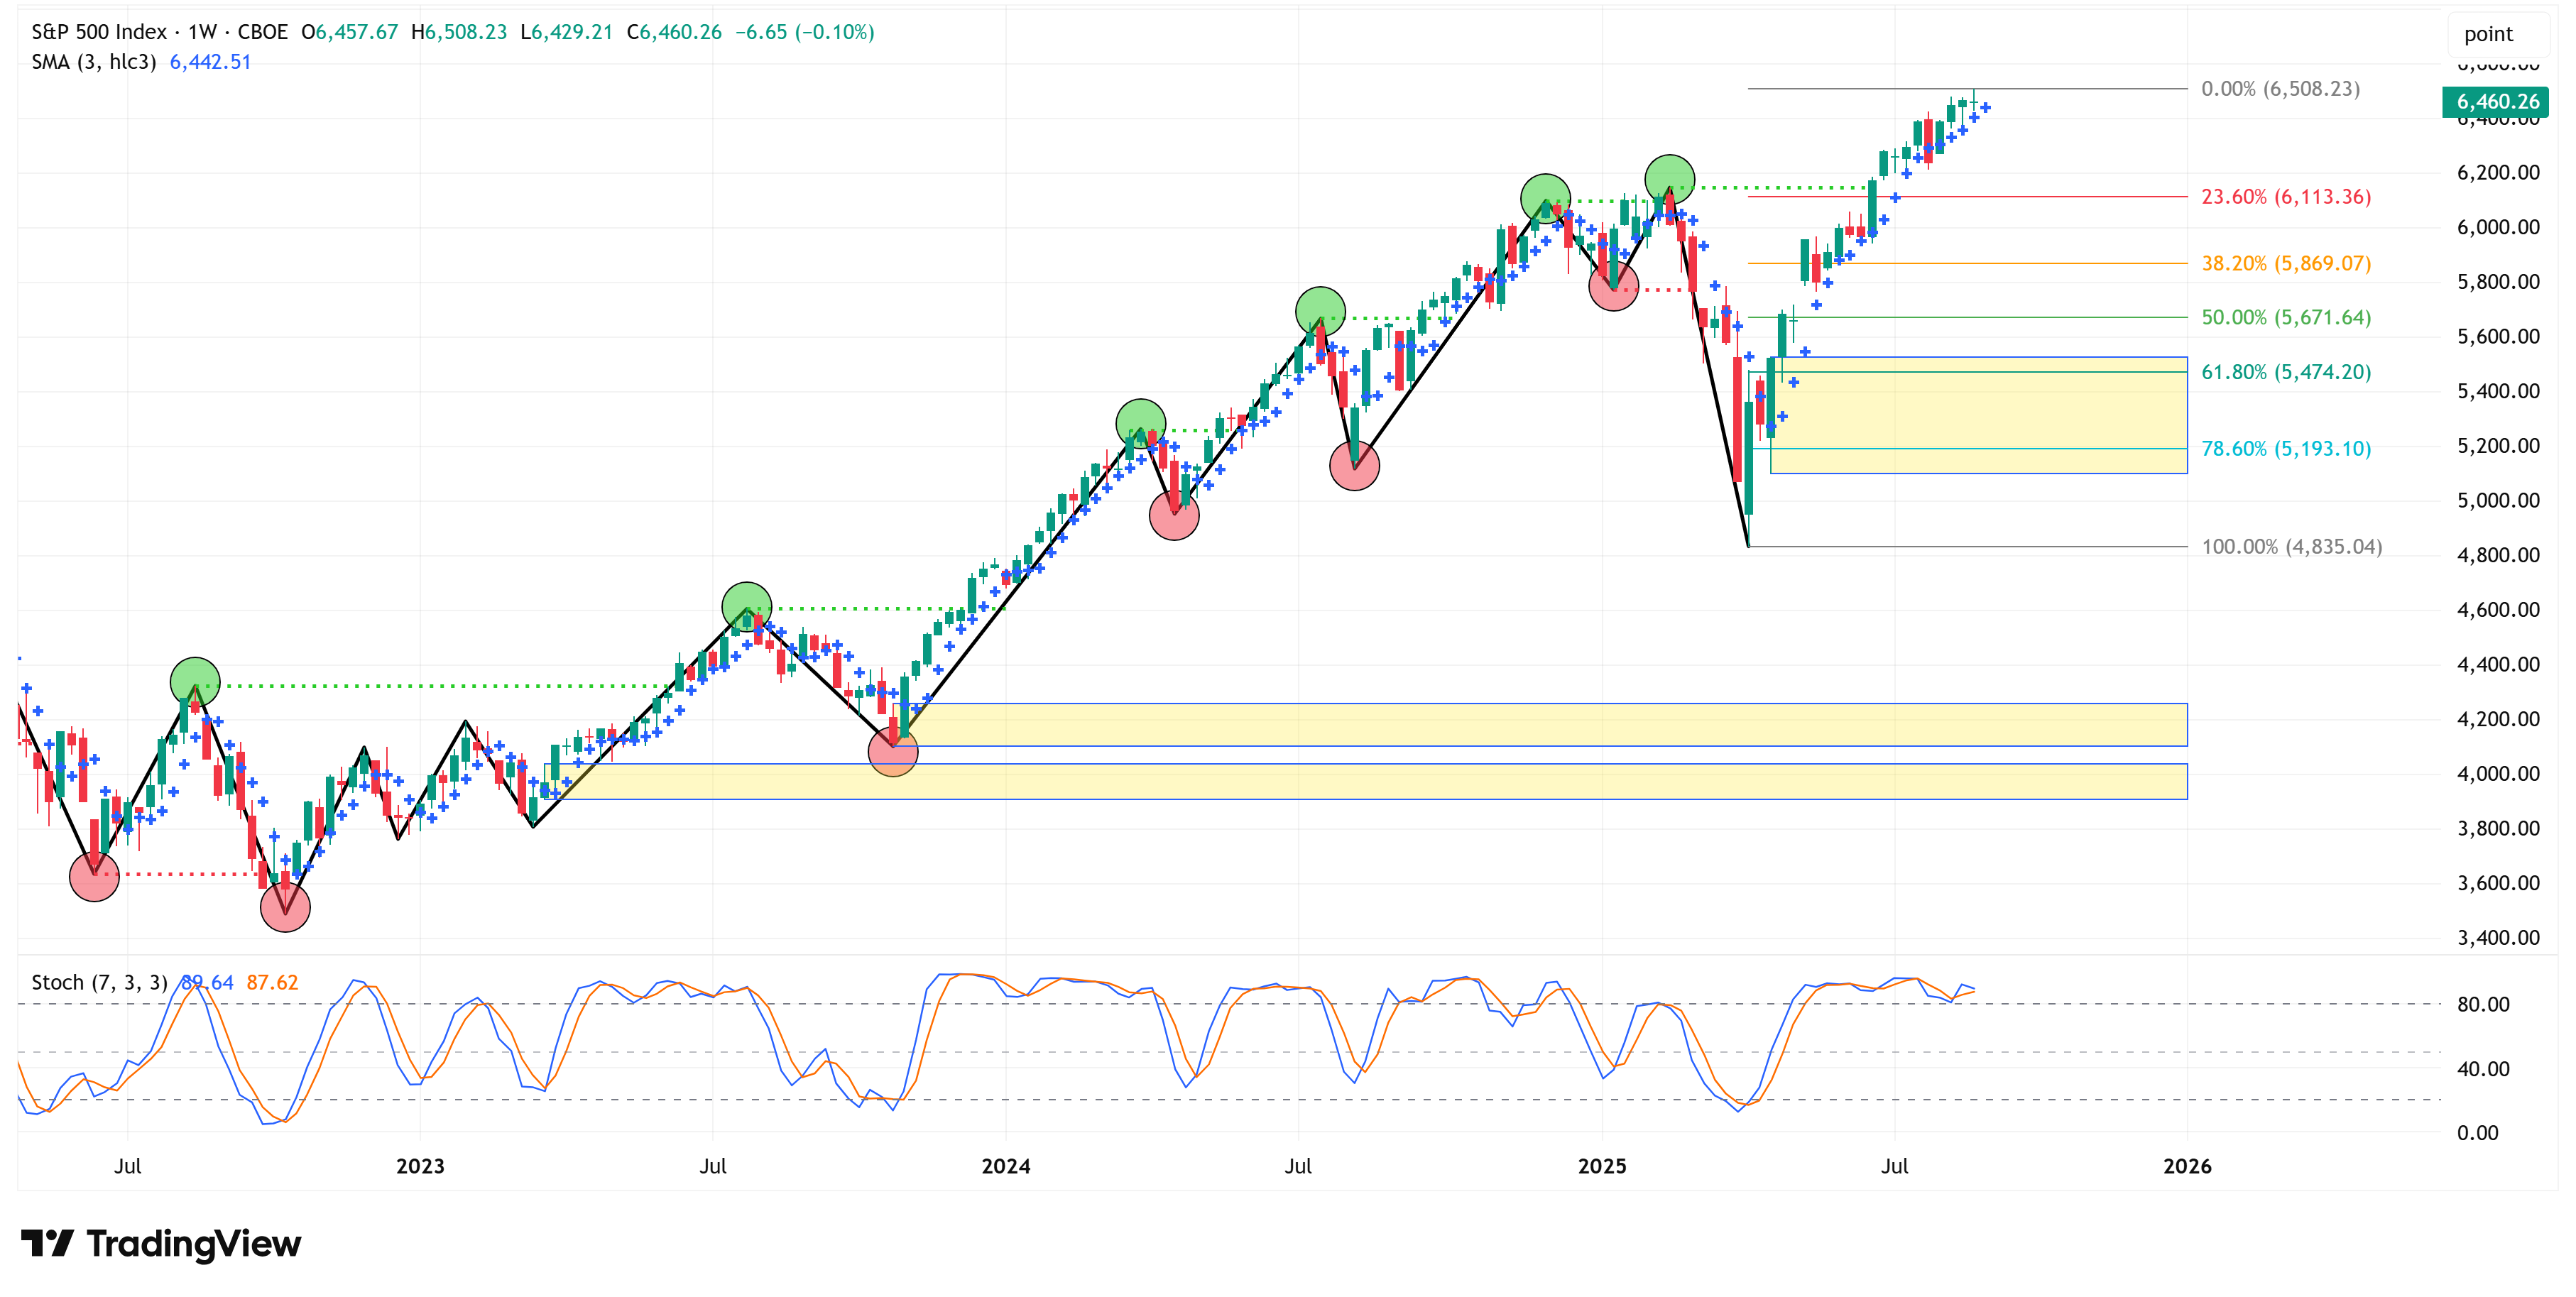
As we’ve discussed numerous times in the past, once the S&P 500 cleared its previous swing high of 6,147.43 from the week ending February 21st, we’ve been on the hunt for signs of a possible pullback.
We expect that at some point, the S&P 500 will likely dip down to “fill the gap” I’ve identified by the yellow box in the chart below.
One possible path the market could take is the black line/arrow that I’ve drawn.
Note: I’m not suggesting that this correction will begin this week, but rather that it will happen at some point, and we will monitor the 4-hour chart to gain insight into when this move may begin.
4-Hour Chart
Shifting gears to the 4-hour chart, we find that not only is the 4-hour chart still bullish, but it also cleared its most recent swing high from August 15th, thus extending its bullish trend.
With the August 15th swing high cleared, we now shift to two new levels of importance:
Swing high = 6,508.23
A close above this level pushes the bullish trend higher.
Swing low = 6,343.86
A close below this level will be the first sign of a possible correction.
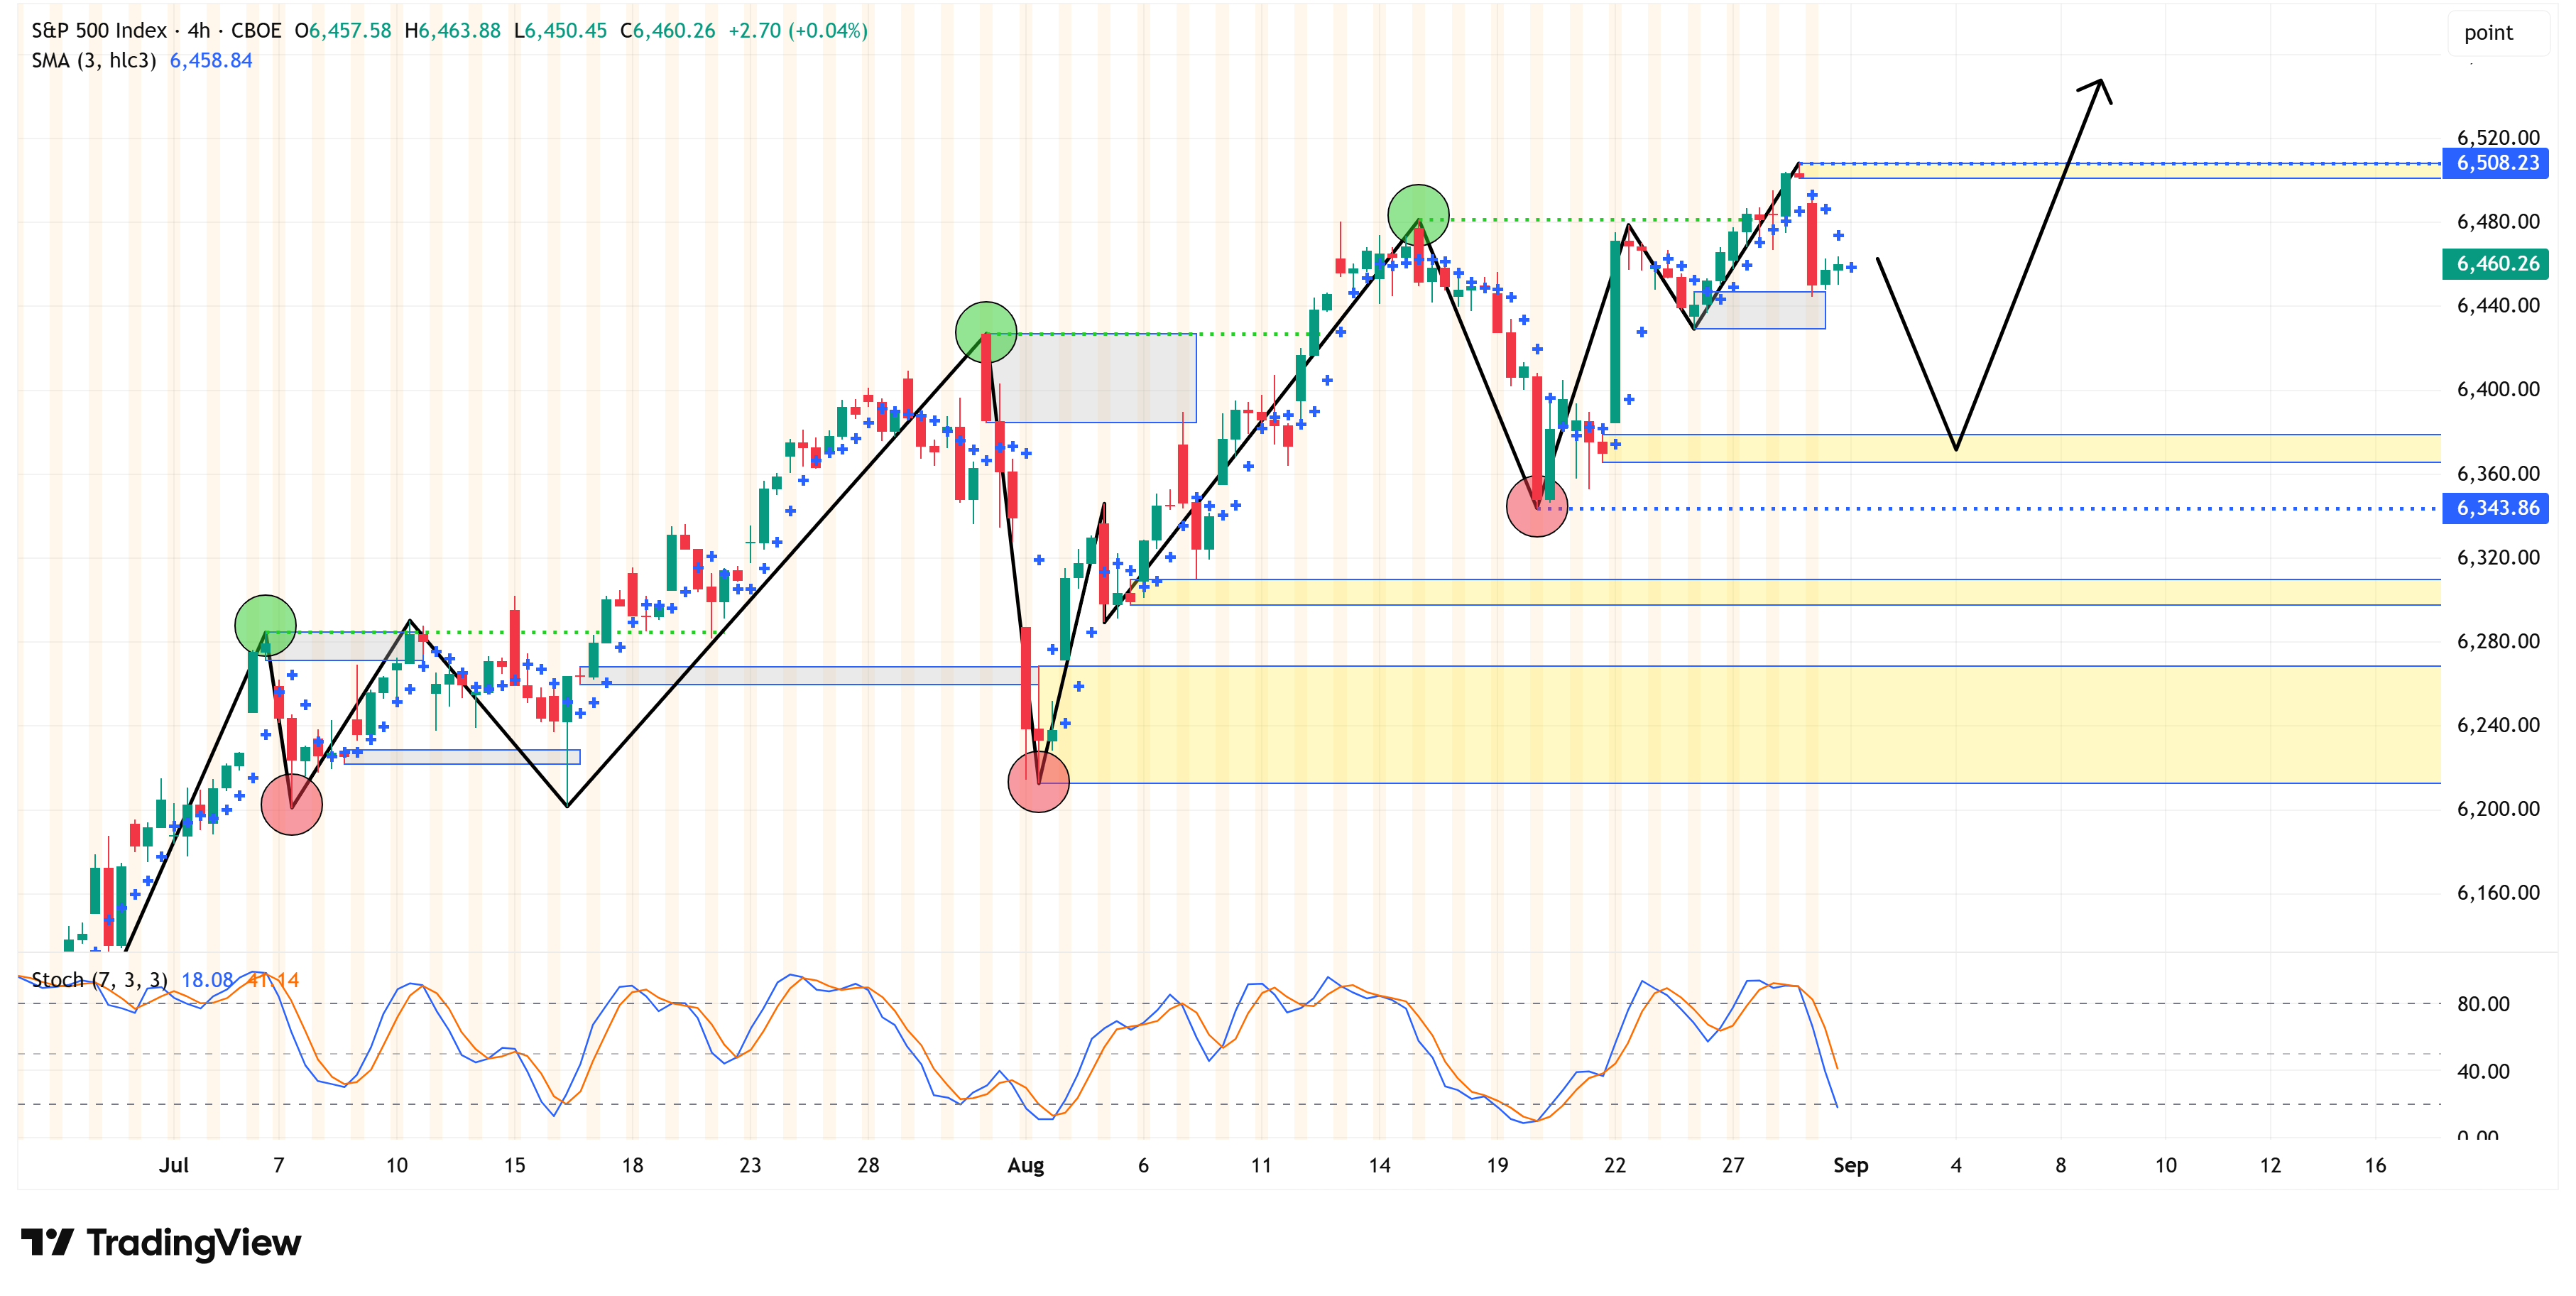
In conclusion, the S&P 500 remains bullish on both the weekly and 4-hour charts.
All else being equal, we should expect a continued move higher over the short-to-medium term unless and until we see the 4-hour trend shift from bullish to bearish.
Deep Dive
September Seasonality…
There’s been a lot of talk over the last week or two about a) how overvalued the market is, and b) how the seasonality of September tends to skew towards the negative side. Put these two together, and you’ve got yourself a nice little recipe for a correction.
A few observations:
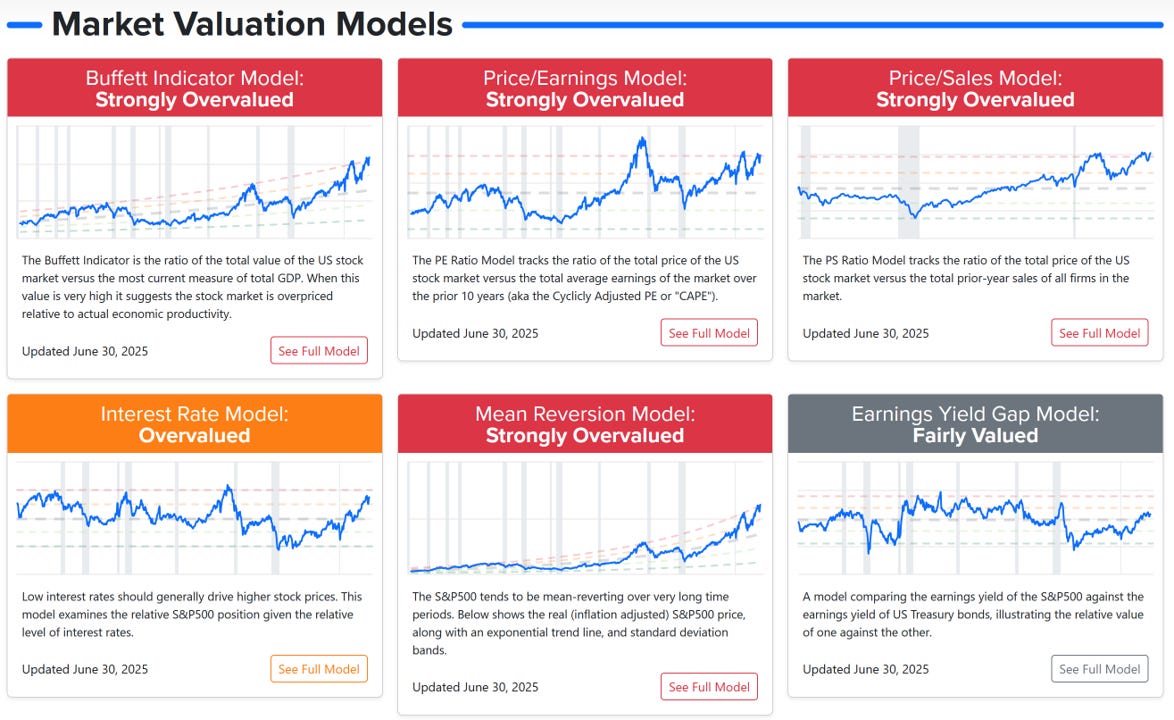
By almost any valuation model, the market is overvalued.
I find the Current Market Valuation website to be a great resource for looking at different valuation models, or you can always look at our proprietary “S&P 500 Fair Value Model” if you scroll down to the paid section of this newsletter.
Here’s a snippet from the Current Market Valuation website…
Despite the current “overvalued” nature of the market, our “Market Map” systematic process continues to suggest that the S&P 500 remains bullish (see above section).
So yes, the market is overvalued, and yes, September seasonality skews negative, but that does not necessarily mean September is going to be a down month.
Here is a seasonality chart of the S&P 500 provided by EquityClock.com.
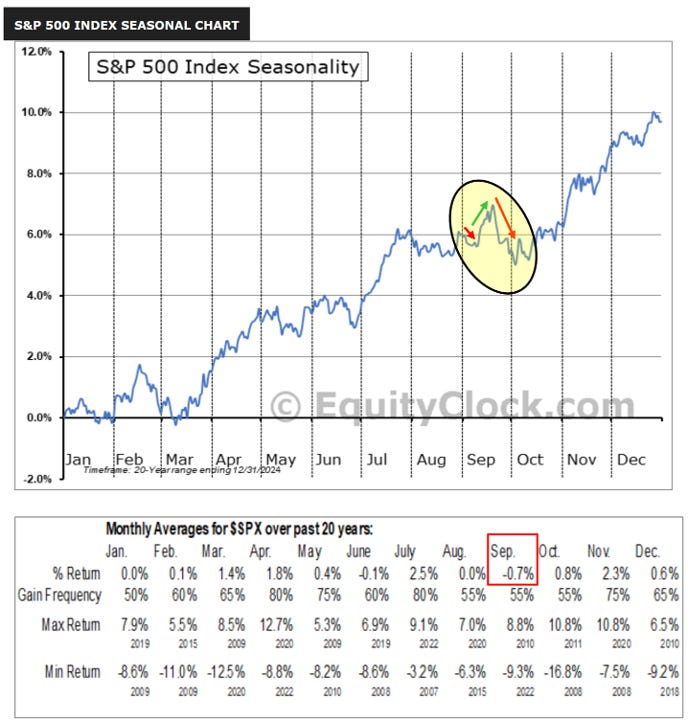
If this September were to follow exactly as historical seasonality would suggest, you could almost make the case for three different months within a month.
If you zoom in closely, you’ll see that the first part of the month “should” decline, which is followed by a ramp higher through mid-month, only to close the month with a steep decline into October.
Will this September play out in a similar manner? Who knows.
My anecdotal observation is that when seasonality trends start to get a lot of attention in the media or online, something else happens.
Conversely, when no one really pays attention to seasonality, we often look back and say, “Yep, we should have expected that, that’s how seasonality tends to play out…”
By this logic, given the attention on September seasonality right now, I would suggest “something else will happen”. That could be positive or negative, but I’d put my money on September not looking like the seasonality chart noted above.
I think the non-farm payrolls number on Friday will be one of the more important non-farm payroll numbers we’ve had in some time.
A weak number definitely gives the Fed the green light to cut rates on September 17th and may even allow them to cut 50 basis points if it is very weak.
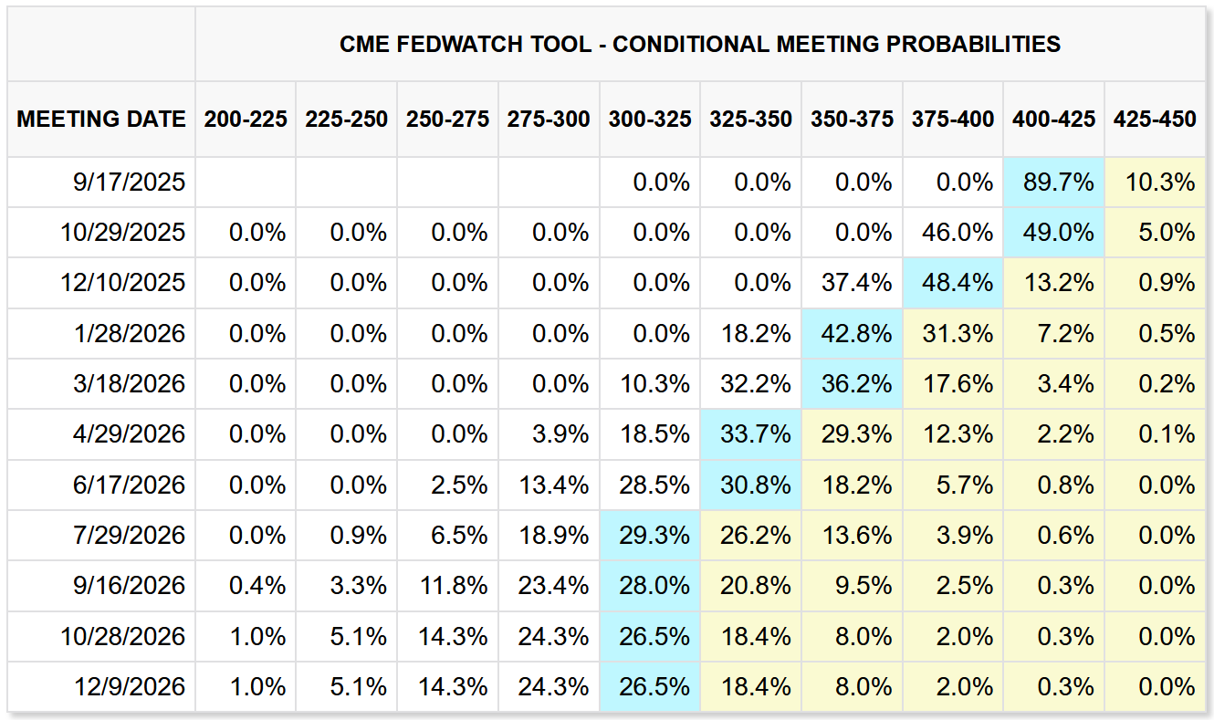
Fed Funds futures are currently pricing in the following probabilities for September:
No cut = 10.3%
25 bps cut = 89.7%
50 bps cut = 0.0%
As a market participant, how do you react to the notion that “the market is weak enough to justify a 25 or 50 basis point cut…”?
Do you believe that a 25 or 50 basis point cut will turn the economy around and “justify” even higher market valuations, thus compelling you to go out and bid up risk assets?
Conversely, what if non-farm payrolls comes in hotter than expected, thus calling into question whether or not we even need a 25 basis point cut, much less a 50 basis point cut.
The market reacted very positively to J. Powell’s speech at Jackson Hole when he effectively suggested a rate cut “may be” coming in September. How does the market react to a strong payroll number that calls this into question?
The third alternative is that the non-farm payrolls number comes in right in line with estimates (i.e., not a shocker to the upside or downside). This is probably the best case scenario for risk assets.
The Fed will use it as an excuse to cut, and they will call it “part of the process of normalizing rates…” and the market will read it as “rates were too high to begin with, now we’re getting closer to ‘normal’ so we can buy risk assets again…”
In closing, September is going to be a very interesting month, which I believe will set the tone for the remainder of the year.
We focused primarily on the non-farm payrolls number in this piece, but another potential monkey wrench will be the inflation figures (PPI and CPI) that are released on September 10th and 11th, respectively.
Remember, the FOMC will see these figures as well before they make their rate decision on September 17th. We’ll talk more about those next week.
The following sections are for paid subscribers only.
In these sections, we will discuss our proprietary:
S&P 500 Fair Value Model
This model provides a guide for:
a) How far the S&P 500 could decline in the next recession.
b) When to get back into the market after it has declined.
The Market Map - Extended Analysis
We will call out specific price objectives (up trends vs. down trends, targets, stop losses, etc.) on the following:
Major US Indices
11 Major US Equity Sectors
US Treasuries
Currencies
Commodities
Fixed Income
If you would like exclusive access to the proprietary data below, be sure to take advantage of our “The Market Map Pro ($99/Year)” special offer!
Keep reading with a 7-day free trial
Subscribe to Skillman Grove Research to keep reading this post and get 7 days of free access to the full post archives.