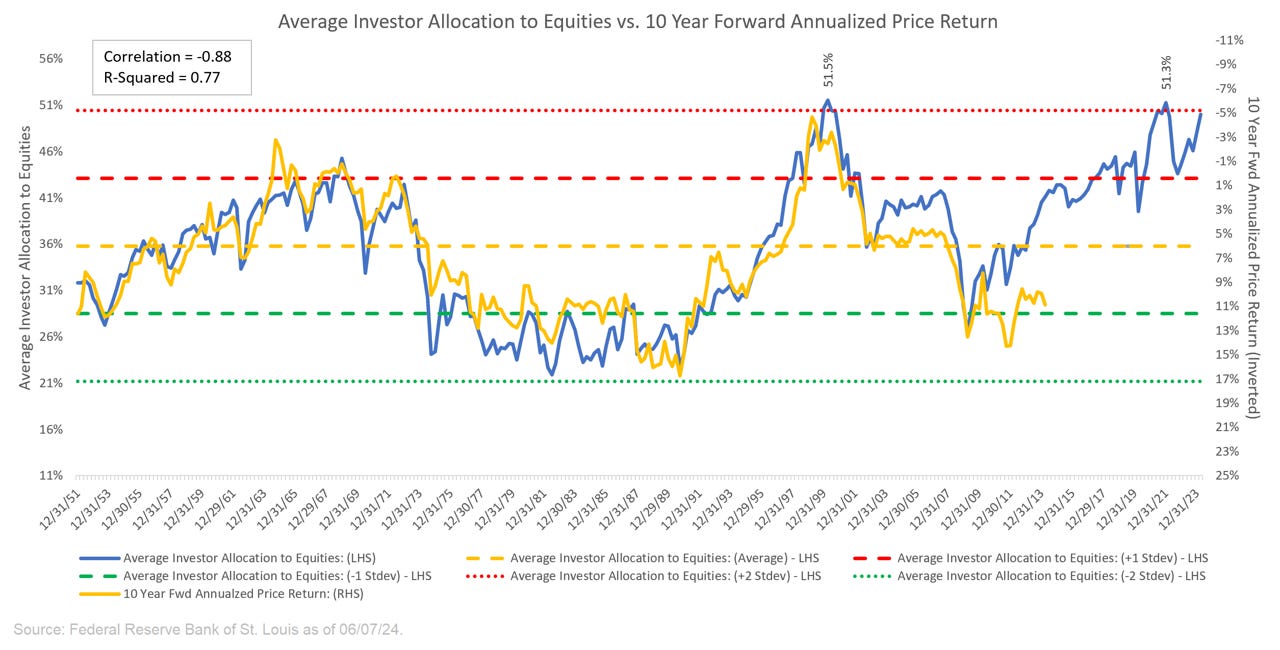
This week we will dive into the quarterly update of my favorite chart, the “Average Investor Allocation to Equities” chart.
As I often say, I consider this to be one of the more important updates that I do periodically given the degree to which the “Average Investor Allocation to Equities” chart has predictive characteristics for the future returns of US equities.
So let’s jump in and see what the chart is telling us and maybe even more importantly, where the chart tells us the market could be heading (spoiler alert: a lot lower) and what to do about it.
Average Investor Allocation to Equities
Let’s start with the chart and then get into the analysis and takeaways.
Keep reading with a 7-day free trial
Subscribe to Skillman Grove Research to keep reading this post and get 7 days of free access to the full post archives.


