Weekly Chart Review
February 27, 2023
This week, we’re going to take another look at the weekly Heikin-Ashi candle charts.
I like using weekly charts because the weekly time frame cuts out a bit of the noise from the daily price movements and the Heikin-Ashi candles are great for establishing trends.
Let’s dive in.
In the first chart, we’re looking at the S&P 500 Index. If you’re a bull, you have to be hoping (praying) that last week’s price action was simply a retest of the prolonged downtrend line and that it will bounce from here.
What looks more likely, is that this is a very similar pattern that we’ve seen repeat itself over-and-over again since the beginning of 2022. One where we see a sustained rally for several weeks only to have it breakdown and move appreciably lower.
You can see this in the chart below as denoted by the blue trendlines. Note that each of these moves was foreshadowed by a rounding top.
Having spent a fair amount of time in the high yield bond market, I tend to subscribe to the belief that high yield bonds lead equities. With that said, note what HYG is showing us. Similar pattern as above except that HYG is on week three of the downtrend.
For good measure, let’s see what our friends in the investment grade market are telling us. Same song.
Last week, we looked at the sector charts relative to the S&P 500 (SPY) and noted that a few of the sectors were holding up relatively well in comparison to SPY. Further, I noted that some of these sectors are the more “defensive” sectors and therefore it makes sense to see them outperforming on a relative basis.
Let’s take a fresh look this week.
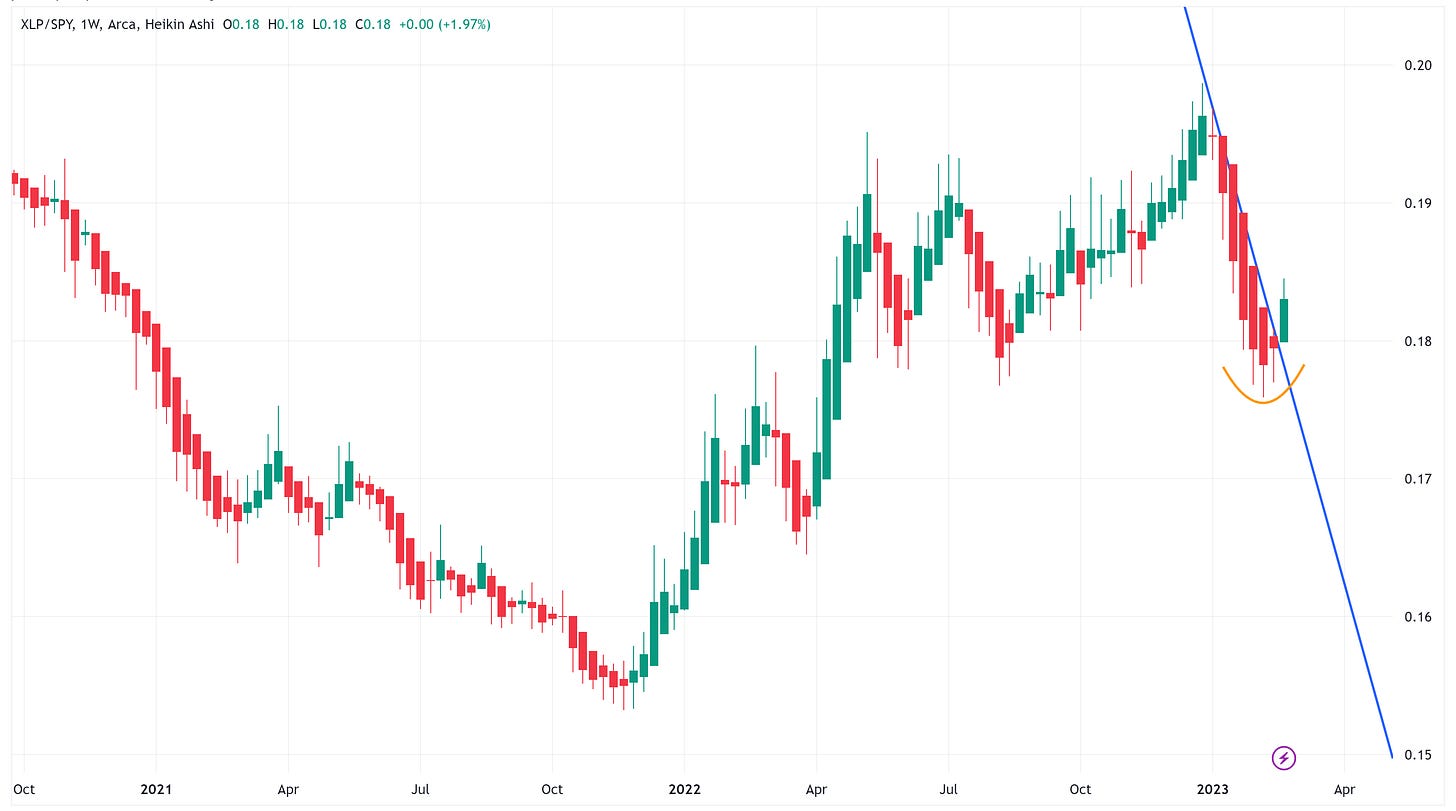
Consumer Staples (XLP/SPY)
Note that Consumer Staples has broken out of its multi-week downtrend, relative to SPY.
Financial (XLF/SPY)
The Financial sector has found support at the blue trendline and appears to be breaking up-and-through the recent down trendline.
Industrial (XLI/SPY)
Industrials are on week two of outperforming relative to SPY after having broken out from the multi-week down trendline.
Utilities (XLU/SPY)
Utilities appear to be reversing course which signifies outperformance relative to SPY. With that said, the most recent candle appears to be a “doji” candle which often suggests indecision. The rounding bottom would suggest that the reversal may have legs but given the “doji”, I wouldn’t trust this move as much as some of the others.
Summary
The above four sectors might prove to be a safe place to hide-out, on a relative basis, if the S&P 500 continues to move lower. A word of caution, if the S&P 500 does begin to move appreciably lower, it’s taking everything (i.e., all sectors) with it so proceed with caution.


