Weekly Chart Review
Although modestly "hot", CPI and PPI, weren't hot enough to convince the FOMC to raise rates this week.
Last week, the Consumer Price Index (CPI) and Producer Price Index (PPI) came in modestly hotter than expected and above last month’s readings.
With that said, the “hot” readings were not enough to shift what the market believes the Federal Reserve will do this week at their FOMC meeting on September 19th - 20th.
You can see in the table below that there is currently a 98% chance that the FOMC will leave rates unchanged at 5.25% - 5.50% at its meeting this week.
Further, as it stands right now, the market believes that the FOMC is on hold through May 2024 before they start cutting rates in June 2024. As I always say, this is subject to change.
I’ve seen several people this week mention the seasonality trends of the S&P 500 during the second half of September and how they tend to be negative.
My observation is that seasonality works until it doesn’t. Sure, what you see below is the historic seasonality pattern, but the minute you make a bet on it playing out exactly as it has in the past, that will be the year it does something different. Just a word of caution.
All else being equal, the most important item of note for the market this week will be the FOMC’s rate decision on Wednesday at 2:00 pm EST and the press conference that follows at 2:30 pm EST.
If the Fed leans dovish, the market will rally; if the Fed leans hawkish, the market will slide lower.
Absolute Value & Relative Value
I noted recently in my Unemployment Rate piece and my Average Investor Allocation to Equities piece that I believe the stage is being set for a potential recession sometime over the next year.
If/when that happens, I believe we could see equities move lower and US Treasuries move higher (i.e., price = higher, yields = lower). The logical conclusion would be that investors would desire to move out of the asset class that is declining in value and into the asset class that is appreciating in value.
In anticipation of this, I am now including “absolute value” charts for different duration US Treasury ETFs and I will also include these ETFs in my chart analysis which follows below.
Absolute Value - Equities
The vast majority of sectors and the S&P 500 continue to be in the upper-right “Expensive & Overbought” quadrant on an absolute basis.
Relative Value - Equities
On a relative basis, as has been the case all year, Communication Services and Technology continue to lead the market this year.
Note that Energy is now creeping into the “Expensive & Overbought” quadrant. I believe Energy still has some room to run but it has moved a long way over the last couple of months.
Absolute Value - US Treasuries
Note that most of the US Treasury curve is firmly in the “Cheap & Oversold” quadrant, especially the longer-duration products like ZROZ and TLT.
Sector & US Treasury Review
As always, let’s start with the S&P 500 and then work our way through the sectors.
I’ll follow this with a review of the different US Treasury ETFs which represent different duration buckets for US Treasuries.
S&P 500 Index
In the image above, I am using a weekly time frame (as I typically do for this section of the report) which shows that the S&P 500 is below its trailing stop loss which is a net negative.
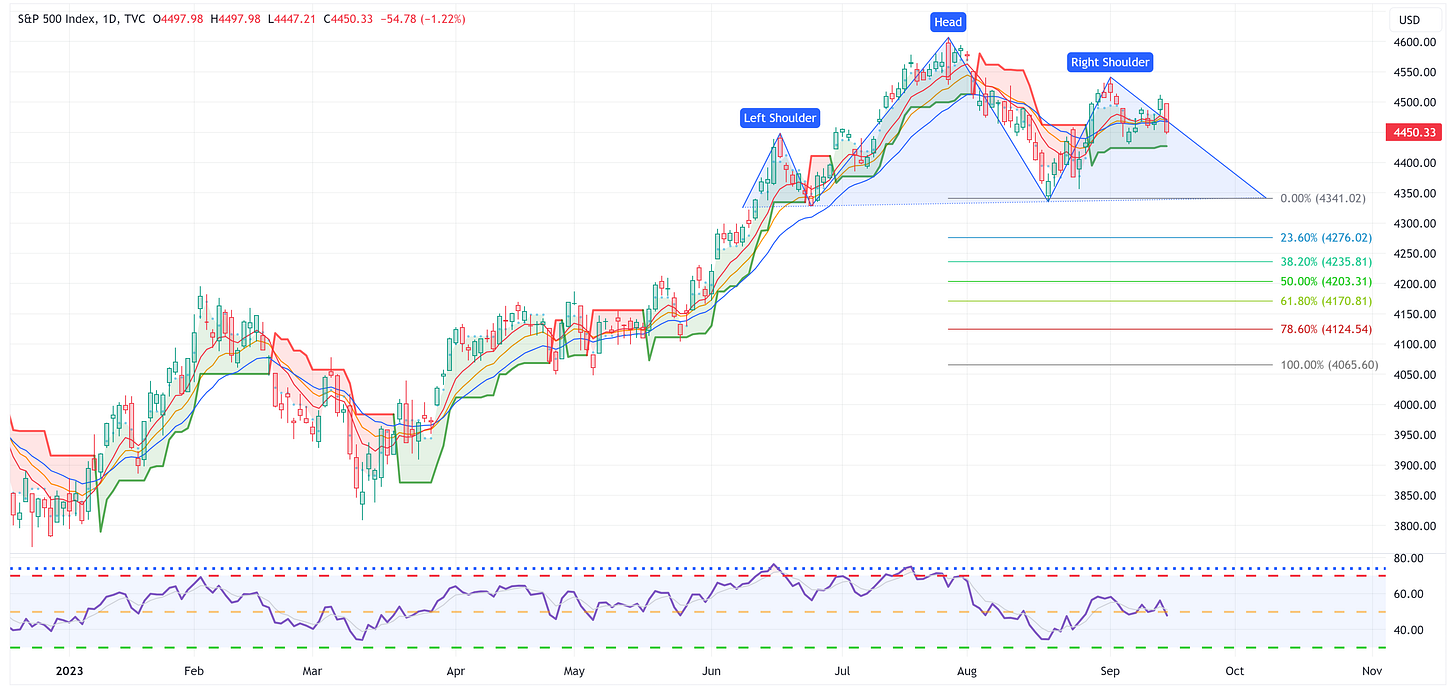
In the image below, I am using a daily time frame. I did this to point out that it appears that the S&P 500 is in the process (though not complete) of creating the “right shoulder” of a Head & Shoulders pattern. Should this complete itself, and subsequently decline below the neckline, the price target becomes 4,065.
Technology
Technology had the worst week of all the sectors last week with a decline of -2.25%. Note that XLK is below the trailing stop loss and did not find support at the 8 EMA or the 13 EMA. I think you have to be biased lower until proven otherwise.
Communication Services
XLC continues to march higher and remains above the trailing stop loss. Watch for resistance at 69.01 but if it can break above that, I believe the current target of 74.80 remains in play.
Consumer Discretionary
Great week for XLY at +1.80% but I don’t like that it got rejected at the high from last year (174.76) and that it has a gap between 171.18 - 171.79. I believe XLY has to fill this gap before moving definitively higher and watch for 174.76 and 177.92 to provide resistance on the way to the target of 196.55.
Industrials
Although XLI remains above its trailing stop loss, it looks/feels like we’re starting to form a rounding top. Let’s see if it can hold the trailing stop loss in the weeks to come but I probably wouldn’t get long again until it can clear the most recent high from a few weeks ago.
Materials
Very similar picture to XLI, I’m not overly enthusiastic about this chart right now until it can clear the high from a few weeks ago.
Energy
After a multi-week run, XLE took a little breather last week. Not overly unexpected given the run of late. It remains above the trailing stop loss, it has multiple layers of moving average support below the current price; therefore, the target remains 111.94.
Financials
XLF is one of the charts that has puzzled me of late. The best I can tell you is that it may be forming a triangle pattern but even that is not super clean. Either way, to make a definitive move one way or another, it has to clear one of the blue trend lines I’ve drawn.
Real Estate
XLRE continues to be the “Little Engine That Could”. It is going to wait until the absolute last minute to break one way or the other from this symmetrical triangle pattern. Your guess is as good as mine as to which way it breaks, but I think this has to resolve itself one way or the other within the next 2 - 3 weeks.
Consumer Staples
XLP is another chart that has plagued me. Intuitively, if we are late cycle, I would think that it should be doing better. Watch for a bounce off the lower side of this triangle pattern this week. If not, it’s probably heading to 67.91.
Utilities
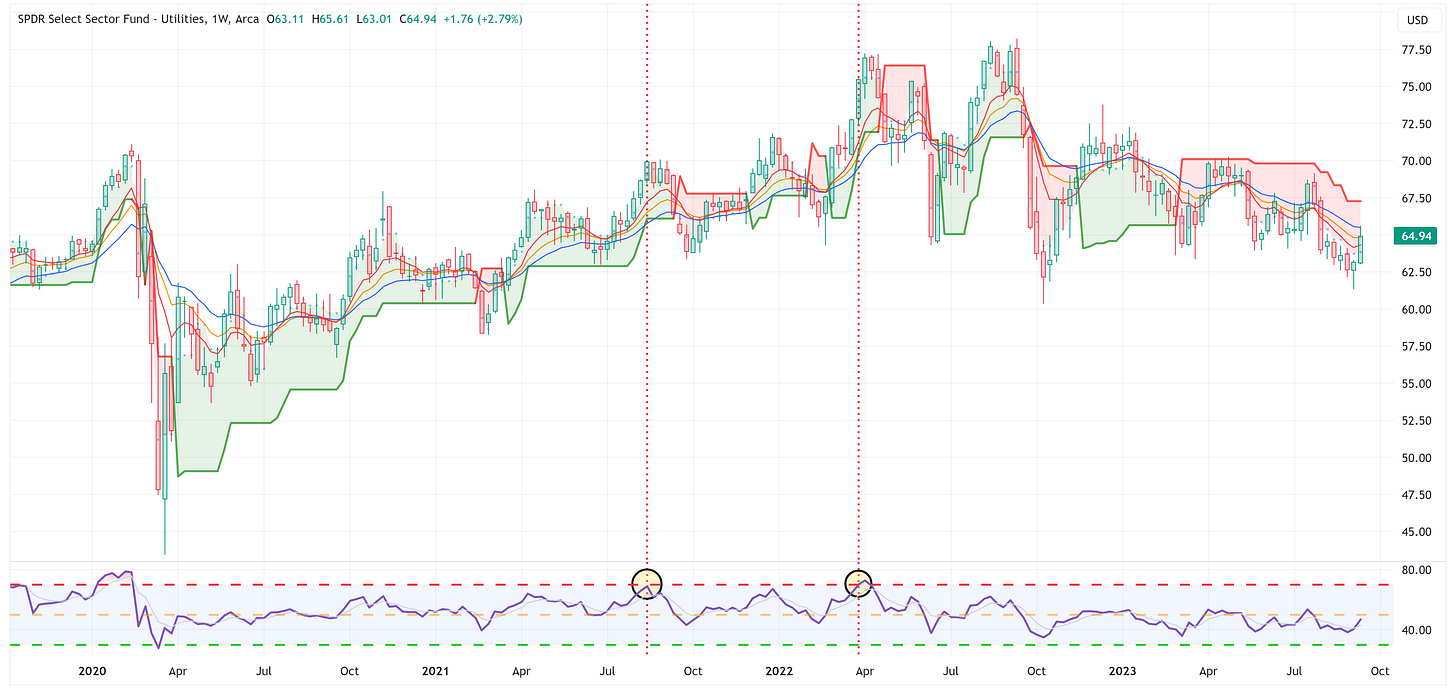
XLU was the single best-performing sector last week with a return of +2.79%. This seems noteworthy, especially after weeks of declines. A move like this is suggestive of late-cycle activity but one week does not a trend make.
Health Care
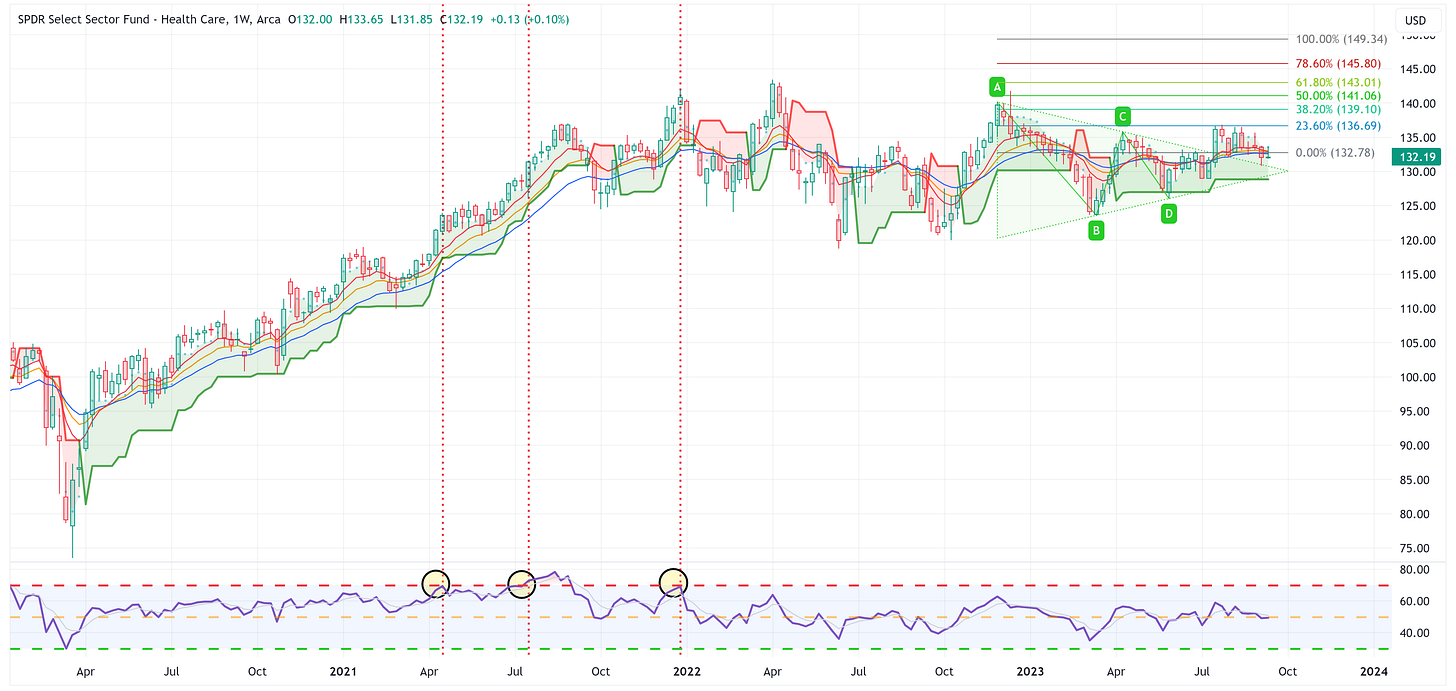
XLV has been rangebound between 132.78 - 136.69 of late. Last week was a positive week but not enough to inspire me that it is going to make a big move higher. If we are late cycle, Heath Care should perform better. File this in the “wait and see” category.
ZROZ: 25+ Year UST
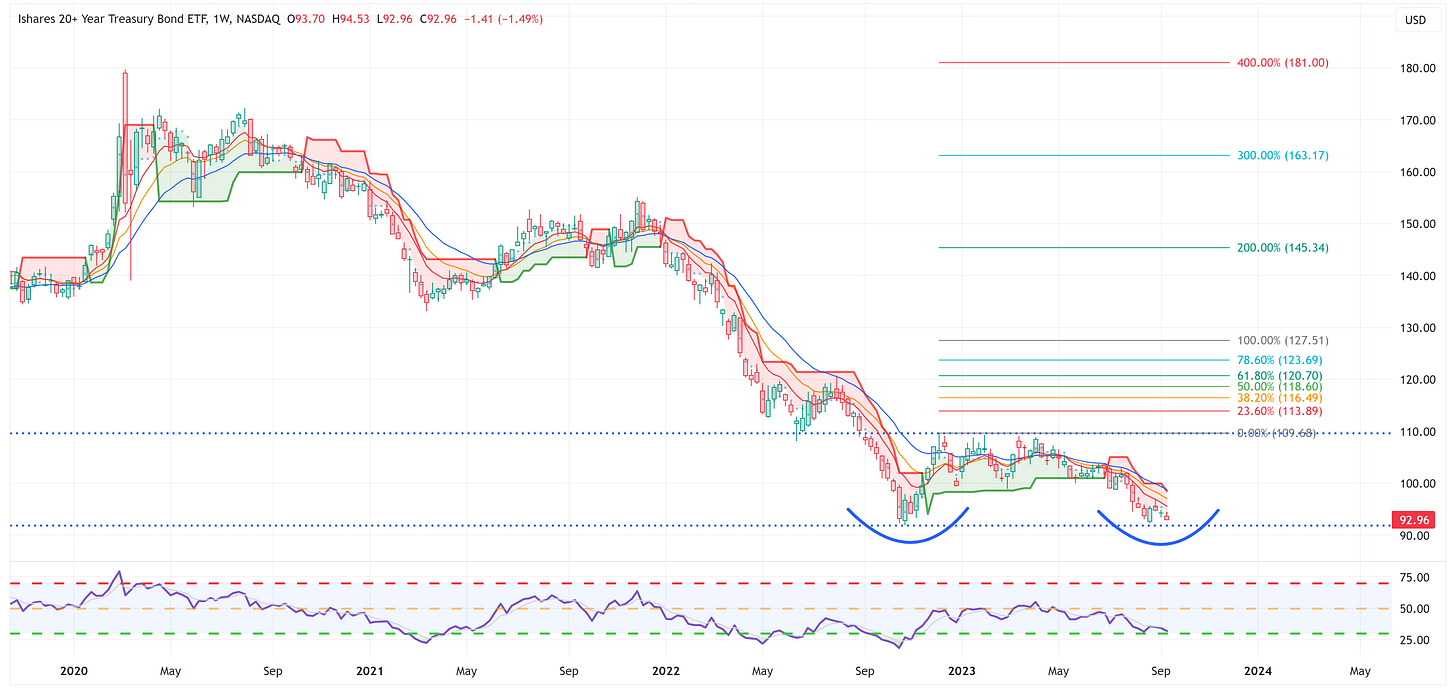
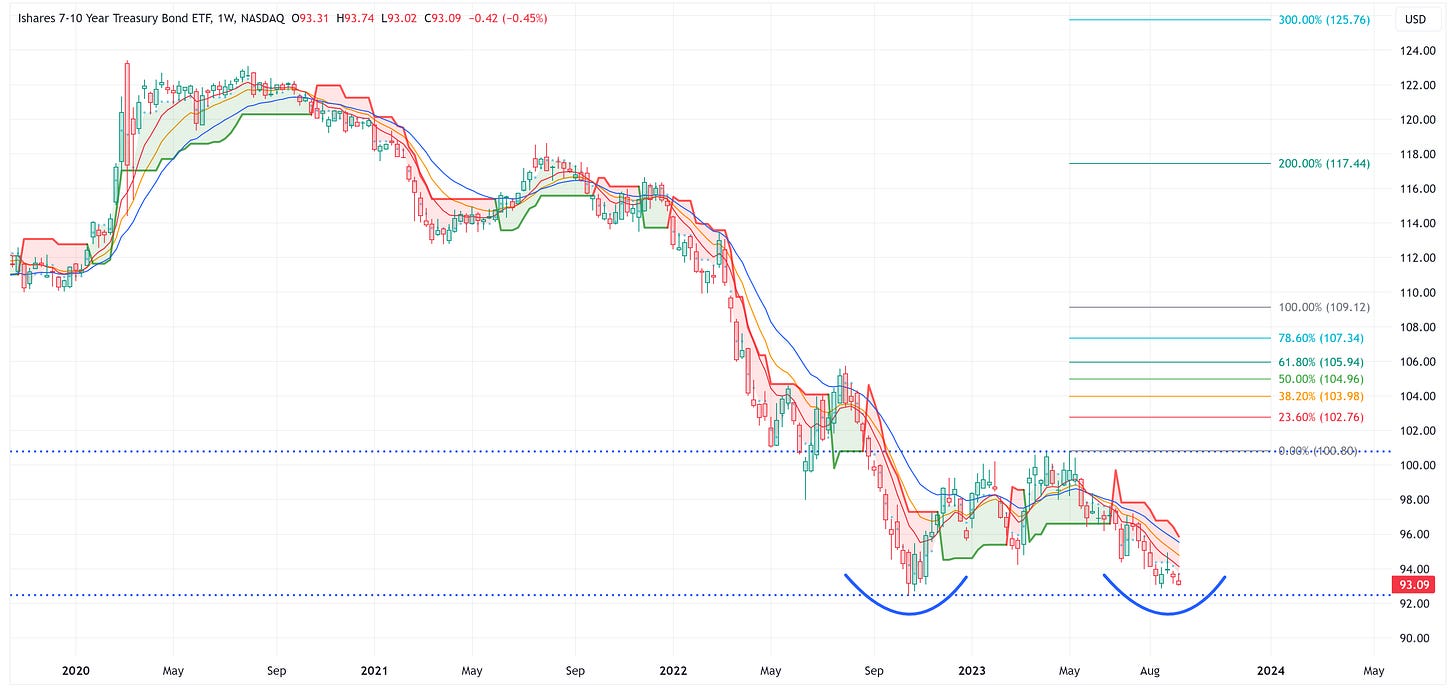
ZROZ could be in the process of forming a double-bottom. We’ll know more if/when it crosses up and through 101.11. To get involved here would be aggressive but recall from the absolute value charts above that it is deeply oversold at current levels.
TLT: 20+ Year UST
Same story for TLT but 109.68 is the important level.
TLH: 10 - 20 Year UST
Same story for TLH but 116.93 is the important level.
IEF: 7 - 10 Year UST
Same story for IEF but 100.80 is the important level.
IEI: 3 - 7 Year UST
Here is where the narrative shifts. IEI and SHY look to be forming Head & Shoulders patterns which suggest a possible move lower from current levels. This tells me that the market is not completely convinced that the Fed is done hiking rates. That doesn’t mean the FOMC will raise rates this week, in fact, I don’t think they will but IEF and SHY look poised to potentially move lower which would be suggestive of a move higher in rates at the short end of the curve at some point in the not-too-distant future.
Compare this with the longer end of the curve that is biased toward higher ETF values (i.e., lower US Treasury yields).
SHY: 1 - 3 Year UST
See the above comments for IEI.
Average Investor Allocation to Equities - Daily Chart Model
I will conclude this week with a snapshot of the daily version of my “Average Investor Allocation to Equities” model.
How to use this chart.
The blue line is the S&P 500.
The red line is my “fair value” model for the S&P 500.
“Current Value to Fair Value” is the amount the S&P 500 would “need” to decline from its current level to the “fair value” level.
“Current Z-Score Value” is a representation (in standard deviation terms) of the delta between the current price of the S&P 500 and the “fair value” price. Historically, major corrections do not end until the Z-Score falls to somewhere between -3.0 & -4.0.
Until next week…


