Happy Monday!
We will start, as usual, with a look at our “Absolute Value” charts. You’ll notice that all but two sectors are in the top-right “Expensive & Overbought” quadrant.
Further, three sectors (Technology, Communication Services, and Consumer Discretionary) and the S&P 500 exceed 2.0 standard deviations.
As I have said for weeks, any time you move beyond the 2.0 standard deviation threshold, your antenna should be up for a possible pullback or a consolidating move sideways. Thus far, that has not happened, but the further we go, the more likely it becomes.
Turning now to our “Relative Value” charts. Here again, it continues to be the Technology show as it has been for weeks.
I will be the first to admit that the Technology run this year has been impressive and at times looks very similar to the 1999-2000 era.
In the chart below, I am showing a monthly chart of the Technology sector relative to the S&P 500 (XLK vs. SPY).
A couple of observations:
Note the blue arrow pointing to the left as it shows where we are today relative to the 1999-2000 era. By this measure, Technology could have one final push before exhausting this run if the 1999-2000 comparison continues to play out.
I have included the relative strength index (RSI) in the lower panel of the chart. Values of 70 or greater tend to be followed by consolidating moves sideways or a corrective move lower. It is certainly possible to extend well beyond 70, and we’ve seen that on a couple of occasions; however, we’ve seen many more occasions where 70 tended to put a cap on the move higher, at least temporarily. For context, the current value for the RSI is 70.32.
The Charts
Let’s take a quick spin through the sector charts and see if we can glean any additional insight.
Technology
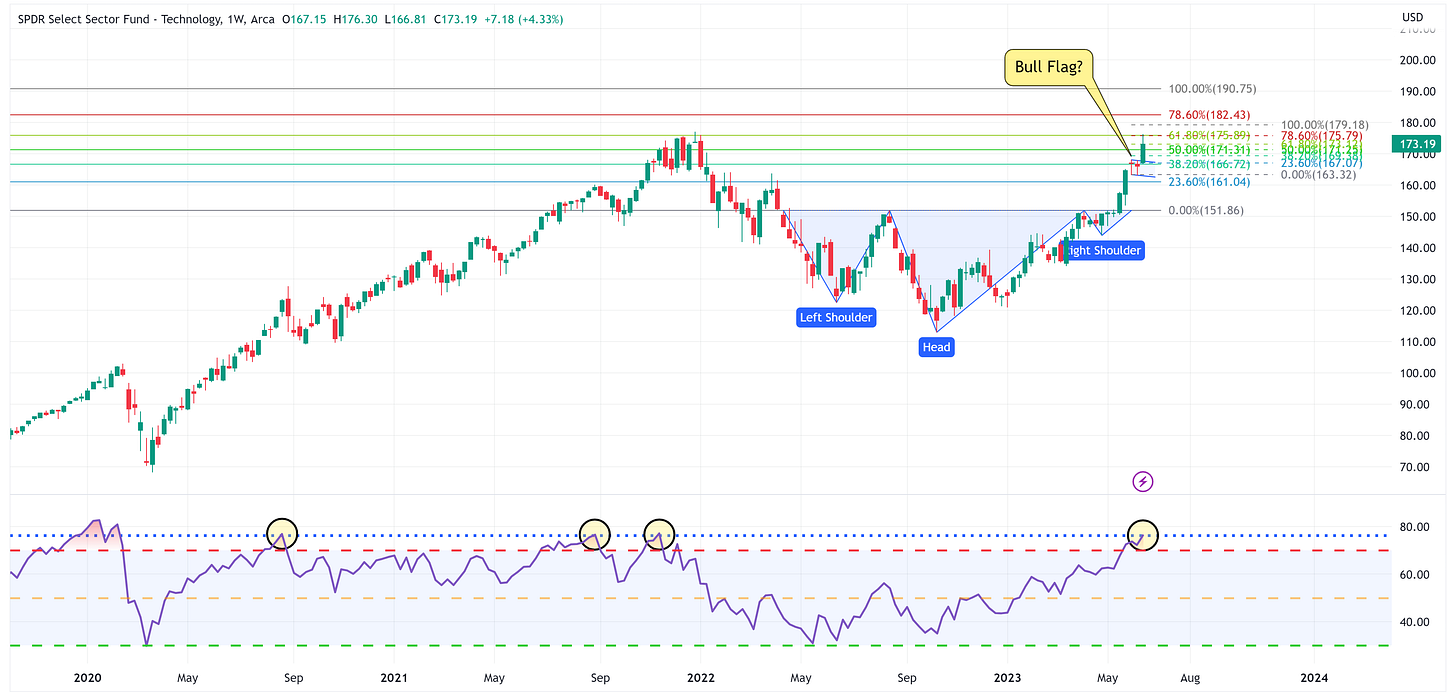
Last week, I suggested that we could have a bull flag pattern in place. If so, the consolidation channel was very short-lived and calls for a target of 179.18.
Note the RSI panel as we’re at the level where we have turned lower before. Given Technology’s run this year and where it is in standard deviation terms, it feels like we’ve entered the “picking up pennies in front of a steamroller” stage. Sure, Technology can still move higher from here but it could make sense to reduce some exposure at some point.
Communication Services
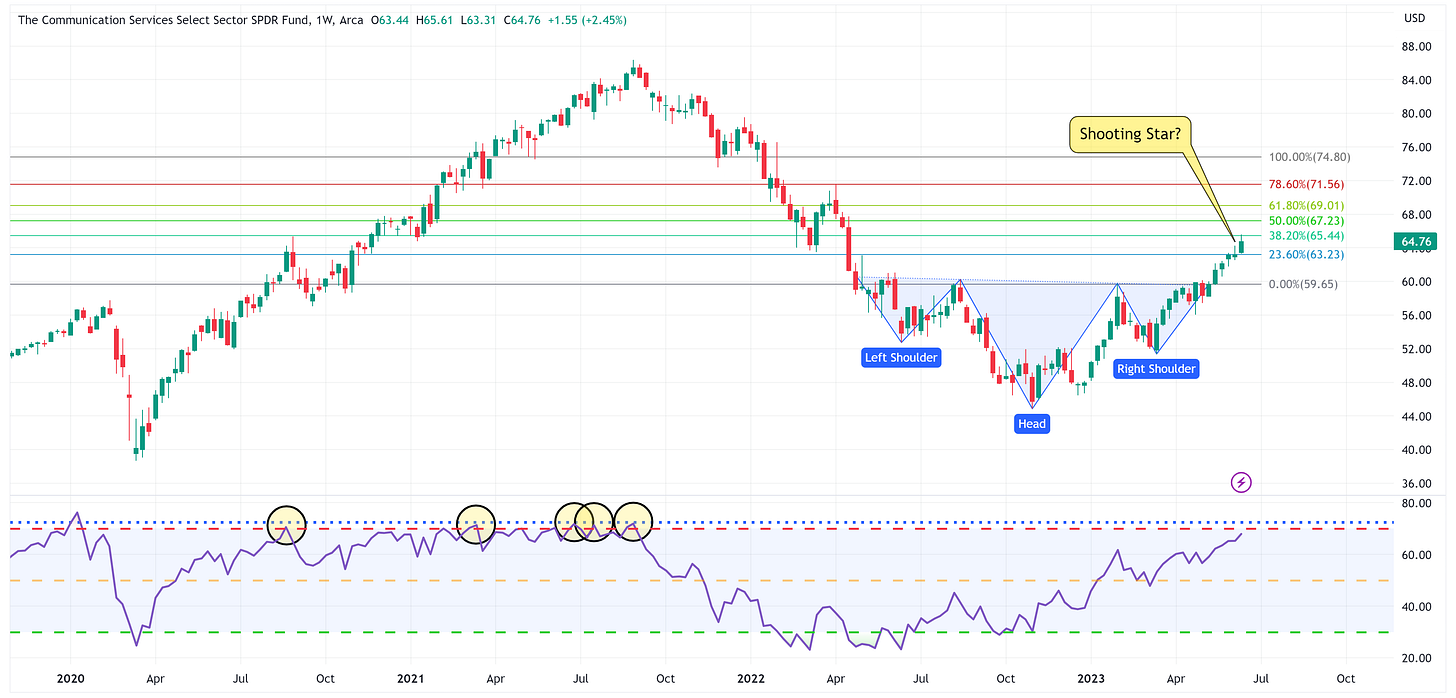
Last week, I suggested that we may have a shooting star pattern and that would suggest a move lower for XLC. That was not the case as XLC went on to have another great week.
After having dismissed the shooting star, the chart would suggest that XLC can still move higher from here; however, note the RSI and that we are quickly approaching the level associated with a subsequent move lower.
Consumer Discretionary
If the symmetrical triangle plays out, XLY could have room to run. With that said, note the RSI. We continue to see sectors pushing the upper threshold for RSI which is historically an area where we have a consolidation or a corrective move lower.
Industrials
The Industrials sector recently broke out of two different bases (blue horizontal lines) and the RSI has room to run. These are net positives and would suggest that XLI has room to run. The next test will be the horizontal red line at 107.58.
Energy
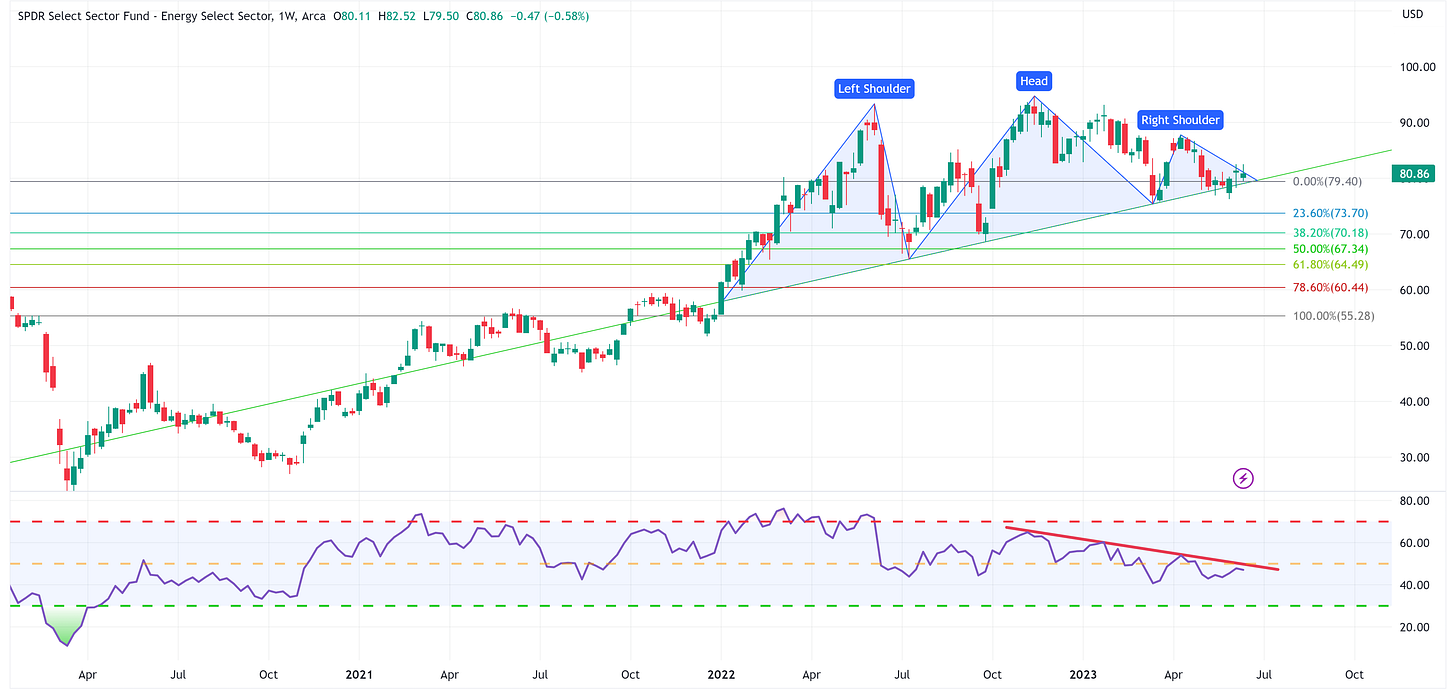
Watch Energy here. We have what appears to be a rather large head & shoulders pattern coupled with negative divergence in the RSI panel. If XLE breaks below the neckline, the first stop would be around 73.70, or approximately -8.0% lower than Friday’s close.
Materials
Materials have had a good run the last several weeks and have plenty of room to run with respect to the RSI. Last week’s close is right at a level that will have to be pushed through to keep the move going so watch for the 81.89 level to be breached for the next move higher.
Financials
Very similar to Materials, Financials have had a good couple of weeks and have plenty of room to run with respect to the RSI (and a positive divergence). However, note how XLF temporarily traded above the resistance level (blue horizontal line) and then closed right in line with it. For the move higher to continue, XLF has to close above resistance and then begin to use it as support going forward.
Real Estate
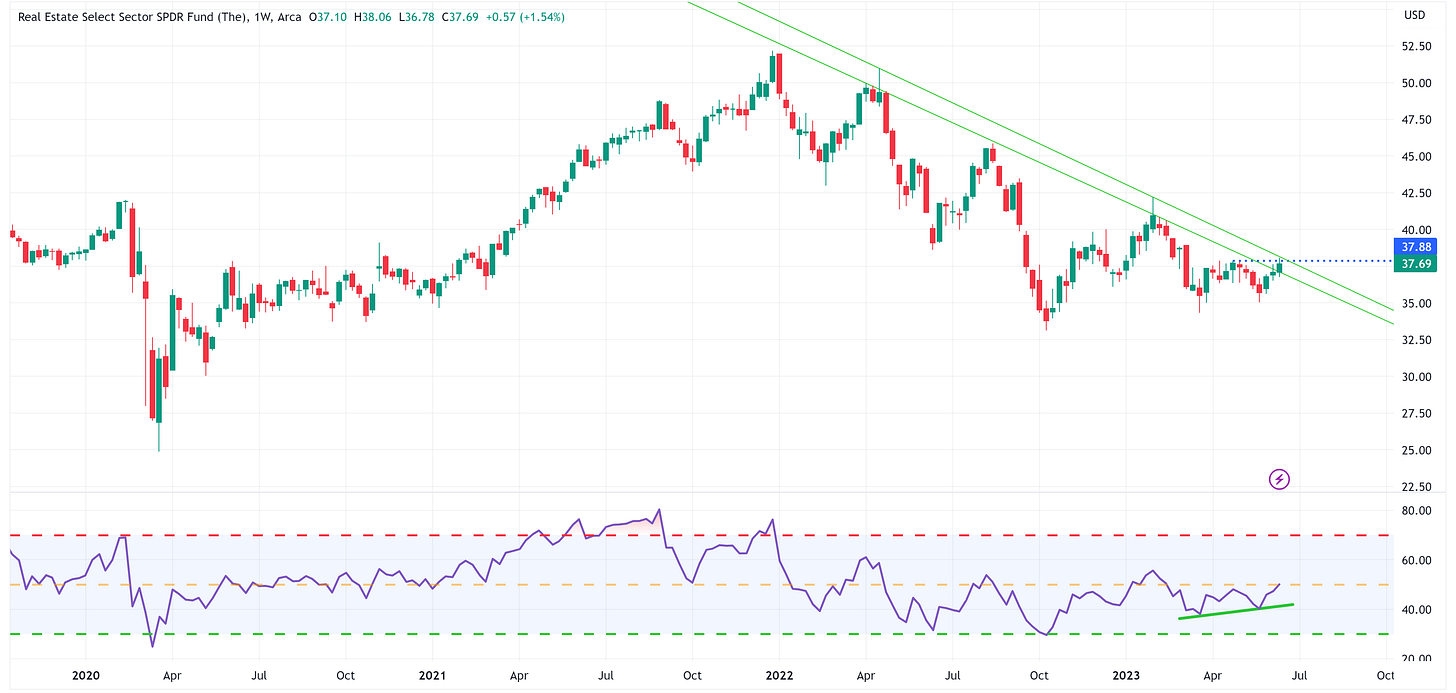
This is beginning to sound like a broken record but Real Estate has a very similar setup to Materials and Financials. It has plenty of room to run from an RSI standpoint (and a positive divergence) but simply needs to close above recent resistance and then begin to use that resistance as support.
The Defensive Sectors
These last three sectors all fall into the “Cheap & Oversold” quadrant and are all beyond the -2.0 standard deviation threshold on a “Relative Value” basis.
I have said for weeks now that if/when the market begins to correct, we would see a rotation into these sectors as a) they have historically been associated with being “defensive” sectors, b) they are “Cheap & Oversold”, and c) they are well beyond the -2.0 standard deviation threshold.
I would add that each of these sectors has plenty of room to run from an RSI standpoint, each is exhibiting positive divergence, and each is exhibiting chart patterns that suggest there is further upside to go.
Health Care
Utilities
Consumer Staples
Summary
This week comes down to a comparison of where each of the sectors stands from an RSI standpoint. As you would expect, sectors that have been relatively strong this year are pushing RSI levels that suggest a correction is imminent. Alternatively, the weaker sectors all appear to have room to run, and given that some of them skew towards more defensive sectors in general, they might make a nice home, even if temporarily, once the market goes through a corrective or consolidating period.
Until next time…


