


Weekly Chart Review
Expect the chop to continue...At least for now...

Hey, it’s Jim.
I hope everyone had a great weekend!
A big “Thank you!” to the new paid subscribers who joined last week, we are so thankful to have you on board!
Still thinking about becoming a paid subscriber? Click the button below to get all the “behind the paywall” analysis…
In this week’s newsletter:
Weekly Market Performance Recap
Weekly Key Economic Reports Recap
FOMC Recap
Key Macro Events This Week
Market Structure-Based Price Projections
S&P 500
NASDAQ
Russell 2000
US Treasury (10-Year)
S&P 500 Fair Value Model
First time reading? Click below to subscribe or to share with a friend or colleague…
Weekly Market Performance Recap

Weekly Economic Reports Recap
Here's a brief overview of the key economic releases from March 17-21, 2025:
Retail Sales
Retail sales in the US increased by 0.2% month-over-month in February 2025, rebounding from a downwardly revised 1.2% fall in January but falling short of the forecasted 0.6% rise. While 7 of 13 retail categories saw declines, nonstore retailers recorded the largest increase at 2.4%.
FOMC Interest Rate Decision
The Federal Reserve maintained its benchmark interest rates, keeping the primary borrowing rate within a range of 4.25% to 4.50%. The Fed still anticipates two potential quarter-point rate cuts later in 2025, totaling a half percentage point reduction.
Jobless Claims
Initial claims for state unemployment benefits rose slightly by 2,000 to a seasonally adjusted 223,000 for the week ended March 15. Continuing claims increased by 33,000 to 1.892 million. While layoffs remain low, more individuals are staying on unemployment rolls for longer periods compared to the previous year.
Philadelphia Fed Manufacturing Index
The Philadelphia Fed Manufacturing index experienced a significant decline in March, dropping 5.6 points to 12.5. The 6-month outlook for new orders fell by 30.8 points to 2.3, reaching its lowest level in three years and marking the third-largest drop in history.
These economic indicators present a mixed picture of the US economy, with modest retail sales growth, steady interest rates, a relatively stable job market, but concerning trends in manufacturing outlook.
FOMC Recap
I’d like to spend a minute diving a little deeper into the FOMC’s rate decision last week.
As noted above, the Fed kept rates unchanged at a range of 4.25% - 4.50%. This was largely a foregone conclusion and was not a surprise.
Beyond that, I’d like to highlight other conclusions that came out of the Fed’s “Summary of Economic Projections” which was released last Wednesday:
GDP is forecasted to be lower than anticipated in December. (Red box)
The Unemployment Rate is forecasted to be higher than anticipated in December. (Green box)
Inflation is forecasted to be higher than anticipated in December. (Blue/Yellow boxes)
The end-of-year Fed Funds rate is forecasted to be the same as anticipated in December. (Purple box)
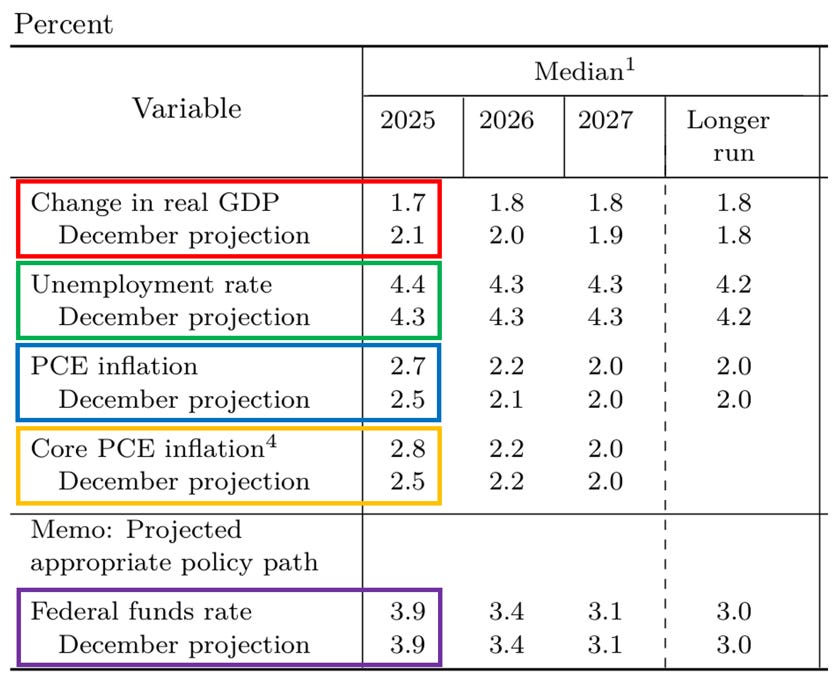
To summarize in a sentence (a run-on sentence at that…): The Fed believes growth is slowing, inflation is rising, and that these items will lead to an increase in unemployment, and yet the Fed has forecasted no change to their policy rate (vs. December when their growth estimates were higher, inflation expectations were lower, and unemployment was marginally better).
Something about this view from the FOMC feels a bit incongruent.
Now, let’s look at what the market believes about the potential for rate cuts in 2025.
You will notice in the chart below that the market believes there will be three rate cuts over the remainder of this year (June, September, and December).

This suggests to me that the market is looking through the concerns of rising inflation and focusing more on the slowing of economic activity.
If we look at the chart below, we can see that both the “Blue Chip consensus” and Atlanta Fed GDPNow have been calling for a lower rate of growth in the US over the last month and the Atlanta Fed GDPNow is decidedly negative in its assessment.

A lot can happen in the weeks and months to come but the market is suggesting that slowing growth will win out over rising inflation. This will likely have implications for how you should think about positioning your portfolio.
Key Macro Events This Week
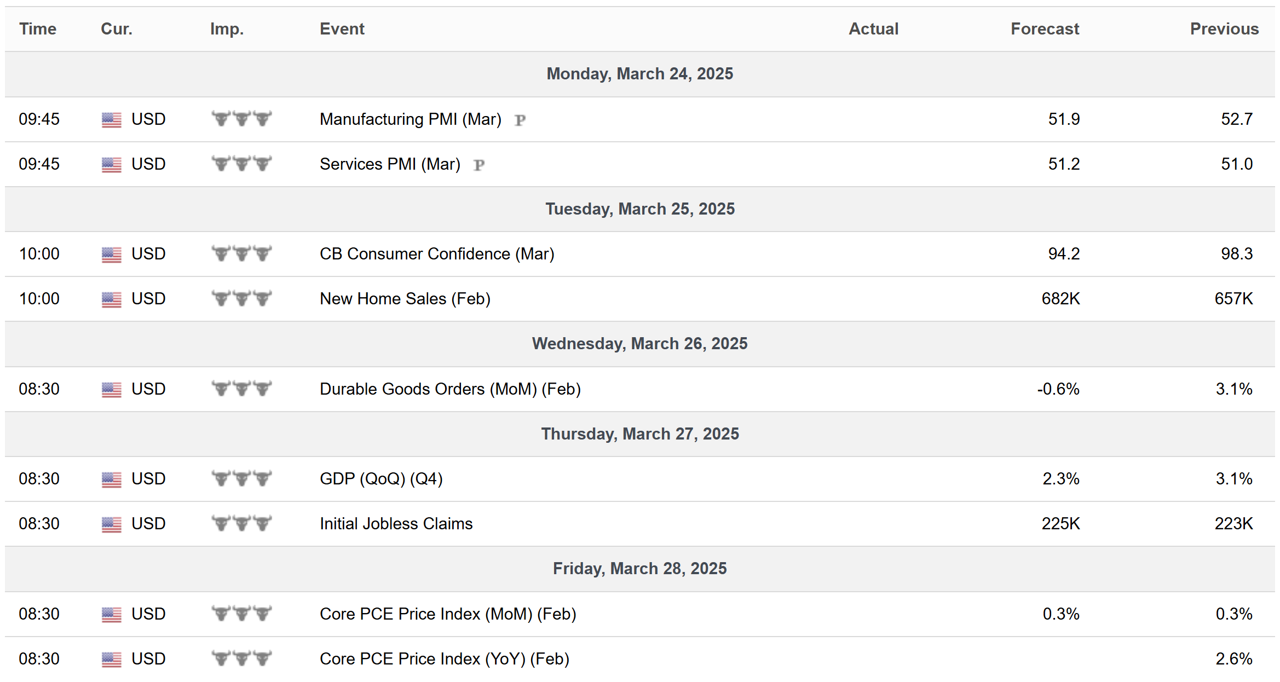
Keep an eye on the Core PCE Index release on Friday.
Now, let’s dive into our market structure-based price projections for the S&P 500, NASDAQ, Russell 2000, and US Treasury 10-Year yields.
As an aside, if there are other indices, ETFs, stocks, commodities, etc. that you would like to see analyzed in this manner, please reply to this email with your request and I will do my best to include them in future newsletters.
We’ll also take a look at our S&P 500 fair value model to get a sense of where current prices are relative to our fair value model.
Let’s jump in…
Keep reading with a 7-day free trial
Subscribe to Skillman Grove Research to keep reading this post and get 7 days of free access to the full post archives.