
The Market Map
Random Thoughts...

Hey everyone — it’s Jim.
I hope you had a great weekend!
Proprietary Buy/Sell Indicator
Before we begin, one last call for our upcoming free live webinar on Tuesday, February 3rd at 7:00 pm ET, where we will discuss our proprietary buy/sell indicator.
Note: A recording will be provided for everyone who registers, in case you are unable to join live.
The indicator:
Provides real-time buy/sell signals.
Provides a warning when the current trend may be nearing the point of exhaustion.
Works on any time frame and any security.
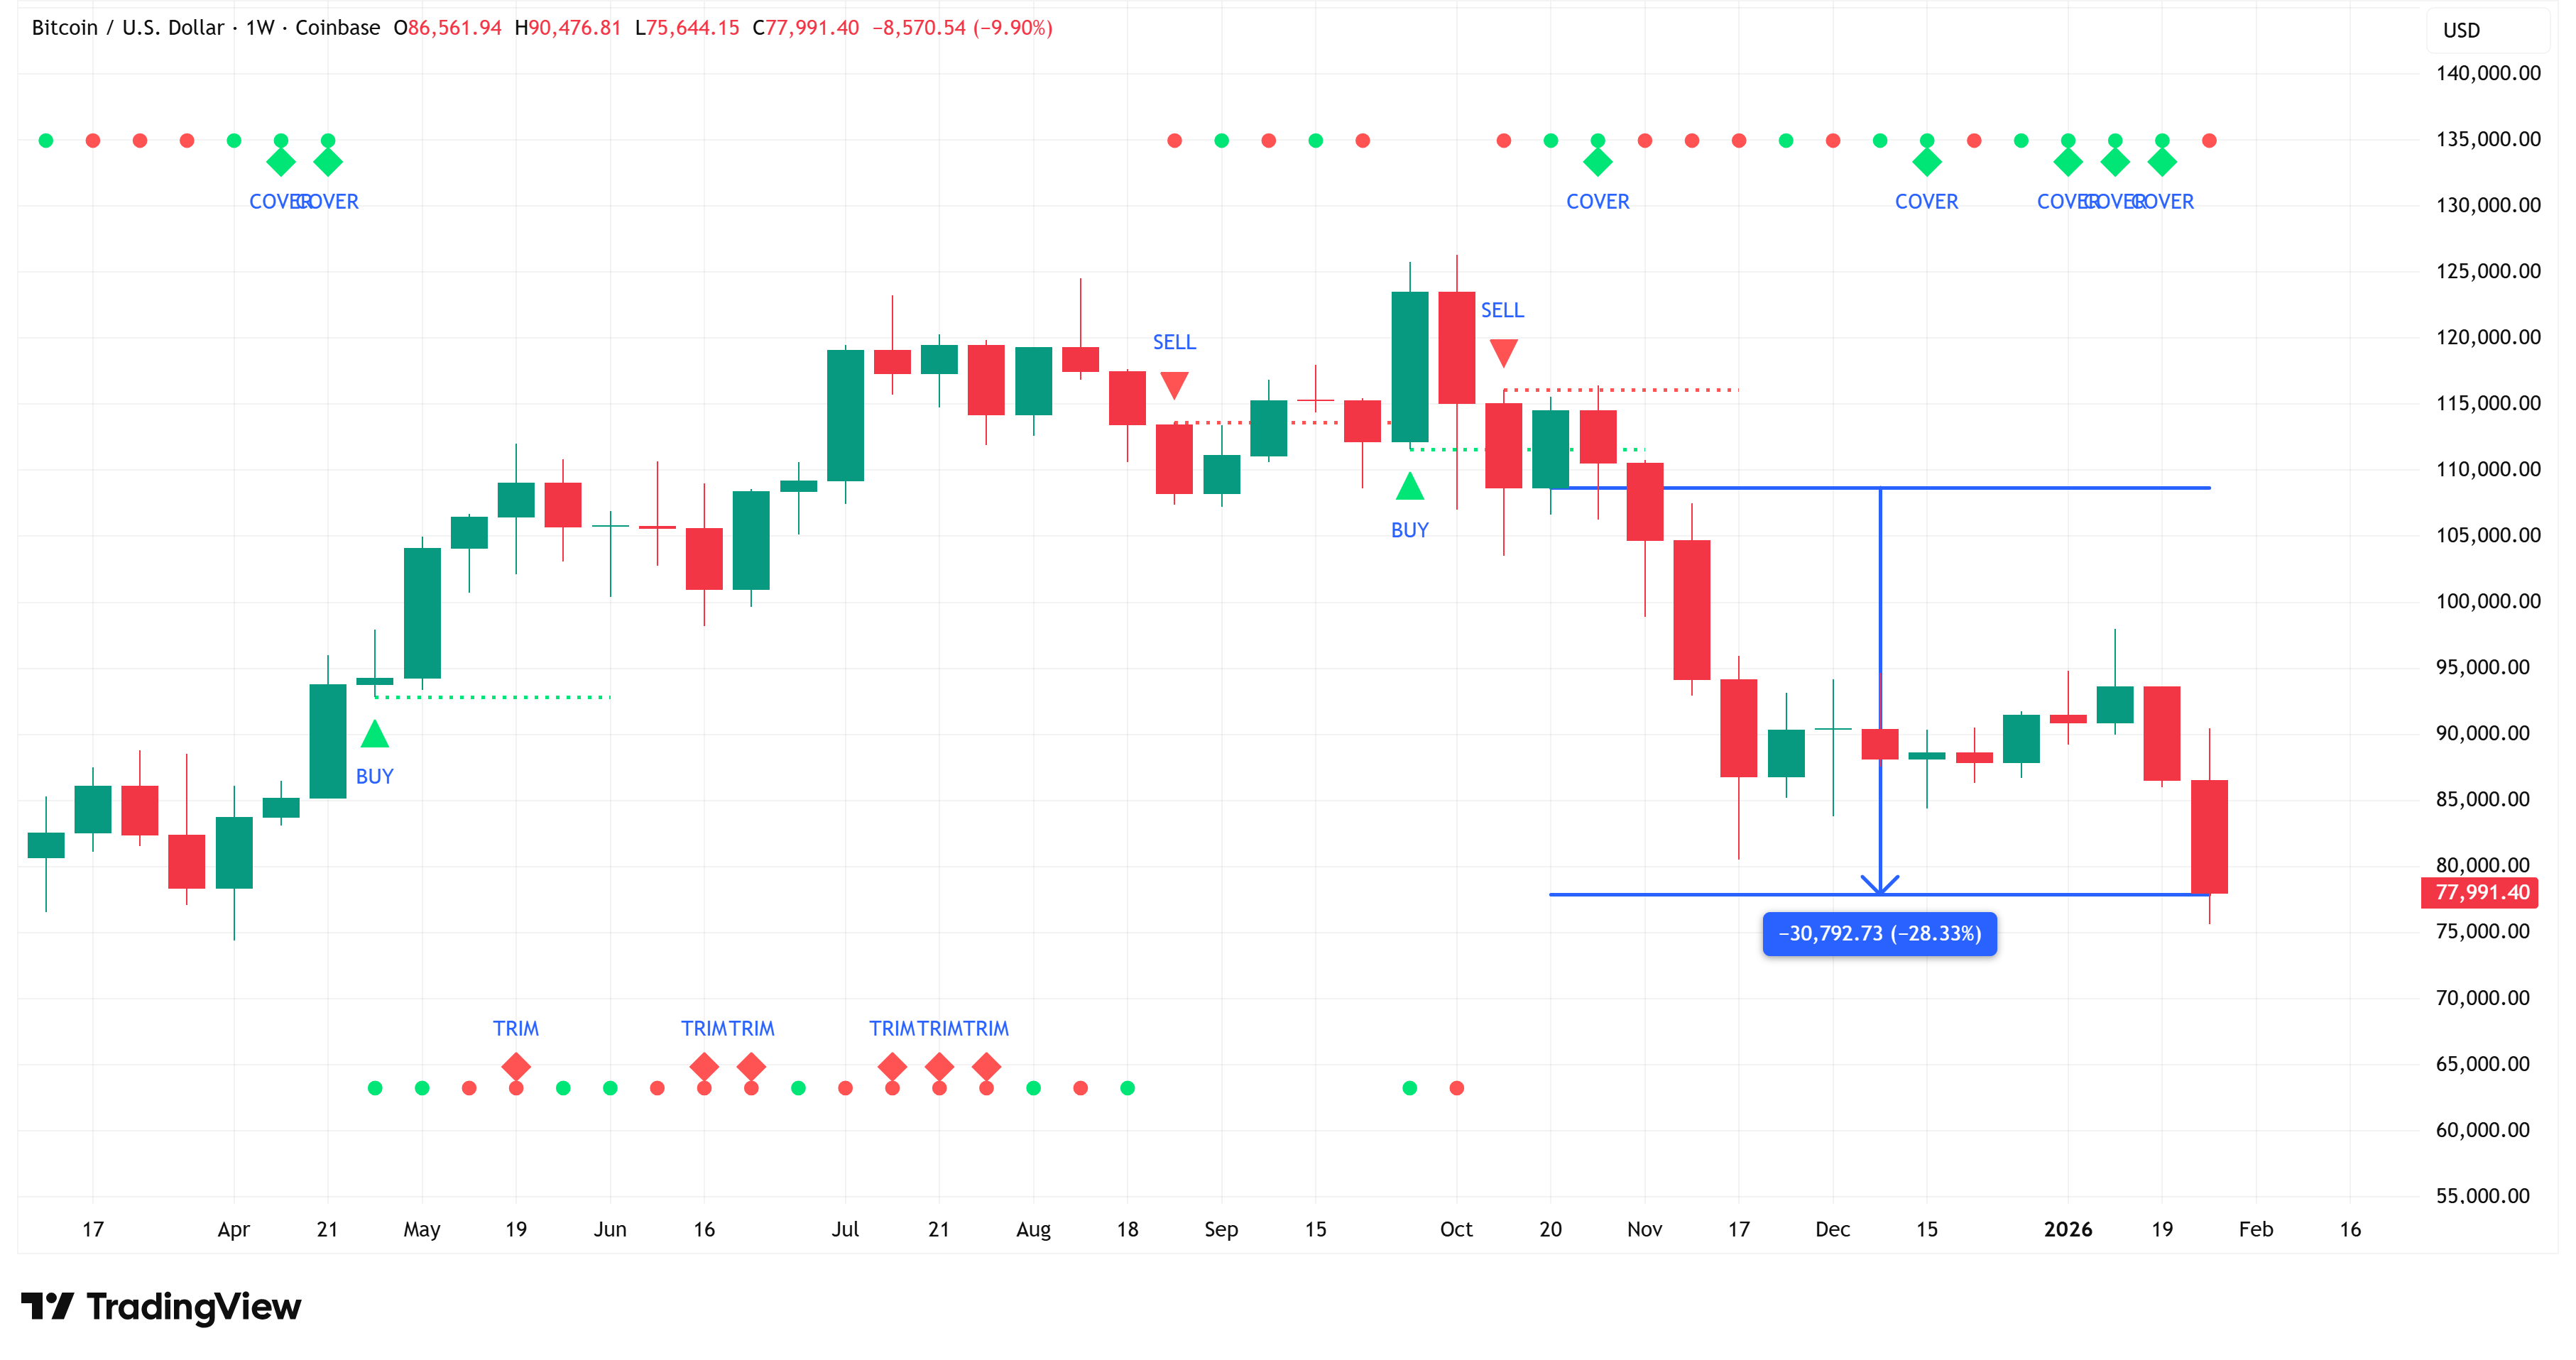
Wish you had gotten out of Bitcoin earlier?
Our indicator triggered a “Sell” signal the week of October 13th, which would have saved you about 28%…
To sign up for our free live webinar, please click on the following link:
Note: You do not have to be a current subscriber to The Market Map to attend the webinar, so please feel free to forward this to others who may be interested.
This indicator is currently only available on the TradingView platform.
TradingView is free, but if you’re interested in additional features, functionality, etc., you can upgrade to a paid version (although not required to use the new indicator).
The Market Map subscribers can receive a discount for a paid TradingView membership by clicking on the following link:
Okay, with that out of the way, let’s jump into this week’s newsletter…
The Market Map
Each week, we break down the S&P 500 using our proprietary systematic process called “The Market Map” to understand where the market may be heading next.
To do that, we start by analyzing the bigger picture (weekly chart) and then look for confirming evidence by shifting to the lower time frame (4-hour chart).
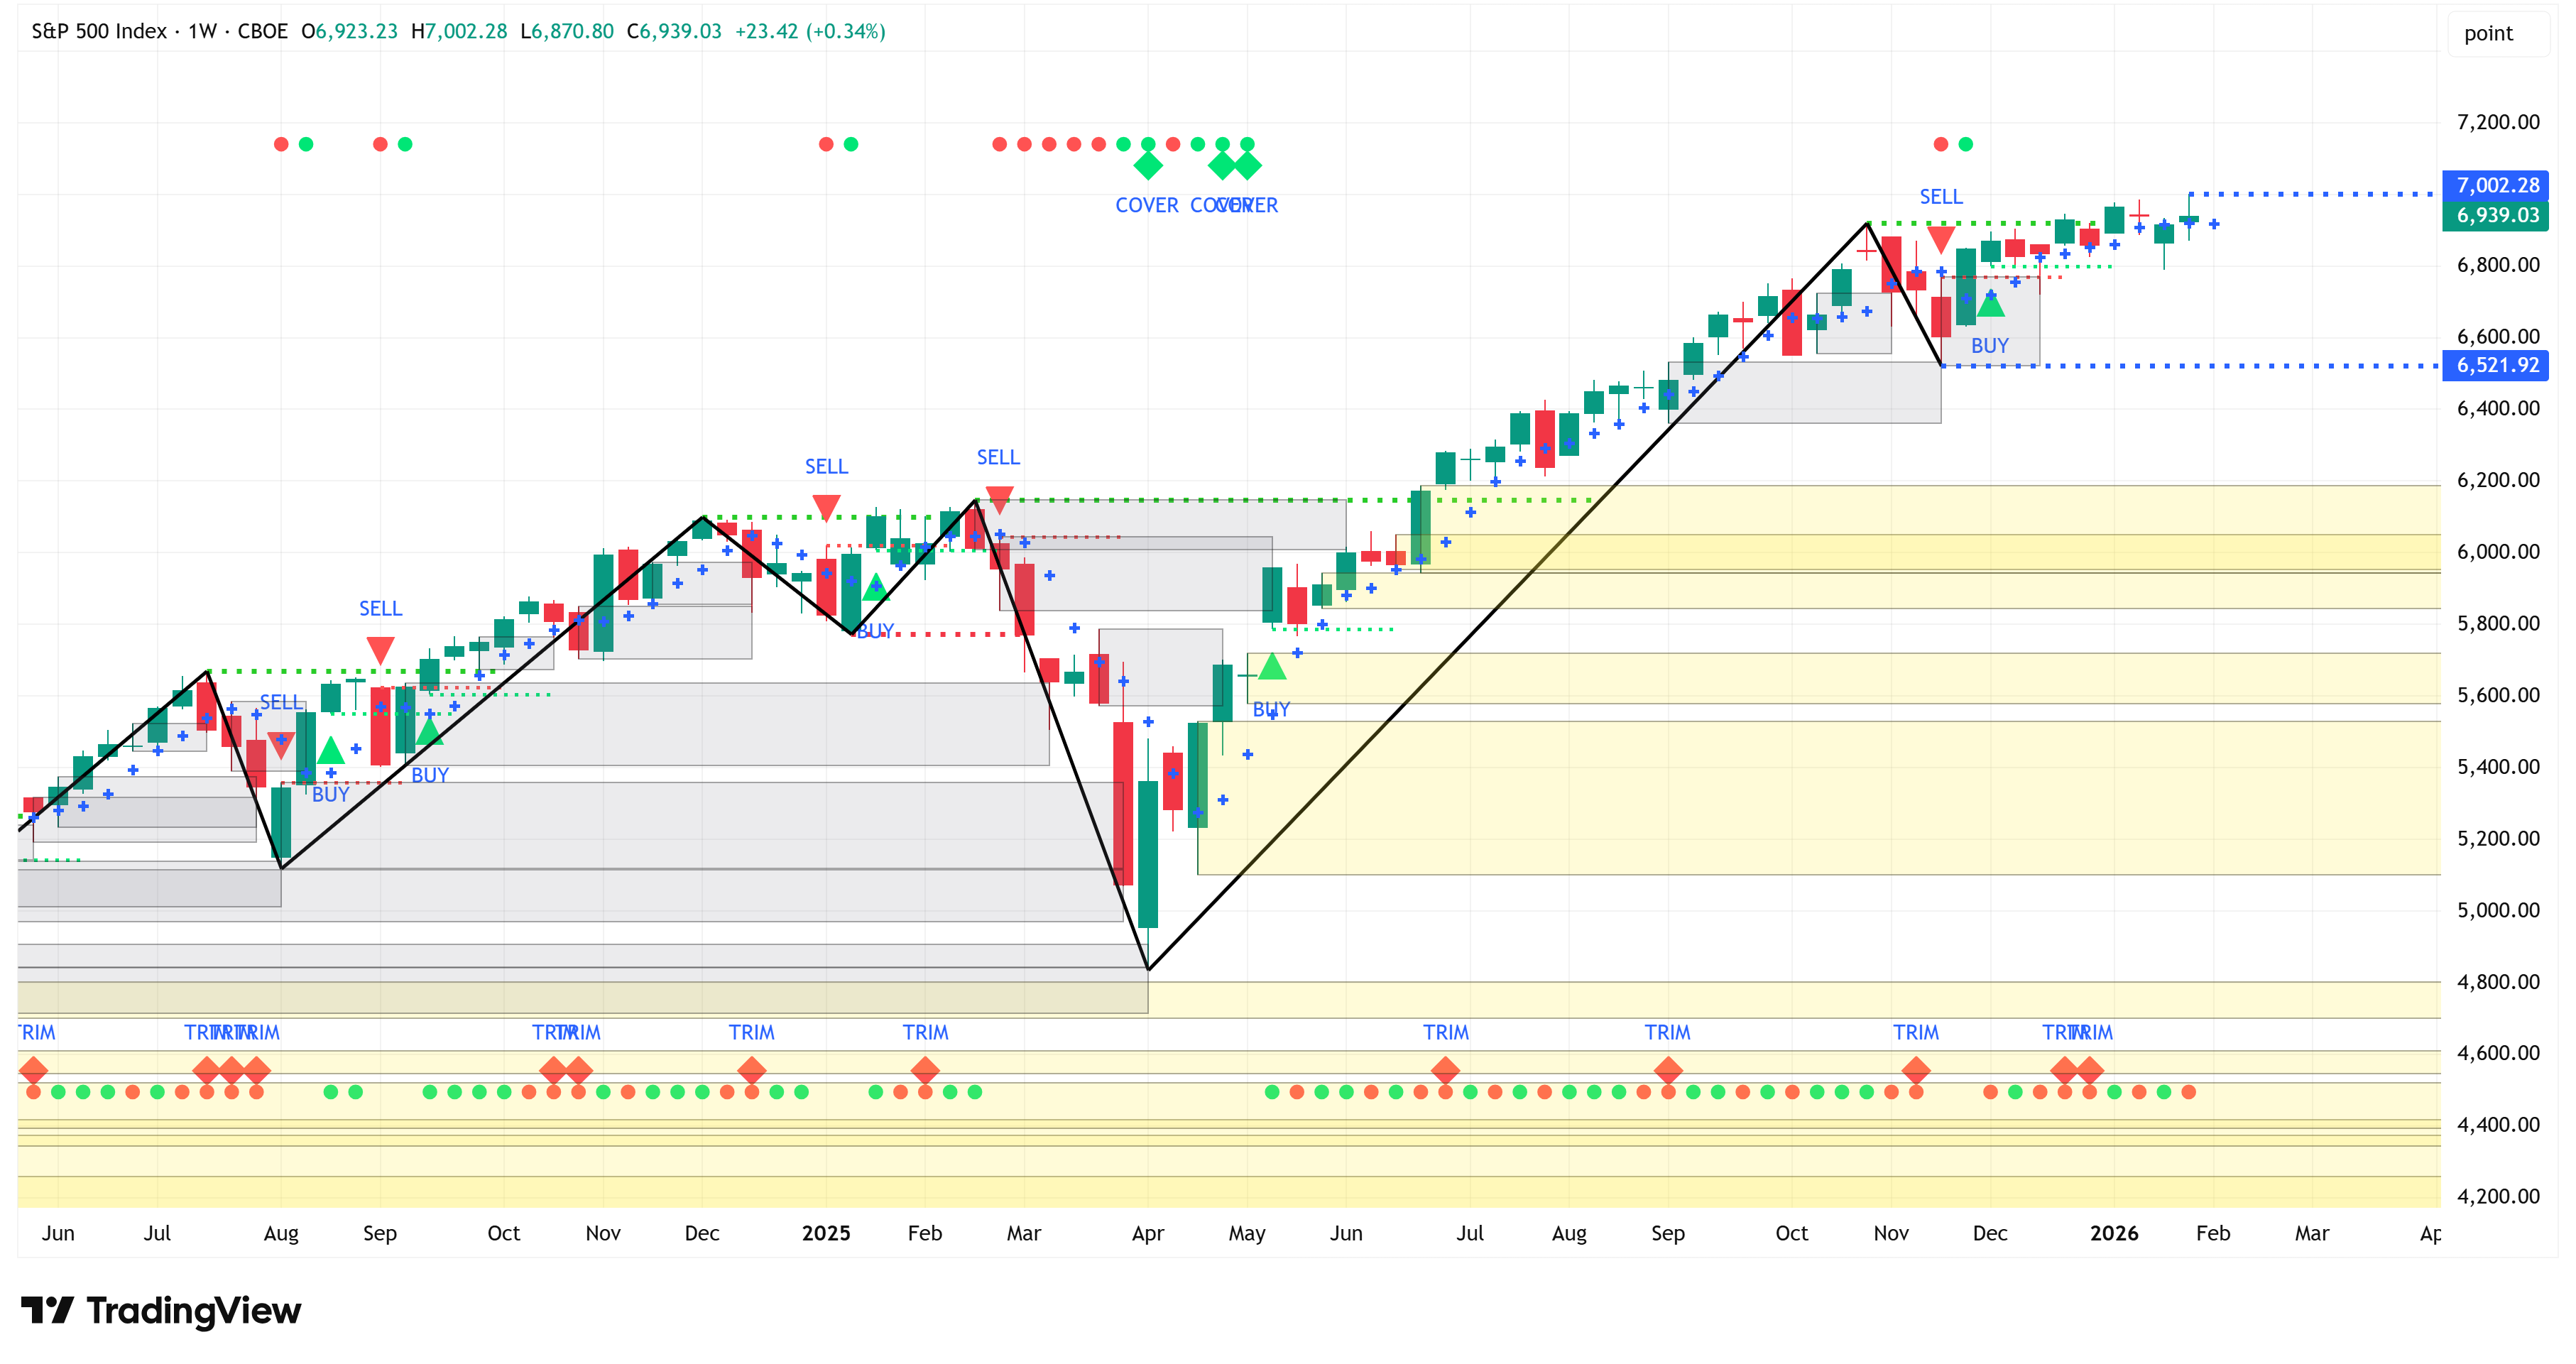
Weekly Chart
I’m starting to sound like a broken record, but the weekly chart remains in a “bullish structure,” and a “Buy” signal remains in place from several weeks ago.
All else being equal, these two features suggest that the S&P 500 may continue moving higher over the medium term.
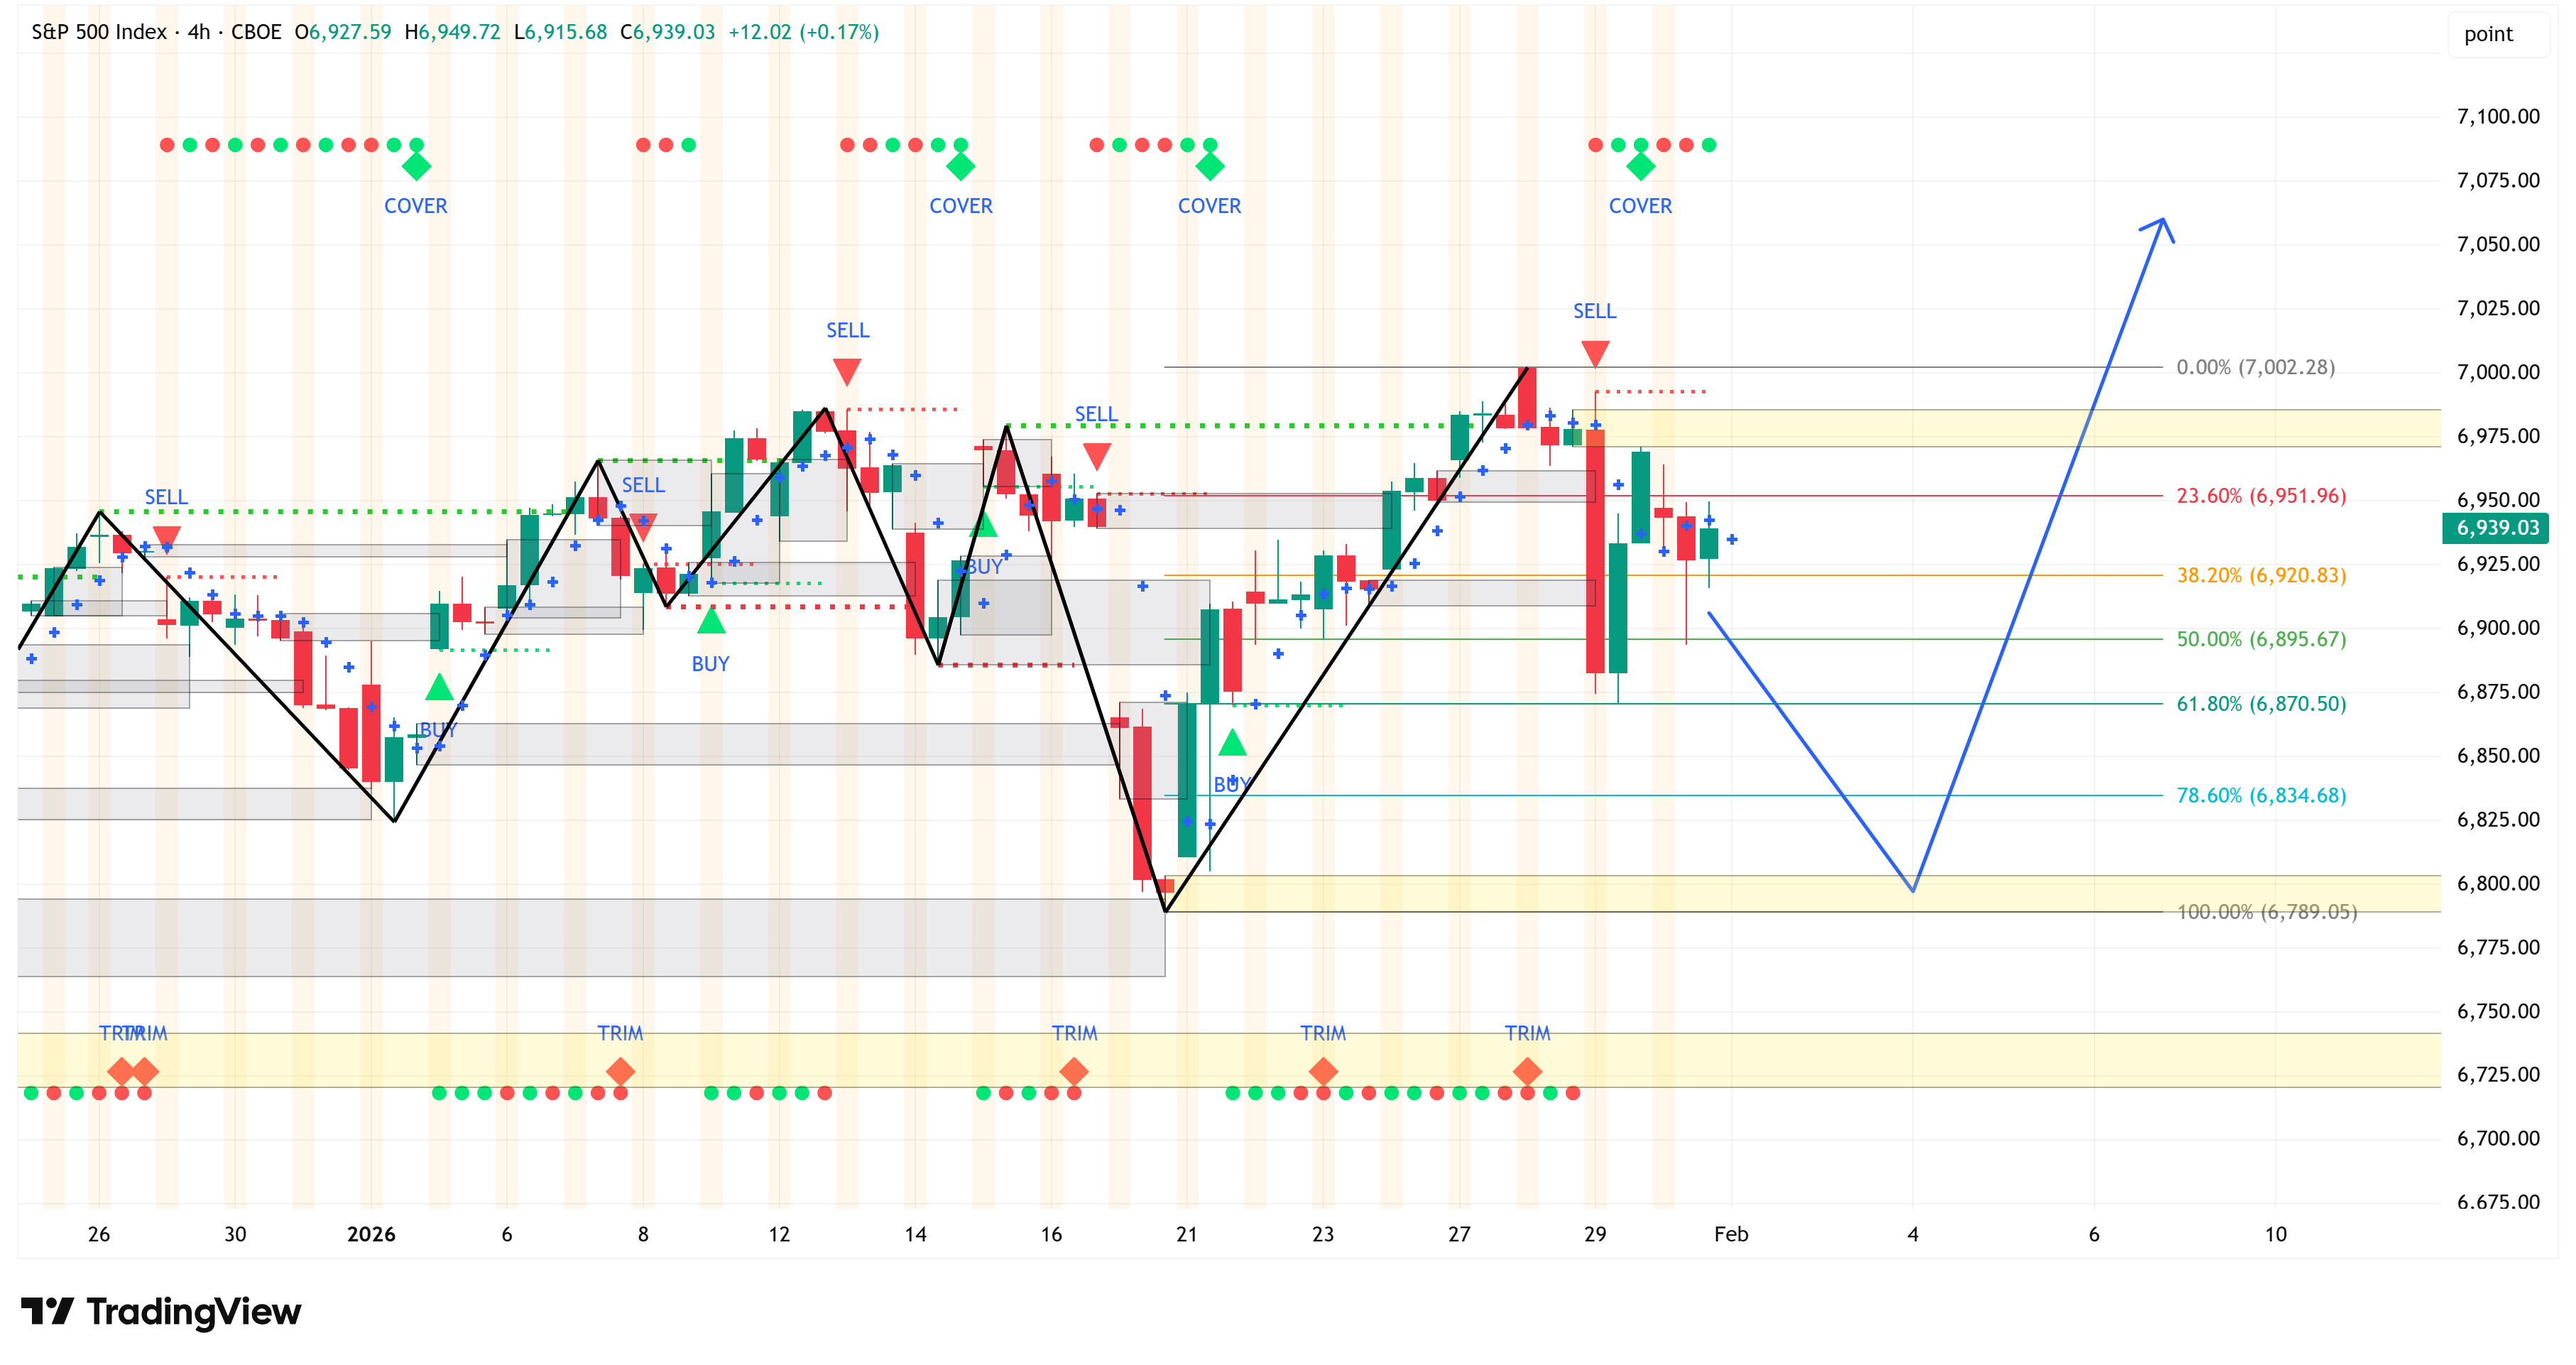
4-Hour Chart
Last week, we were looking for a 4-hour close above 6,979.34 to shift from a “bearish structure” to a “bullish structure” on the 4-hour chart.
We closed above 6,979.34 on Tuesday of last week, thus shifting the 4-hour chart to a “bullish structure”.
Since then, the 4-hour chart has registered a “Sell” signal, which suggests that the 4-hour chart may need to go lower before it can go higher.
The blue line in the chart below is one possible option.
Summary
The Market Map methodology suggests that the S&P 500 remains biased higher over the medium term.
Two key levels to watch:
If the S&P 500 closes below 6,789.05 on the 4-hour chart, this will shift the 4-hour chart from “bullish” to “bearish”.
If the S&P 500 closes below 6,521.92 on the weekly chart, this will shift the weekly chart from “bullish” to “bearish”.
Random Thoughts
Six months or a year from now, I think we’re going to look back and realize that last week was more pivotal than we initially thought.
I don’t know that I have it all figured out just yet, but here are a few random thoughts that I’m processing.
Silver
I’ve never seen anything in my career like the move we saw in silver on Friday.
At one point on Friday, silver was down 35% intraday.
If you look at silver and several other commodities or commodity indices, you’ll notice that they didn’t really take off in earnest until somewhere around April 2025.
Two important things happened in April 2025:
Trump held up the tariff sign, initiating the “tariff tantrum”.
Trump speaks publicly for the first time about firing the head of the Federal Reserve, J. Powell, for not cutting rates fast enough, and insinuates that he should be replaced by someone who would cut rates dramatically.
I think the order of operations for the market then became: New Fed chair handpicked by Trump → dramatic rate cuts → rate cuts in an economy that doesn’t need rate cuts = higher inflation → higher inflation = good for commodities → start buying commodities now to front-run the move.
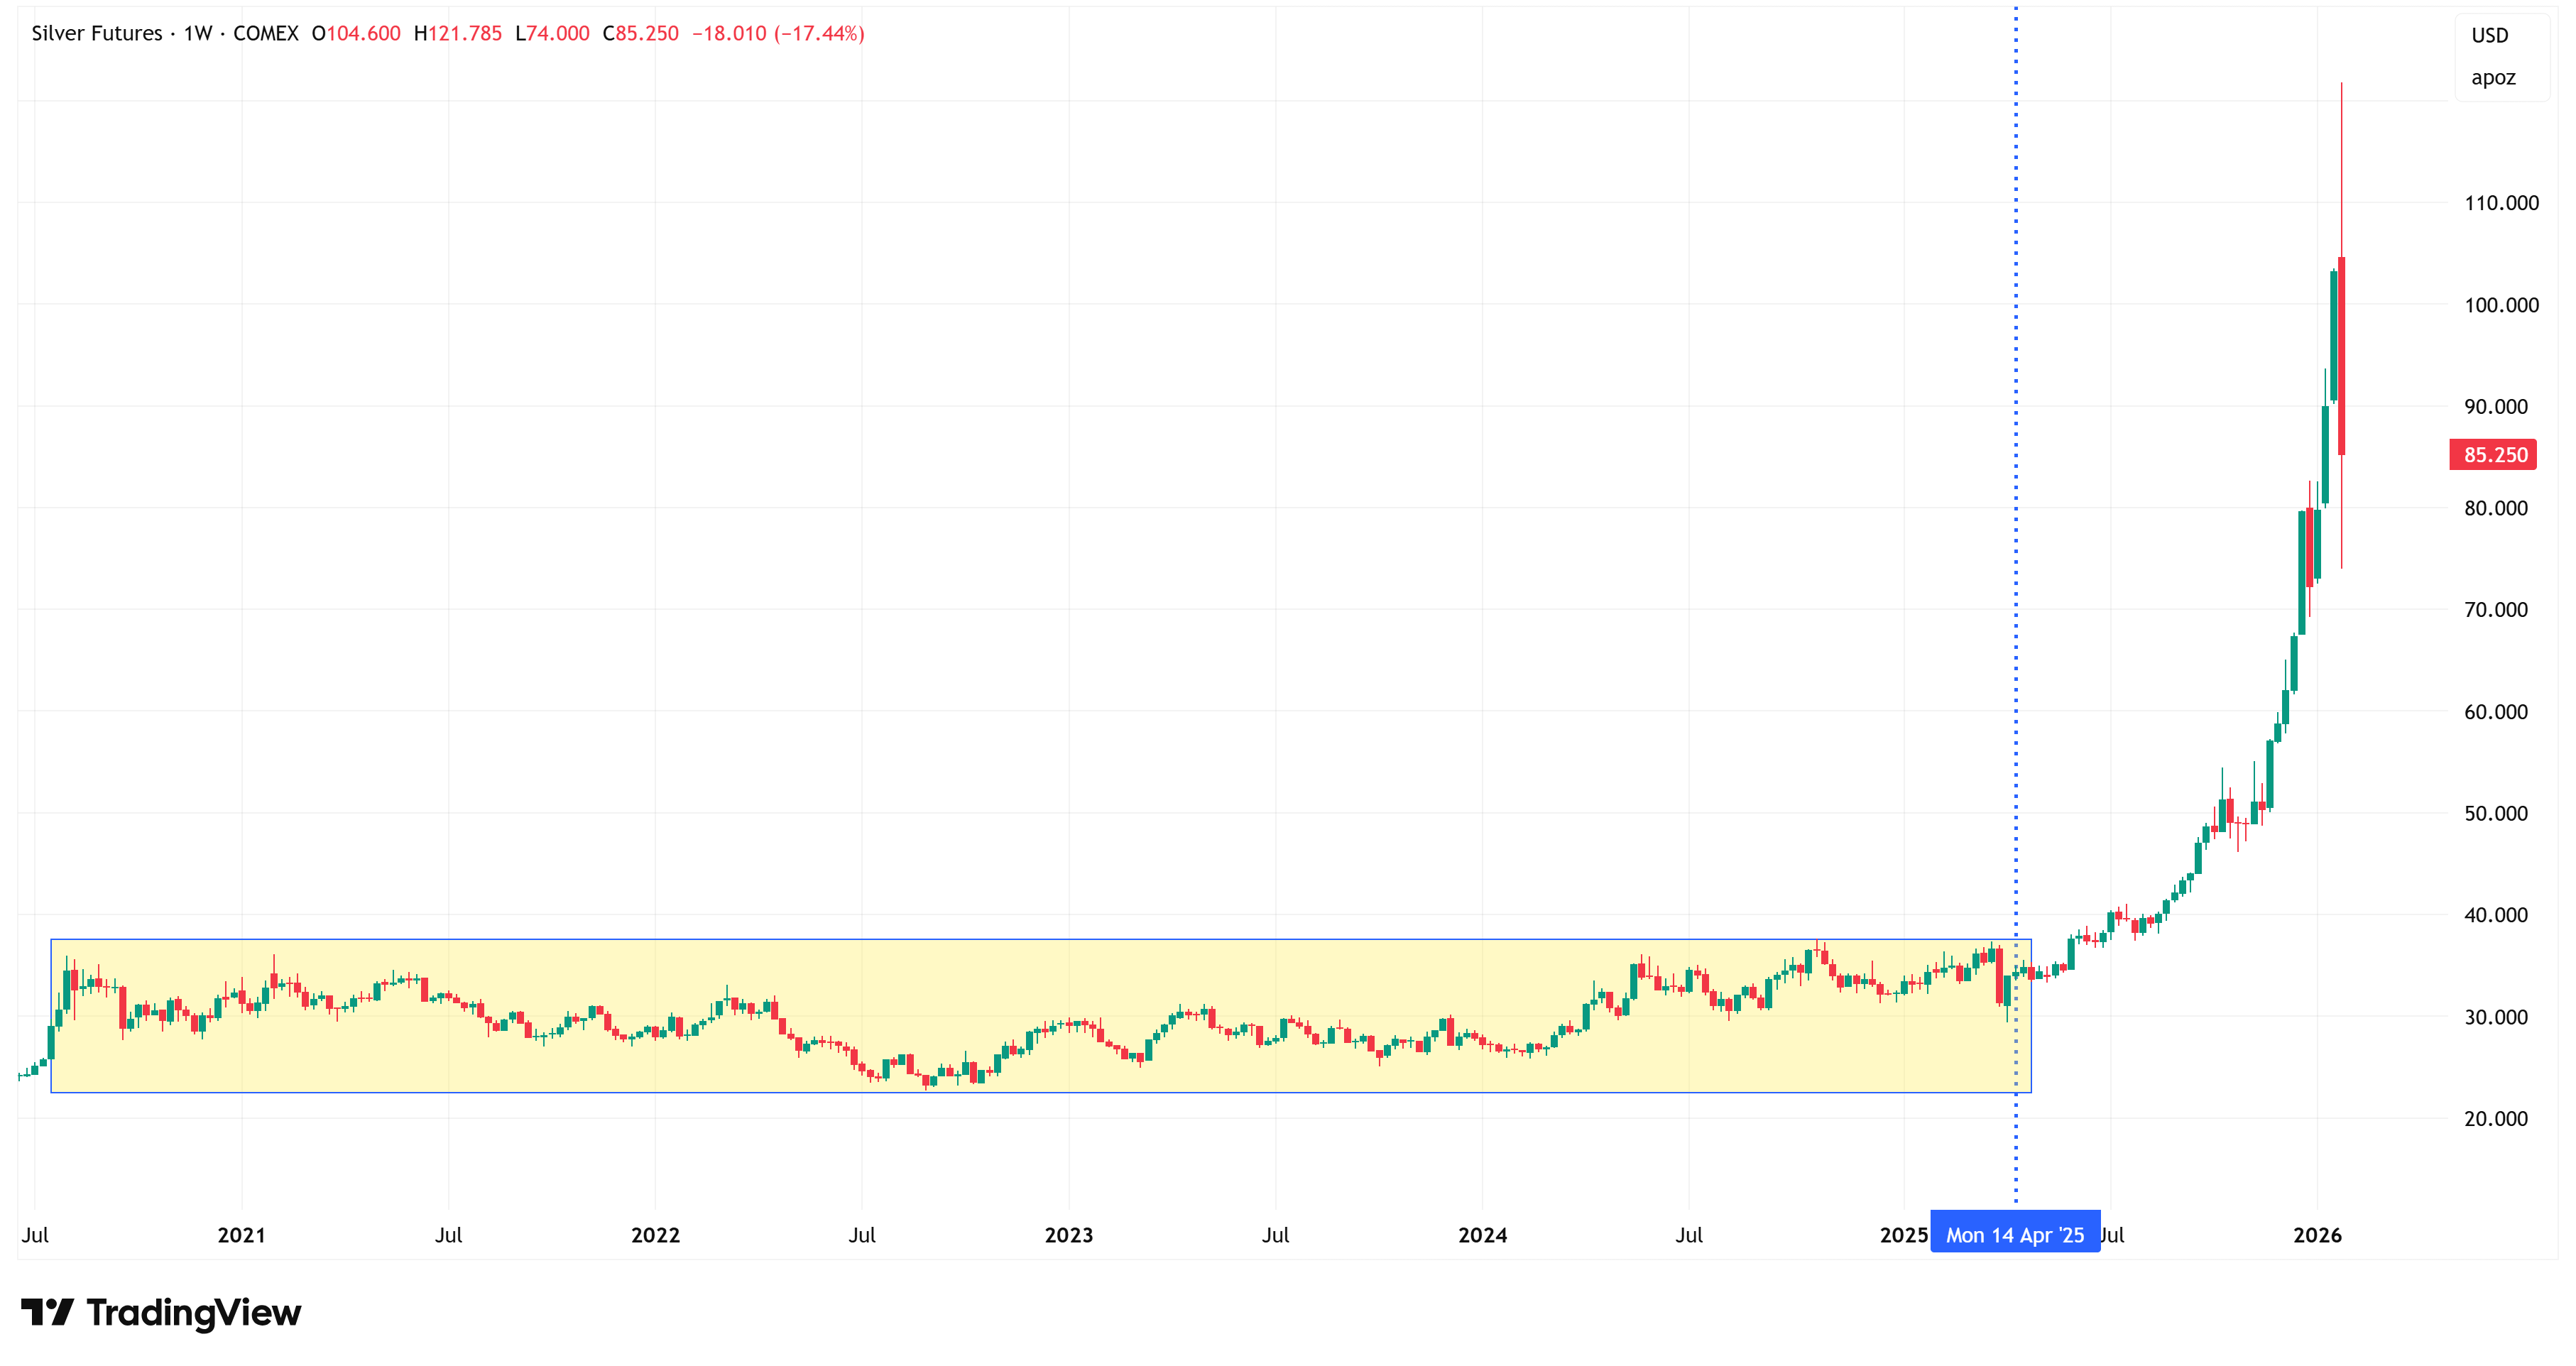
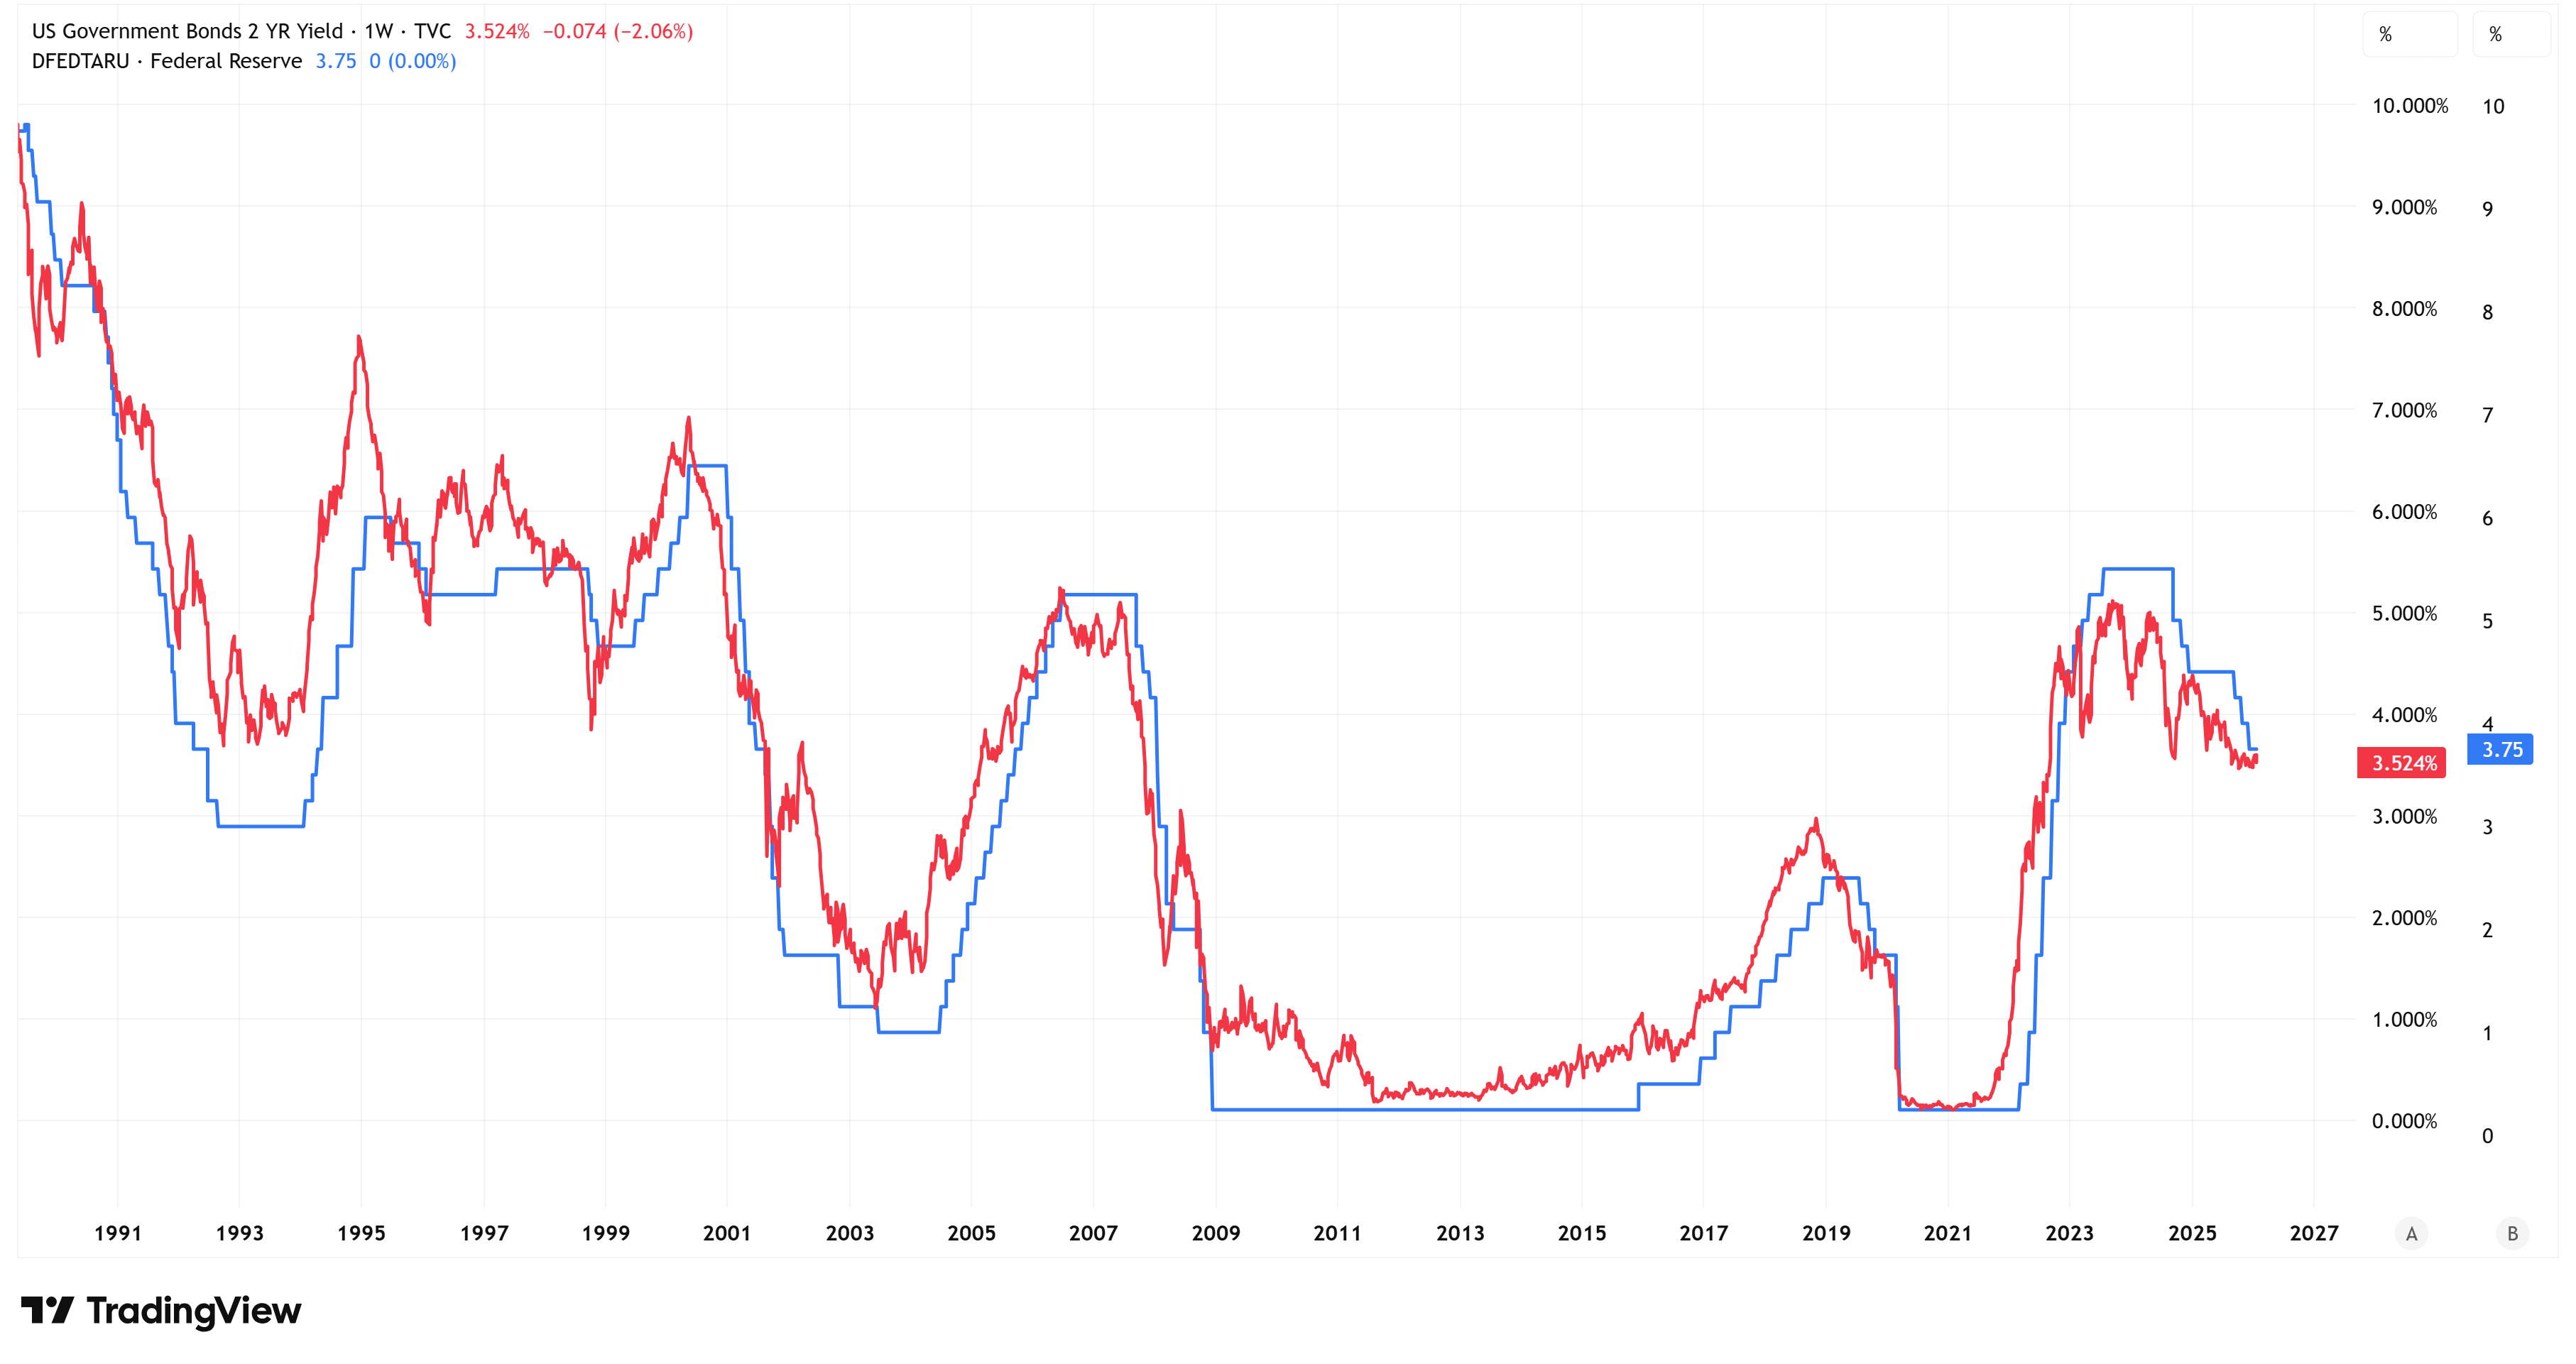
Here is a chart of silver. The vertical line marks the first time Trump spoke publicly about firing J. Powell.
Notice that silver spent the prior five years trading in a range of $22 - $37.
Fast forward to Friday, and Trump announced that he is going to nominate Kevin Warsh as the new head of the Federal Reserve.
Warsh is considered by many to be a great selection for the job, but he skews more “hawkish” than the market believed Trump would select.
The market, especially the commodities markets, reacted violently to this news, as the idea of “dramatic rate cuts” is now likely off the table.
What Trump needs more than anything is for the long end of the Treasury curve to move lower because he needs the housing market to loosen up.
The previously perceived framework (i.e., dramatically lower rates) would have only moved the front end of the curve lower and likely the long end of the curve higher.
This is not what Trump wants/needs.
I think someone probably tapped Trump on the shoulder and explained this to him, and guided him away from selecting an uber “dove” as the next Fed chair. Trump will never admit this, but that’s the only thing that makes sense to me.
It will be interesting to see if Trump dials back the “rates have to go lower” talk from here on out.
If there’s any part of the equity market that was banking on lower rates to continue the rally, I think that ship has now sailed.
If you’re wondering where the FOMC is going to move rates, watch the US Treasury 2-year yield; it always leads.
The Fed Funds rate is currently 3.50% - 3.75%, and the US Treasury 2-year yield is 3.52%. Net/net, the Fed isn’t cutting or raising rates for the foreseeable future.
Consumer (Not so) Confidence
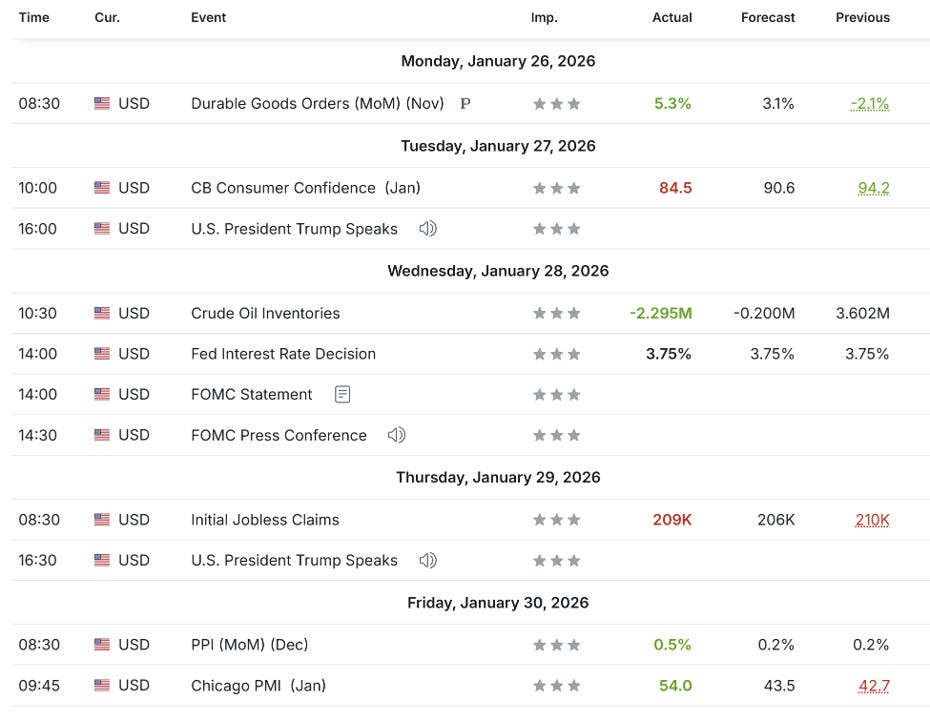
The Conference Board Consumer Confidence Index® fell by 9.7 points in January to 84.5, from an upwardly revised 94.2 in December.
This is the lowest reading since 2014, surpassing the depths of the pandemic.
You can see the entire report here, and I will list a few of the highlights from the report below.
“The Present Situation Index—based on consumers’ assessment of current business and labor market conditions—dropped by 9.9 points to 113.7 in January. The Expectations Index—based on consumers’ short-term outlook for income, business, and labor market conditions—fell by 9.5 points to 65.1, well below the threshold of 80 that usually signals a recession ahead.”
“Confidence collapsed in January, as consumer concerns about both the present situation and expectations for the future deepened,” said Dana M Peterson, Chief Economist, The Conference Board. “All five components of the Index deteriorated, driving the overall Index to its lowest level since May 2014 (82.2)—surpassing its COVID-19 pandemic depths.”
Peterson added: “Consumers’ write-in responses on factors affecting the economy continued to skew towards pessimism. References to prices and inflation, oil and gas prices, and food and grocery prices remained elevated. Mentions of tariffs and trade, politics, and the labor market also rose in January, and references to health/insurance and war edged higher.”
I’m not the smartest guy in the world, but none of that sounds good.
In general, if you are not overly optimistic about the future, you tend to spend less, travel less, and consume less. Thriving economies are built on consumption increasing, not decreasing.
The US economy is “surviving” because rich people continue to spend. I don’t have any reason to believe that will change, but if it does, we will fall into a recession.
Noteworthy Chart
As I detailed in “The Market Map” section above, the S&P 500 continues to remain biased towards the upside; however, I was quick to point out levels where that narrative would change.
Divergences, especially negative divergences, are very important.
Negative divergence occurs when price makes higher highs, but a momentum indicator (RSI, MACD, Stochastics, etc.) makes lower highs.
This indicates buying pressure is weakening even though price is still pushing up, so the trend is vulnerable to a downside move.
This is exactly what we’re seeing on the weekly chart of the S&P 500 right now.
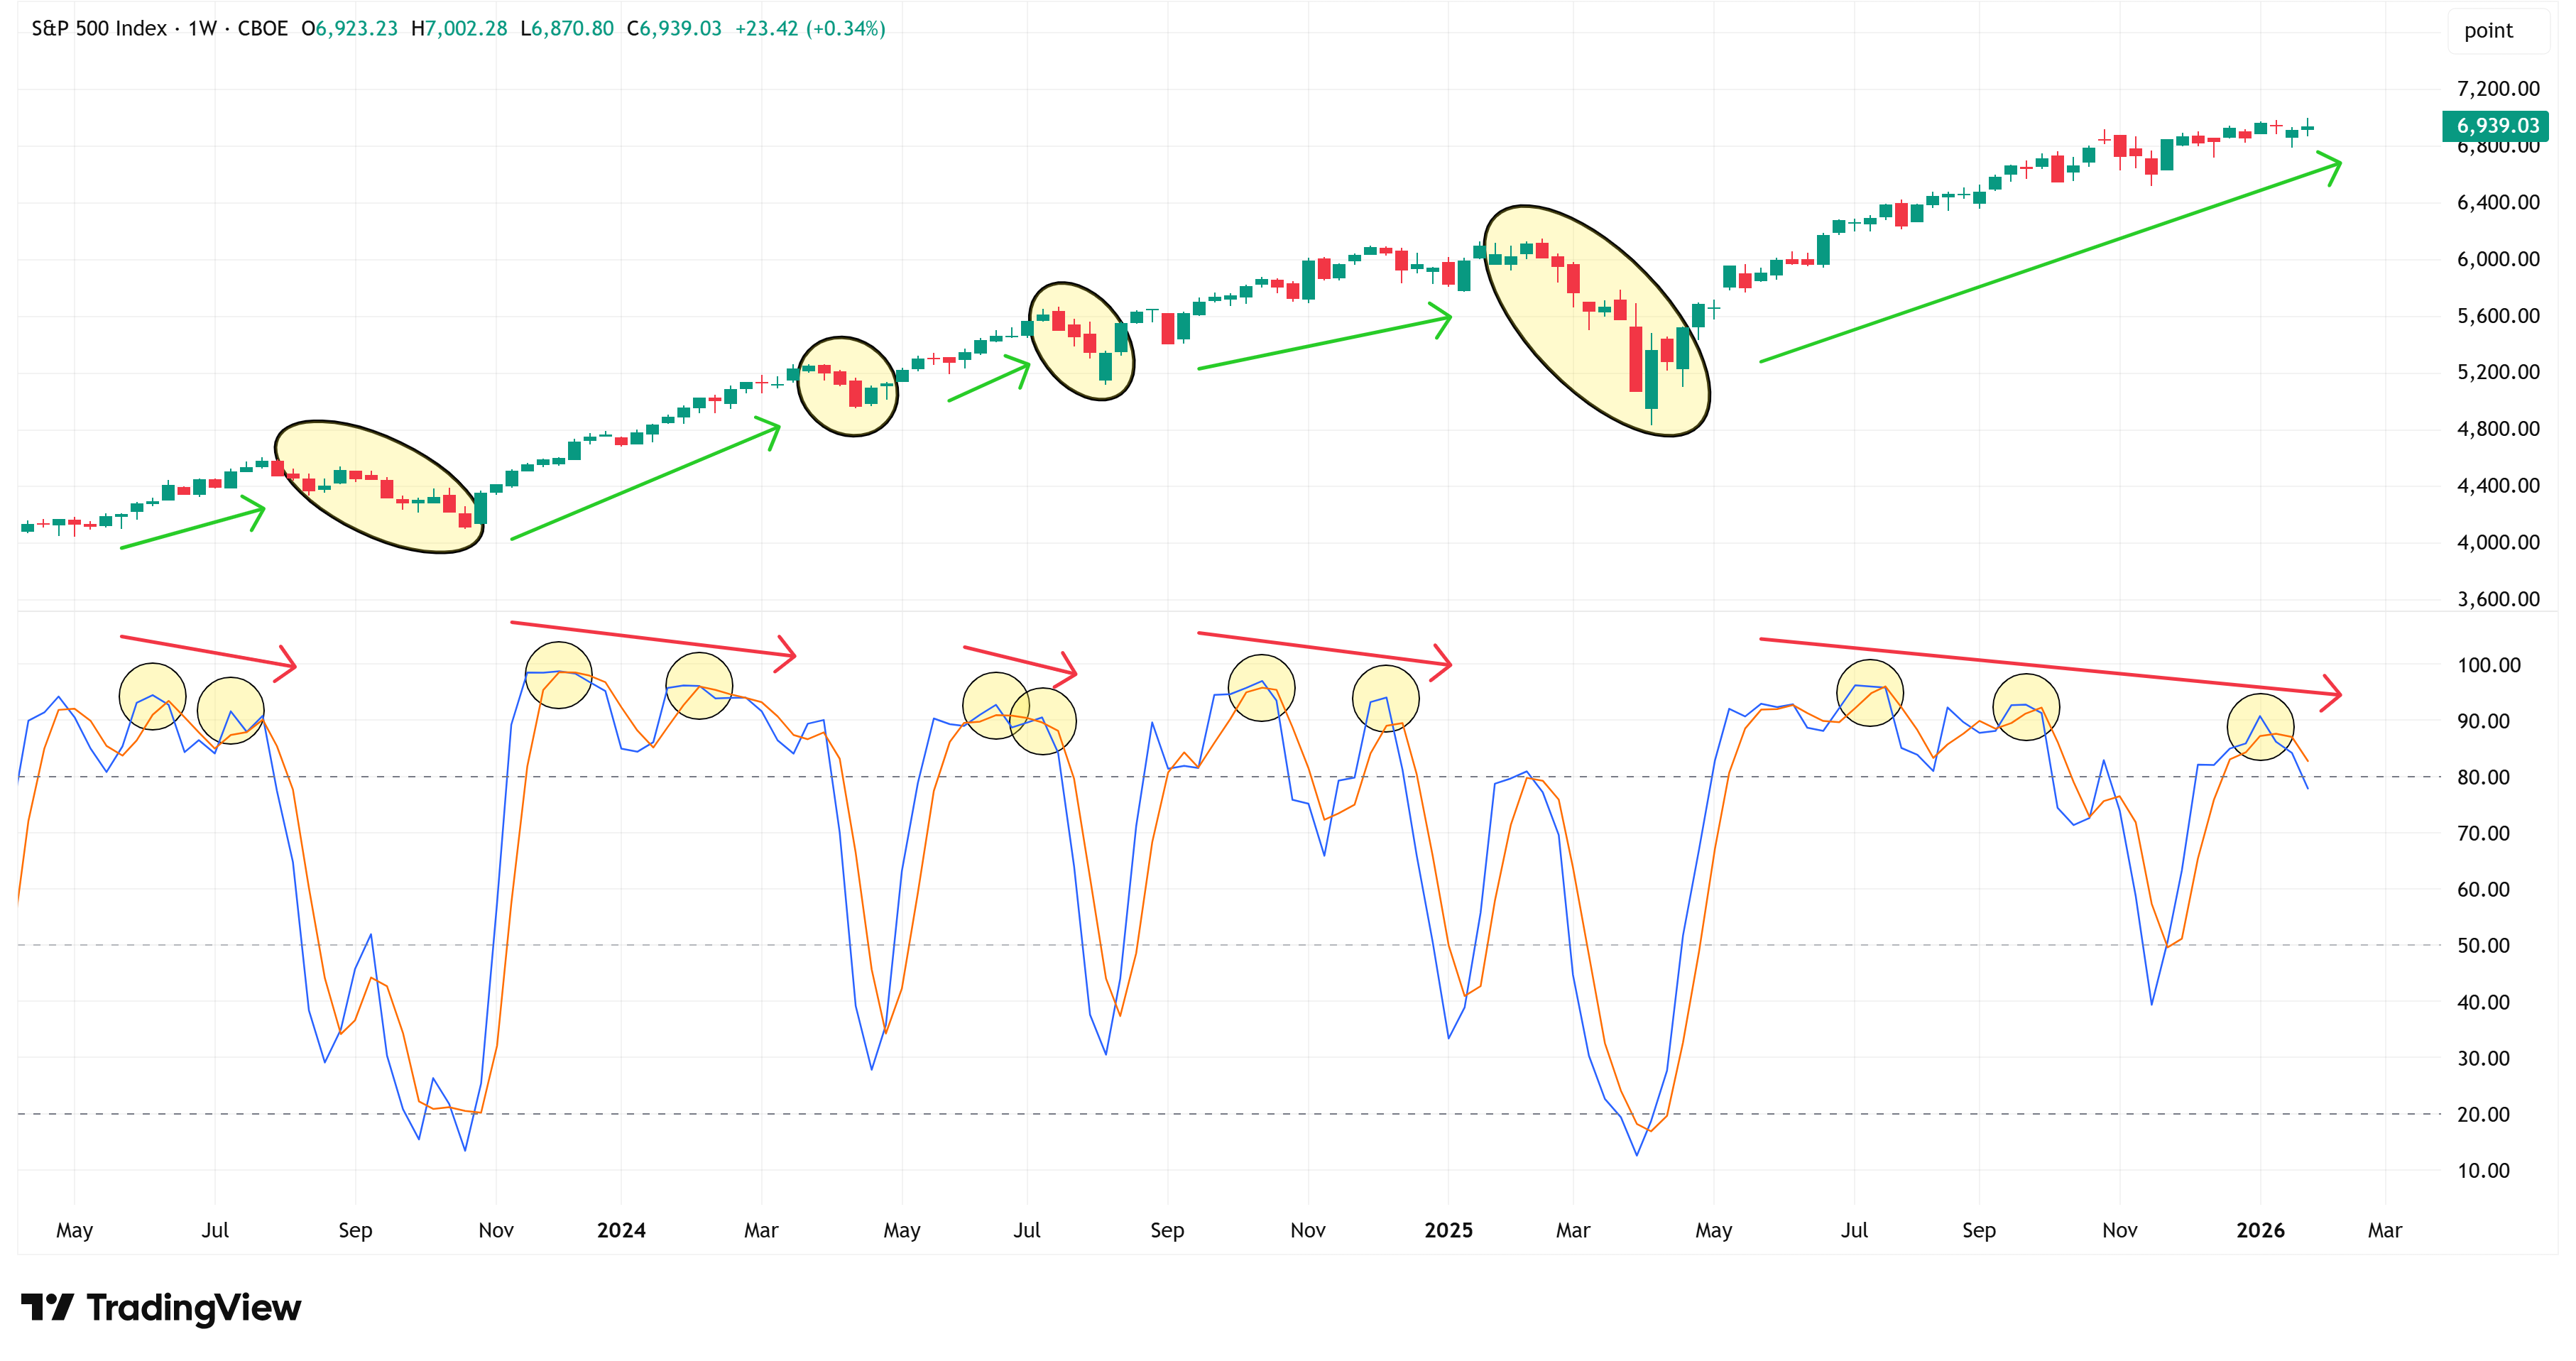
This chart has my attention and suggests that a pullback is coming.
Will it be this week, next week, or even this month? I have no idea, but we are overdue.
Economic Calendar
Last Week
This Week
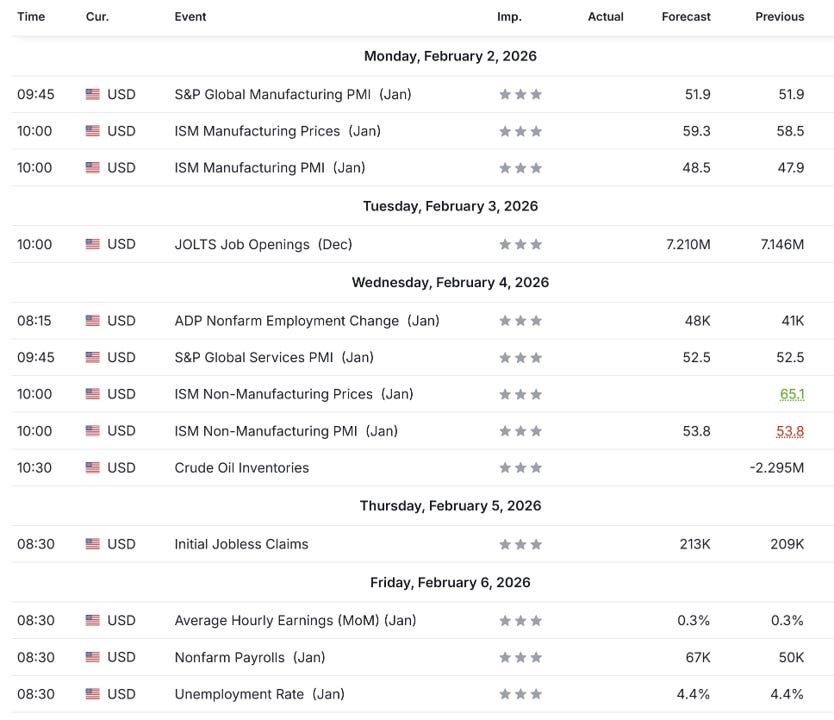
Pay close attention to the Nonfarm Payrolls and Unemployment Rate data coming out on Friday.
Investment Ideas (Paid Section Below)
Year-to-date, our investment ideas have outperformed the S&P 500 by 2.35%.
A 2.35% relative gain through January equates to roughly 32% annualized alpha if sustained.
Would you like to see our investment ideas each week? Become a paid subscriber by clicking on the link below.
The following sections are available only to paid subscribers.
For readers who want to go deeper, we also offer a paid tier.
The Market Map – Elite
Elite subscribers receive everything included in Free, plus full access to our proprietary research, including:
Additional Market Map charts and analysis
A minimum of two investment ideas per month
S&P 500 Fair Value Model
The Market Map tutorials and walkthroughs
And more…
For those who want to learn “The Market Map” methodology, we also offer one-on-one coaching and cohort-based learning for larger groups.
If that is of interest, email jim@skillmangroveresearch.com to inquire.
If you would like exclusive access to our proprietary data, be sure to click on the link below to become a paid subscriber.
Do you have any other feedback?
If so, feel free to reply to this email and let me know!
I read and respond to every email, and I value your opinion!
