
The Market Map
Epic Rally...But Will It Hold?

Hey everyone — it’s Jim.
I hope you had a great weekend!
Let’s jump right into this week’s newsletter…
Proprietary Buy/Sell Indicator - Chart of the Week
You may recall the webinar reminder I sent out last Wednesday, where I showed how I used a “Buy” signal on the weekly NVDA chart as a trigger to buy calls on Monday morning.
That trade generated a 526.13% return in less than two days. If you missed it, you can read it here.
Because I was using a weekly chart for that analysis, the trade didn’t “trigger” until the market closed on Friday, April 10th.
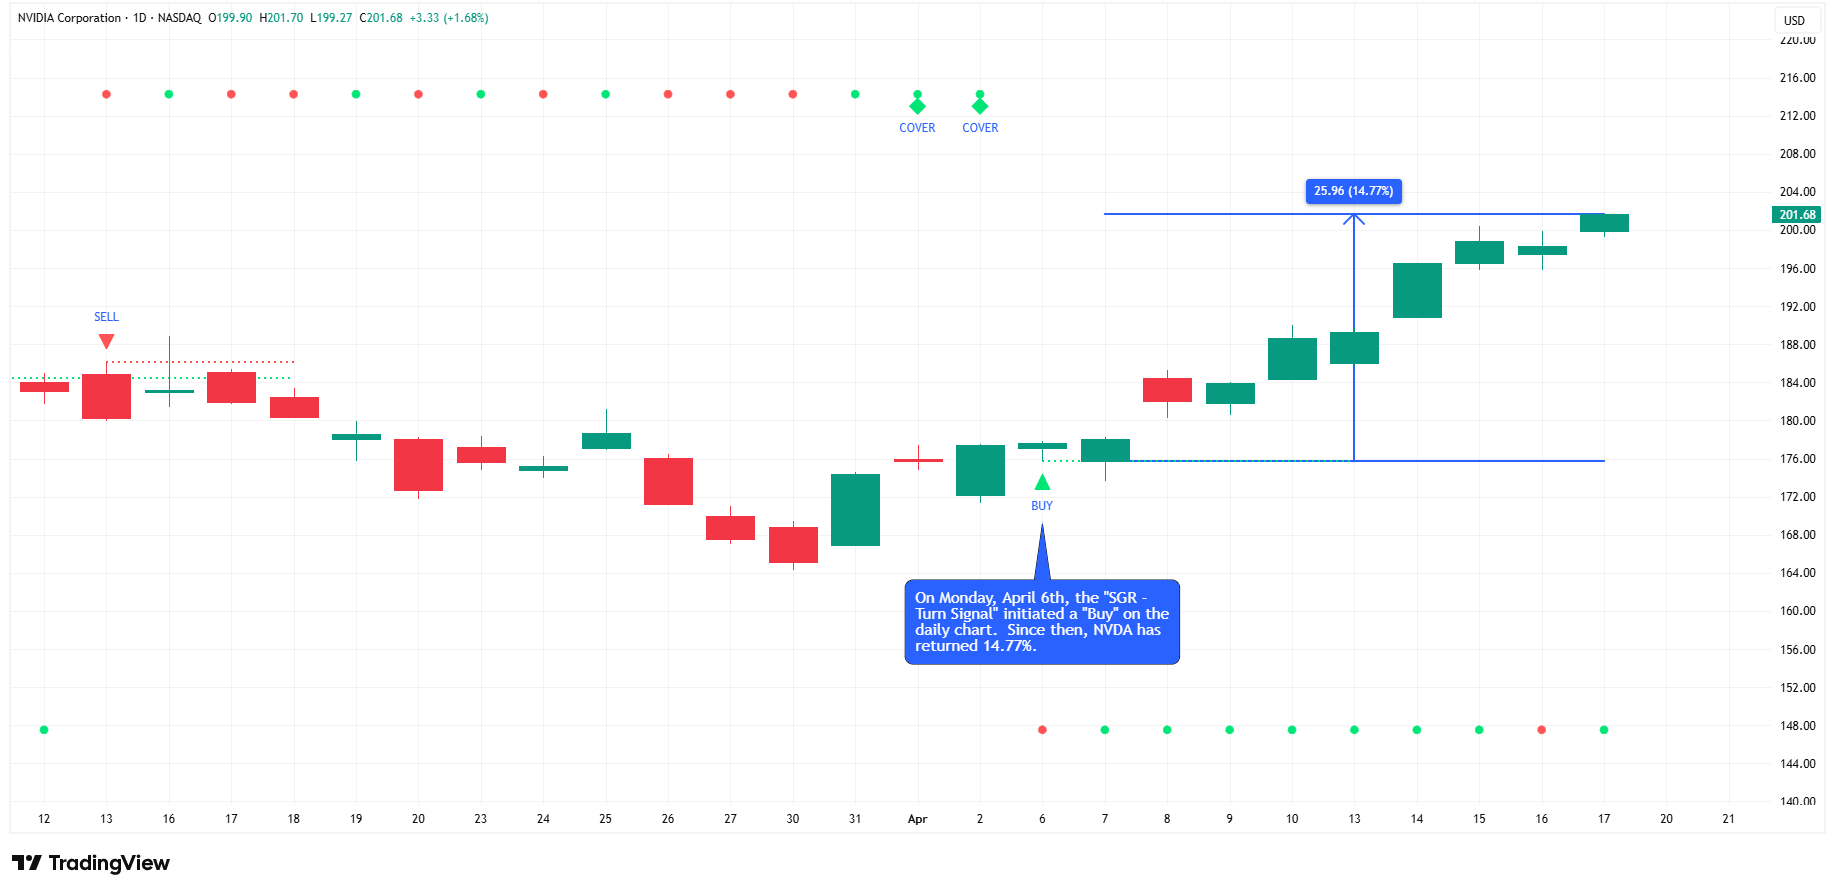
However, if I had scaled down to the daily timeframe, we would have found that the “Buy” signal for NVDA triggered on Monday, April 6th (on the daily chart).
Since then, NVDA has returned 14.77% (see chart below).
This goes to show that the “SGR - Turn Signal” can be used on any time frame, and it is often to your advantage to monitor several time frames to get the best entry and exit signals.
Would your investment process benefit from a tool like this that keeps you ahead of the market?
If so, join us for our next free live webinar this Wednesday, April 22nd, at 7:00 pm ET, where you can learn more about how to get access to our proprietary “Buy/Sell” indicator.
👉 Click here to grab your seat: Webinar Registration
PS: This newsletter grows from your shares. Sharing is free and helps grow our audience so that we can reach more people with this analysis. Would you mind sharing this newsletter with someone you know?
The Market Map
Each week, we break down the S&P 500 using our proprietary systematic process called “The Market Map” to understand where the market may be heading next.
To do that, we start by analyzing the bigger picture (weekly chart) and then look for confirming evidence by shifting to a lower time frame (4-hour chart).
I’m trying something new this week. Click on the “Leave a Comment” button below to let me know what you think.
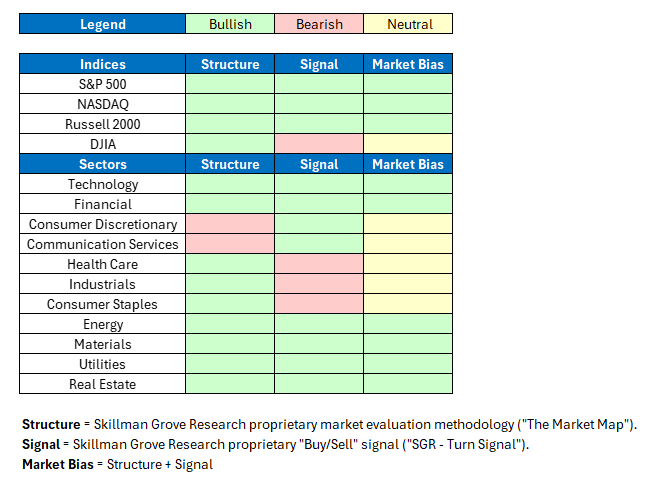
I have been trying to find a quick way to visualize the outputs of “The Market Map” and “SGR - Turn Signal” together, and then combine those outputs to create a Market Bias for each major asset class I follow.
Here is what I’ve come up with. In the example below, I’ll focus on the major US equity indices and the eleven key US equity sectors, but this could easily be expanded to all of the asset classes I cover in the paid section below.
Here are the results:
For those who are new to this newsletter, here’s a quick tutorial on “The Market Map” and the “SGR - Turn Signal”.
Both are proprietary methodologies that I have developed.
“The Market Map” is a systematic way to analyze any market, on any time frame, and determine if the market in question is in a “bullish structure” or a “bearish structure”.
A “bullish structure” would imply that the market is biased to move higher, while a “bearish structure” would imply that the market is biased to move lower.
I do one-on-one and/or cohort-based coaching to teach others this methodology. Email me if you’re interested in learning more.
The “SGR - Turn Signal” is an indicator I have developed (available on the TradingView platform) to determine when to enter or exit a position.
The “SGR - Turn Signal” uses a rules-based proprietary methodology to make these determinations.
Similar to “The Market Map”, the “SGR - Turn Signal” works on any market and on any time frame.
I host a periodic webinar (the next one is this Wednesday) where I provide a more detailed overview of the “SGR - Turn Signal” and how to access it. Click here to register for this week’s webinar.
Taken together, “The Market Map” + “SGR - Turn Signal” becomes a powerful tool to understand the “Market Bias” so that you can stay on the right side of the market.
For instance, the most bullish scenario is a security with a “bullish structure” and a “buy” signal. Conversely, the most bearish scenario is a security with a “bearish structure” and a “sell” signal.
When these are in conflict (i.e., “bullish structure” + “sell” signal or “bearish structure” + “buy” signal), this equates to a neutral stance until the security resolves itself one way or the other.
A couple of caveats:
Just because a security is in a “bullish structure” and on a “buy” signal, does not mean that the security will only move higher. Oftentimes, you can have pullbacks within this type of structure before continuing higher. These pullbacks often create great buying opportunities.
Terrific “buy” signals can (and do) develop from deeply “bearish structures”, and vice versa, but those situations have to be examined much more closely and with proper risk management protocols in place.
Ultimately, the goal of creating and deploying “The Market Map” and “SGR - Turn Signal” is to provide investors with a systematic and unbiased approach to analyzing and investing in the market.
As I like to say:
“Map the market. Make better investment decisions.”
Weekly Chart
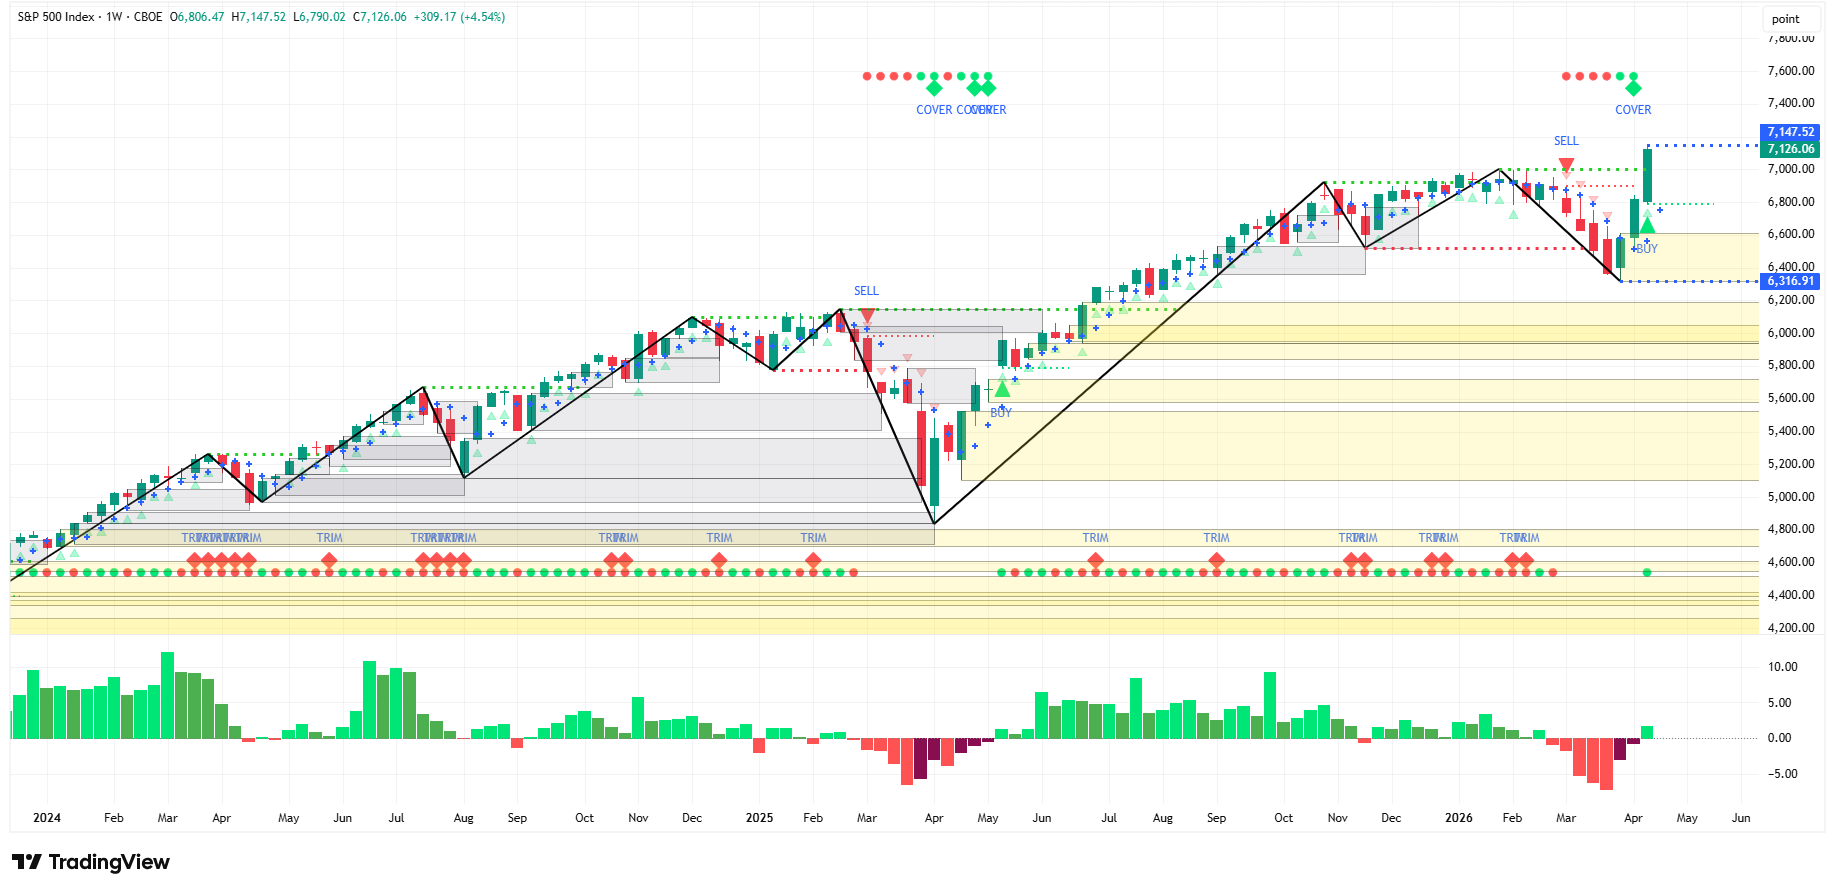
The S&P 500 has rallied 11.89% since its close on Friday, March 27th. Back of the envelope, no compounding, that equates to a ~200% annualized return.
Translation: that’s one heck of a move in three weeks.
With that said, because the S&P 500 closed above 7,002.28, that shifts it from a “bearish structure” to a “bullish structure”.
To add to the bullish case, you’ll see in the chart below that Friday’s close also triggered a “Buy” signal on the weekly chart.
This goes back to what I noted in the section above: this is the most bullish scenario we have (“bullish structure” + “buy” signal).
This is where it becomes important to look at the 4-hour chart for further context.
4-Hour
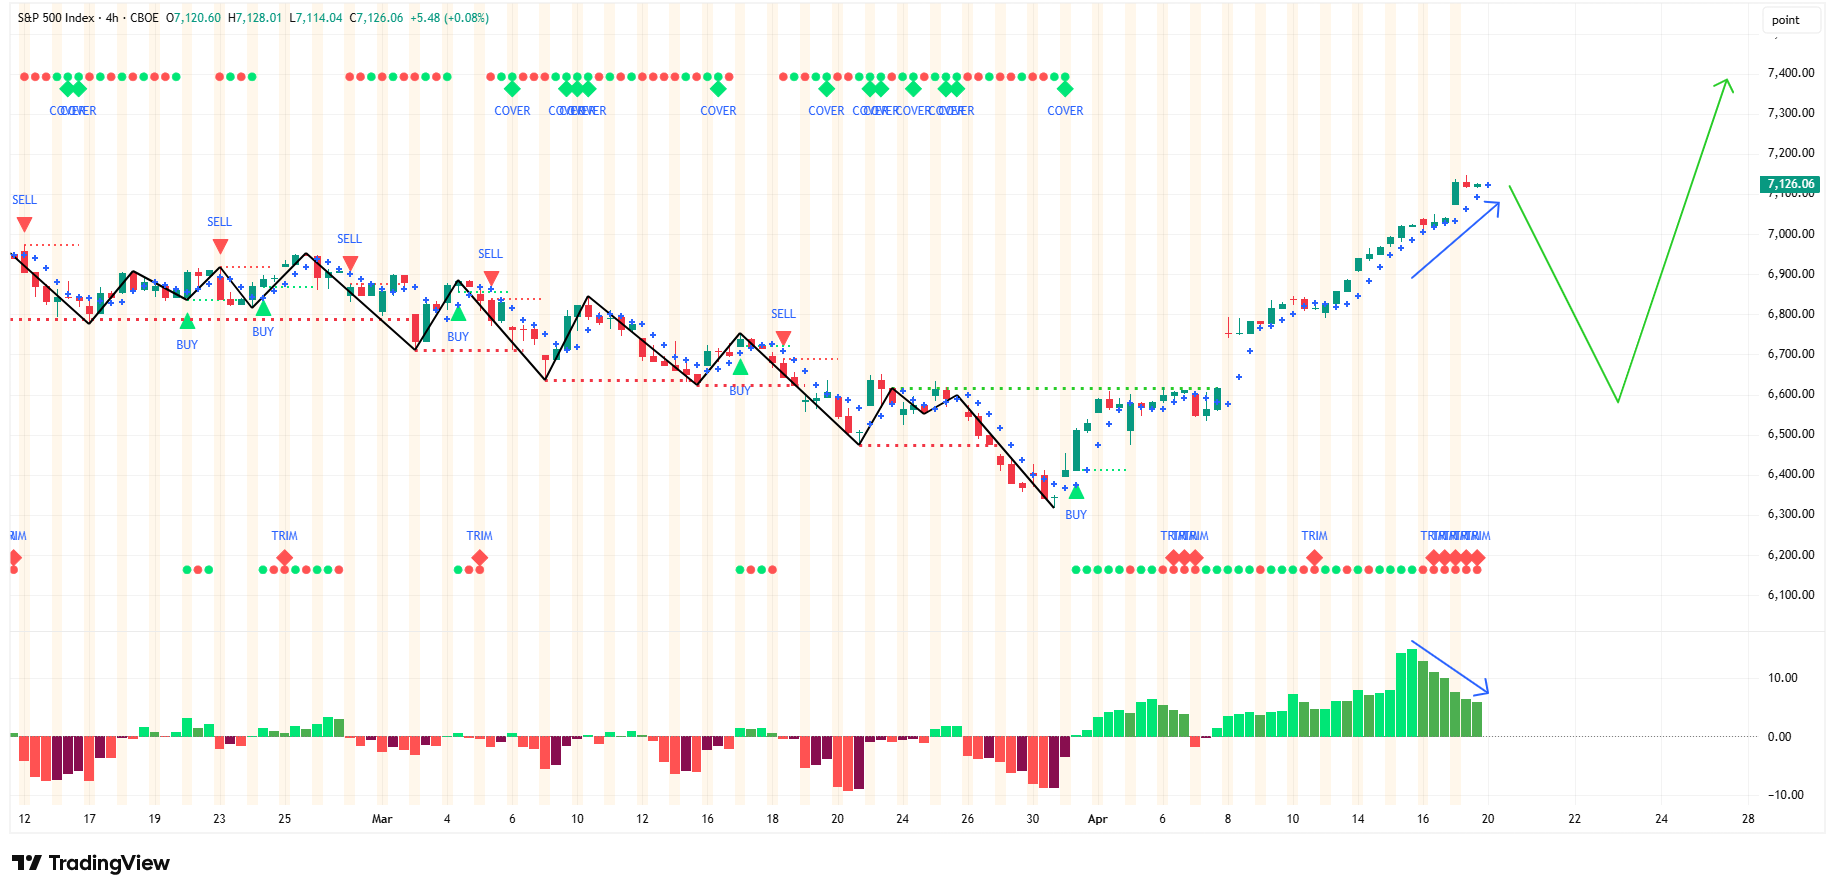
The 4-hour chart shifted from a “bearish structure” to a “bullish structure” on Wednesday, April 8th.
Additionally, a “buy” signal was initiated on Tuesday, March 31st.
Net/net, the 4-hour chart is also in our most bullish scenario (“bullish structure” + “buy” signal).
With that said, I want to point out something to keep an eye on.
Note the blue arrows in the chart below.
The blue arrow just below the price shows the price continuing to move higher.
However, the blue arrow just above our proprietary “SGR - Turn Signal Histogram” shows declining momentum.
This is a classic “negative divergence”.
For those who might not be familiar with the term, this is how Investopedia defines it:
“Divergence in technical analysis occurs when the price of an asset moves in the opposite direction of a related technical indicator or oscillator. It signals that the momentum underlying the price trend is changing, which may foreshadow a potential shift in the trend’s direction.
Negative divergence occurs when prices rise, but the indicator falls, indicating prices might soon decline.”
I think there’s a good chance that we move lower before we move higher over the course of this week.
The green arrow is one possible path.
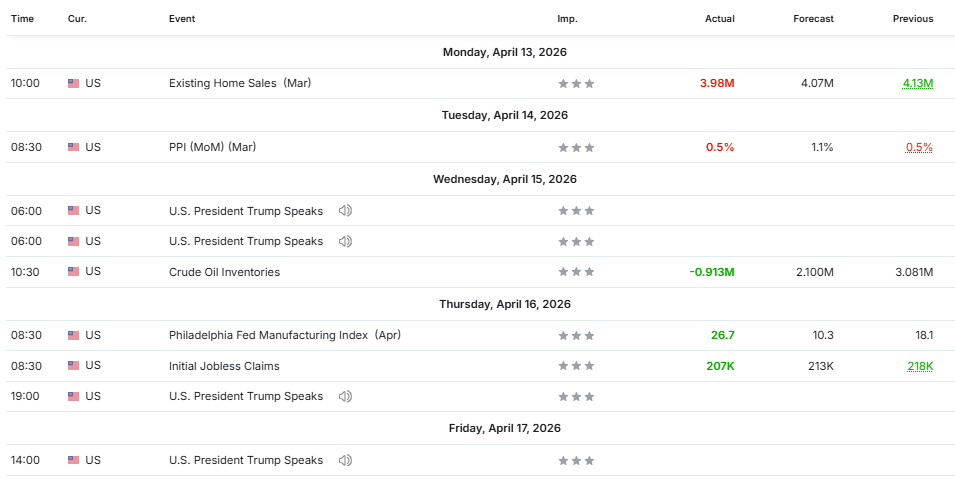
Economic Calendar
Last Week
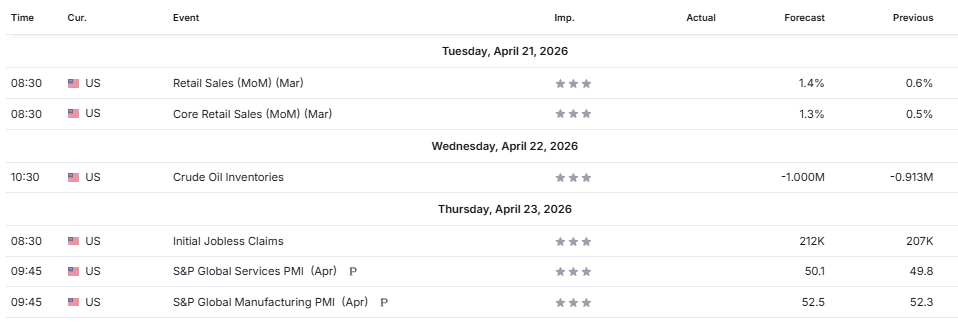
This Week
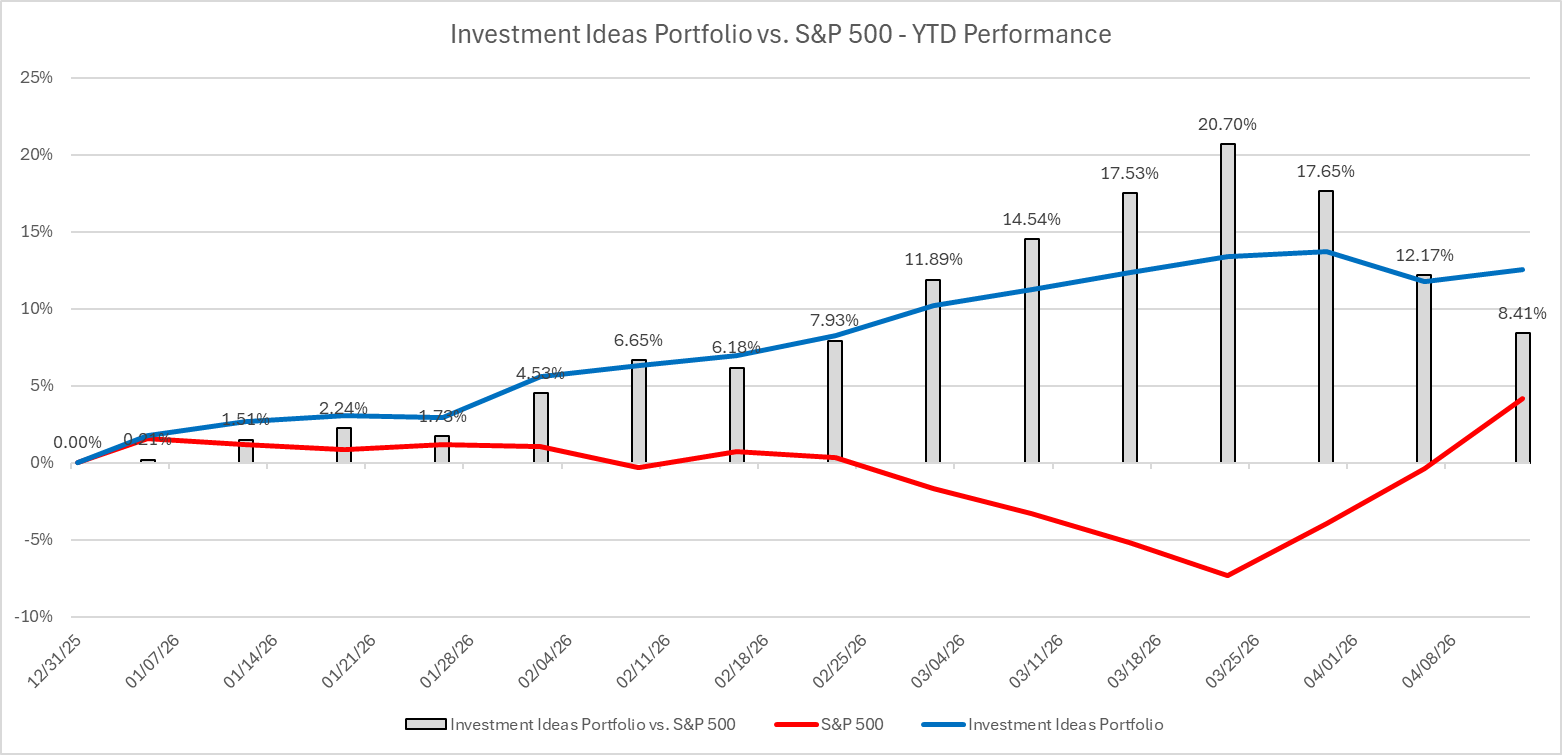
Investment Ideas (Paid Section Below)
Year-to-date, our “Investment Ideas” portfolio has outperformed the S&P 500 by 8.41%.
The following sections are available only to paid subscribers.
For subscribers who want to go deeper, we also offer a paid tier.
The Market Map – Elite
Elite subscribers receive everything included in the Free version, plus full access to our proprietary research, including:
An additional 30+ charts with our “Buy/Sell” signal clearly displayed on each chart covering these major asset classes:
Major Equity Indices
US Equity Sectors
US Treasuries
Currencies
Commodities
Fixed Income
Access to our “Investment Ideas” portfolio selections each week.
Access to our proprietary S&P 500 Fair Value Model.
And more…
For those who want to learn “The Market Map” methodology, we also offer one-on-one coaching and cohort-based learning for larger groups.
If that is of interest, email jim@skillmangroveresearch.com to inquire.
If you would like exclusive access to our proprietary data, be sure to click on the link below to become a paid subscriber.
Do you have any other comments or suggestions?
If so, feel free to “leave a comment” by clicking the button below or email me directly at jim@skillmangroveresearch.com.
