
The Market Map
Contagion Watch: Credit & Crude...

Hey everyone — it’s Jim.
I hope you had a great weekend!
We have entered into a very fluid situation with the US/Iranian news over the weekend.
With that said, please do not hesitate to reach out with any questions you may have, as things are moving quickly.
Proprietary Buy/Sell Indicator
Last week, I highlighted how we can use our new proprietary “Buy/Sell” indicator not only on an individual basis but on a relative performance basis as well.
Specifically, we looked at the Communications Sector (XLC) vs. the S&P 500 (SPY) on the daily time frame.
If you recall, I noted that XLC had triggered a “Buy” signal on a standalone basis, and as compared to SPY.
I made this comment:
“Taken together, this is a strong indication that the Communications Sector may outperform the S&P 500 over the short to medium term.”
If we look at last week’s performance, we see the following week-over-week returns:
Communications Sector (XLC) = +1.07%
S&P 500 (SPY) = -0.50%
This equates to 157 basis points of outperformance in 5 trading days, and we were able to flag this trade before the week began by spending less than five minutes flipping through the charts on our watchlist.
Here is the XLC chart, which shows performance through last Friday (note the “Buy” signal from February 20th):

If you’d like to learn more about how you can do this level analysis on your own portfolio, I would like to personally invite you to join our free live webinar this Thursday, March 5th, at 7:00 pm ET.
Click here to register 👉: March 5th Webinar Registration
The Market Map
Each week, we break down the S&P 500 using our proprietary systematic process called “The Market Map” to understand where the market may be heading next.
To do that, we start by analyzing the bigger picture (weekly chart) and then look for confirming evidence by shifting to the lower time frame (4-hour chart).
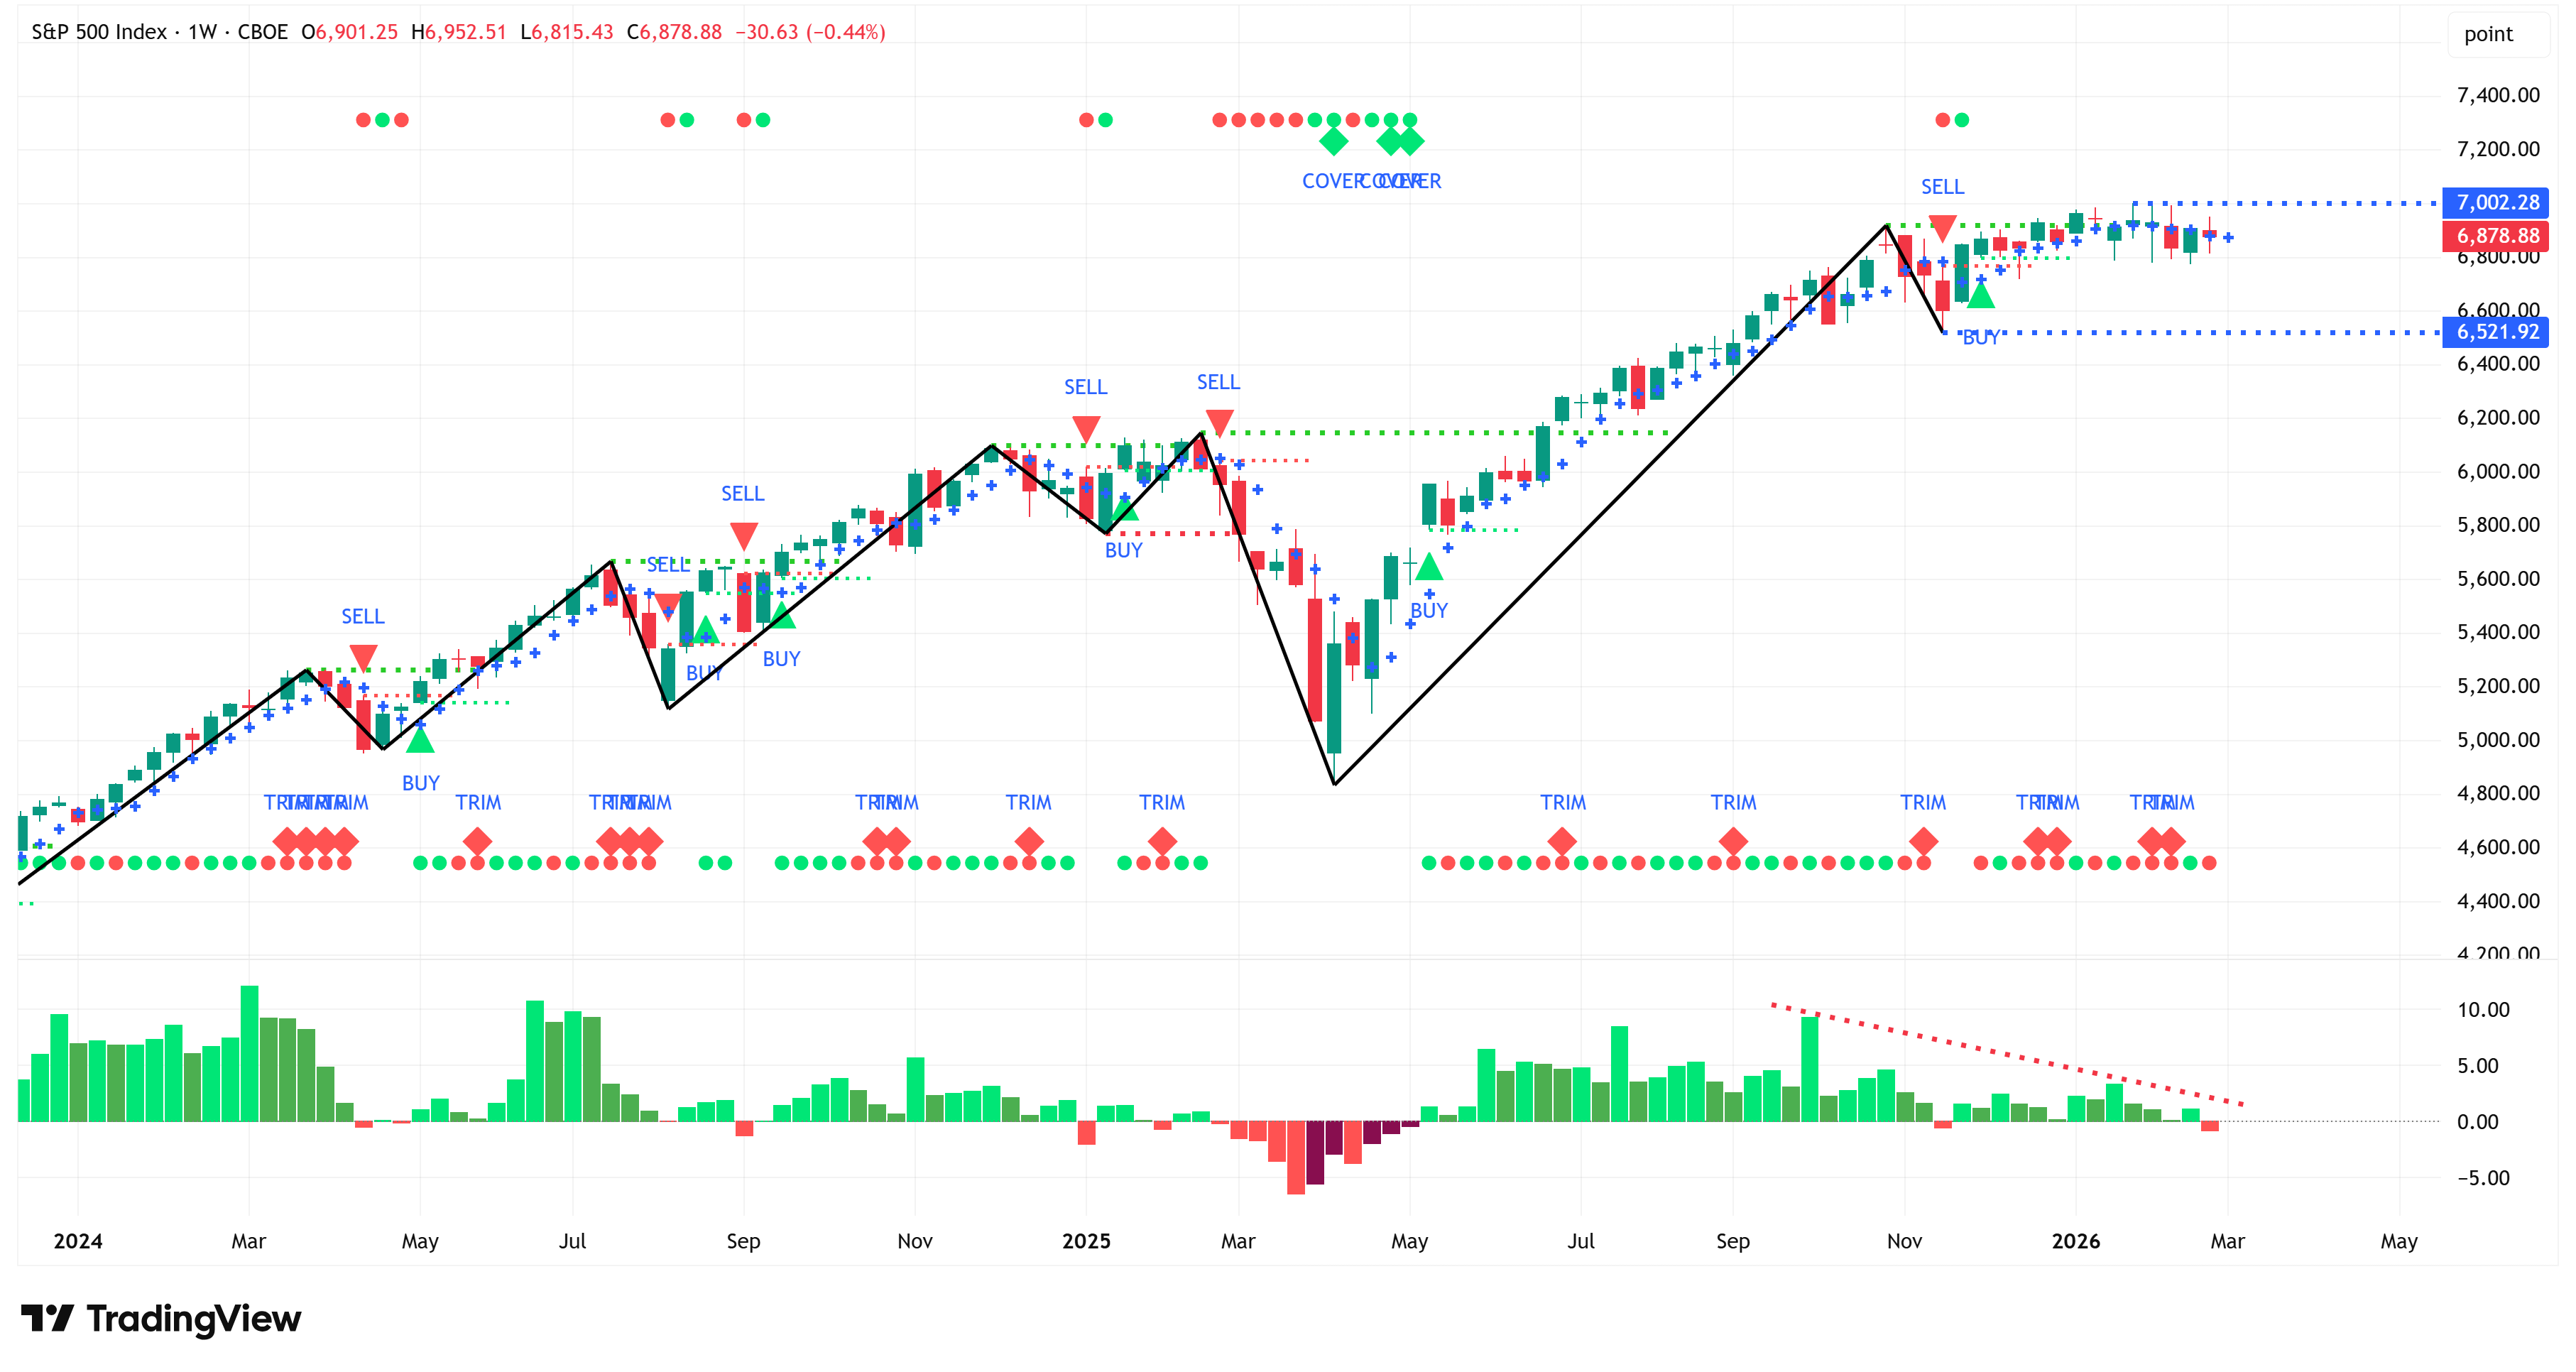
Weekly Chart
Regular readers know that I have been “troubled” by the S&P 500’s lack of momentum as measured by our proprietary momentum histogram (bottom panel of the chart).
Last week, I said:
“I continue to be troubled by the declining momentum (bottom panel).
If the S&P 500 is going to break out, we’ve got to see momentum improve and ideally eclipse the downward trendline I’ve drawn in the bottom panel.”
Notice in the chart below that our momentum indicator has now turned negative.
This is not a good look for the S&P 500.
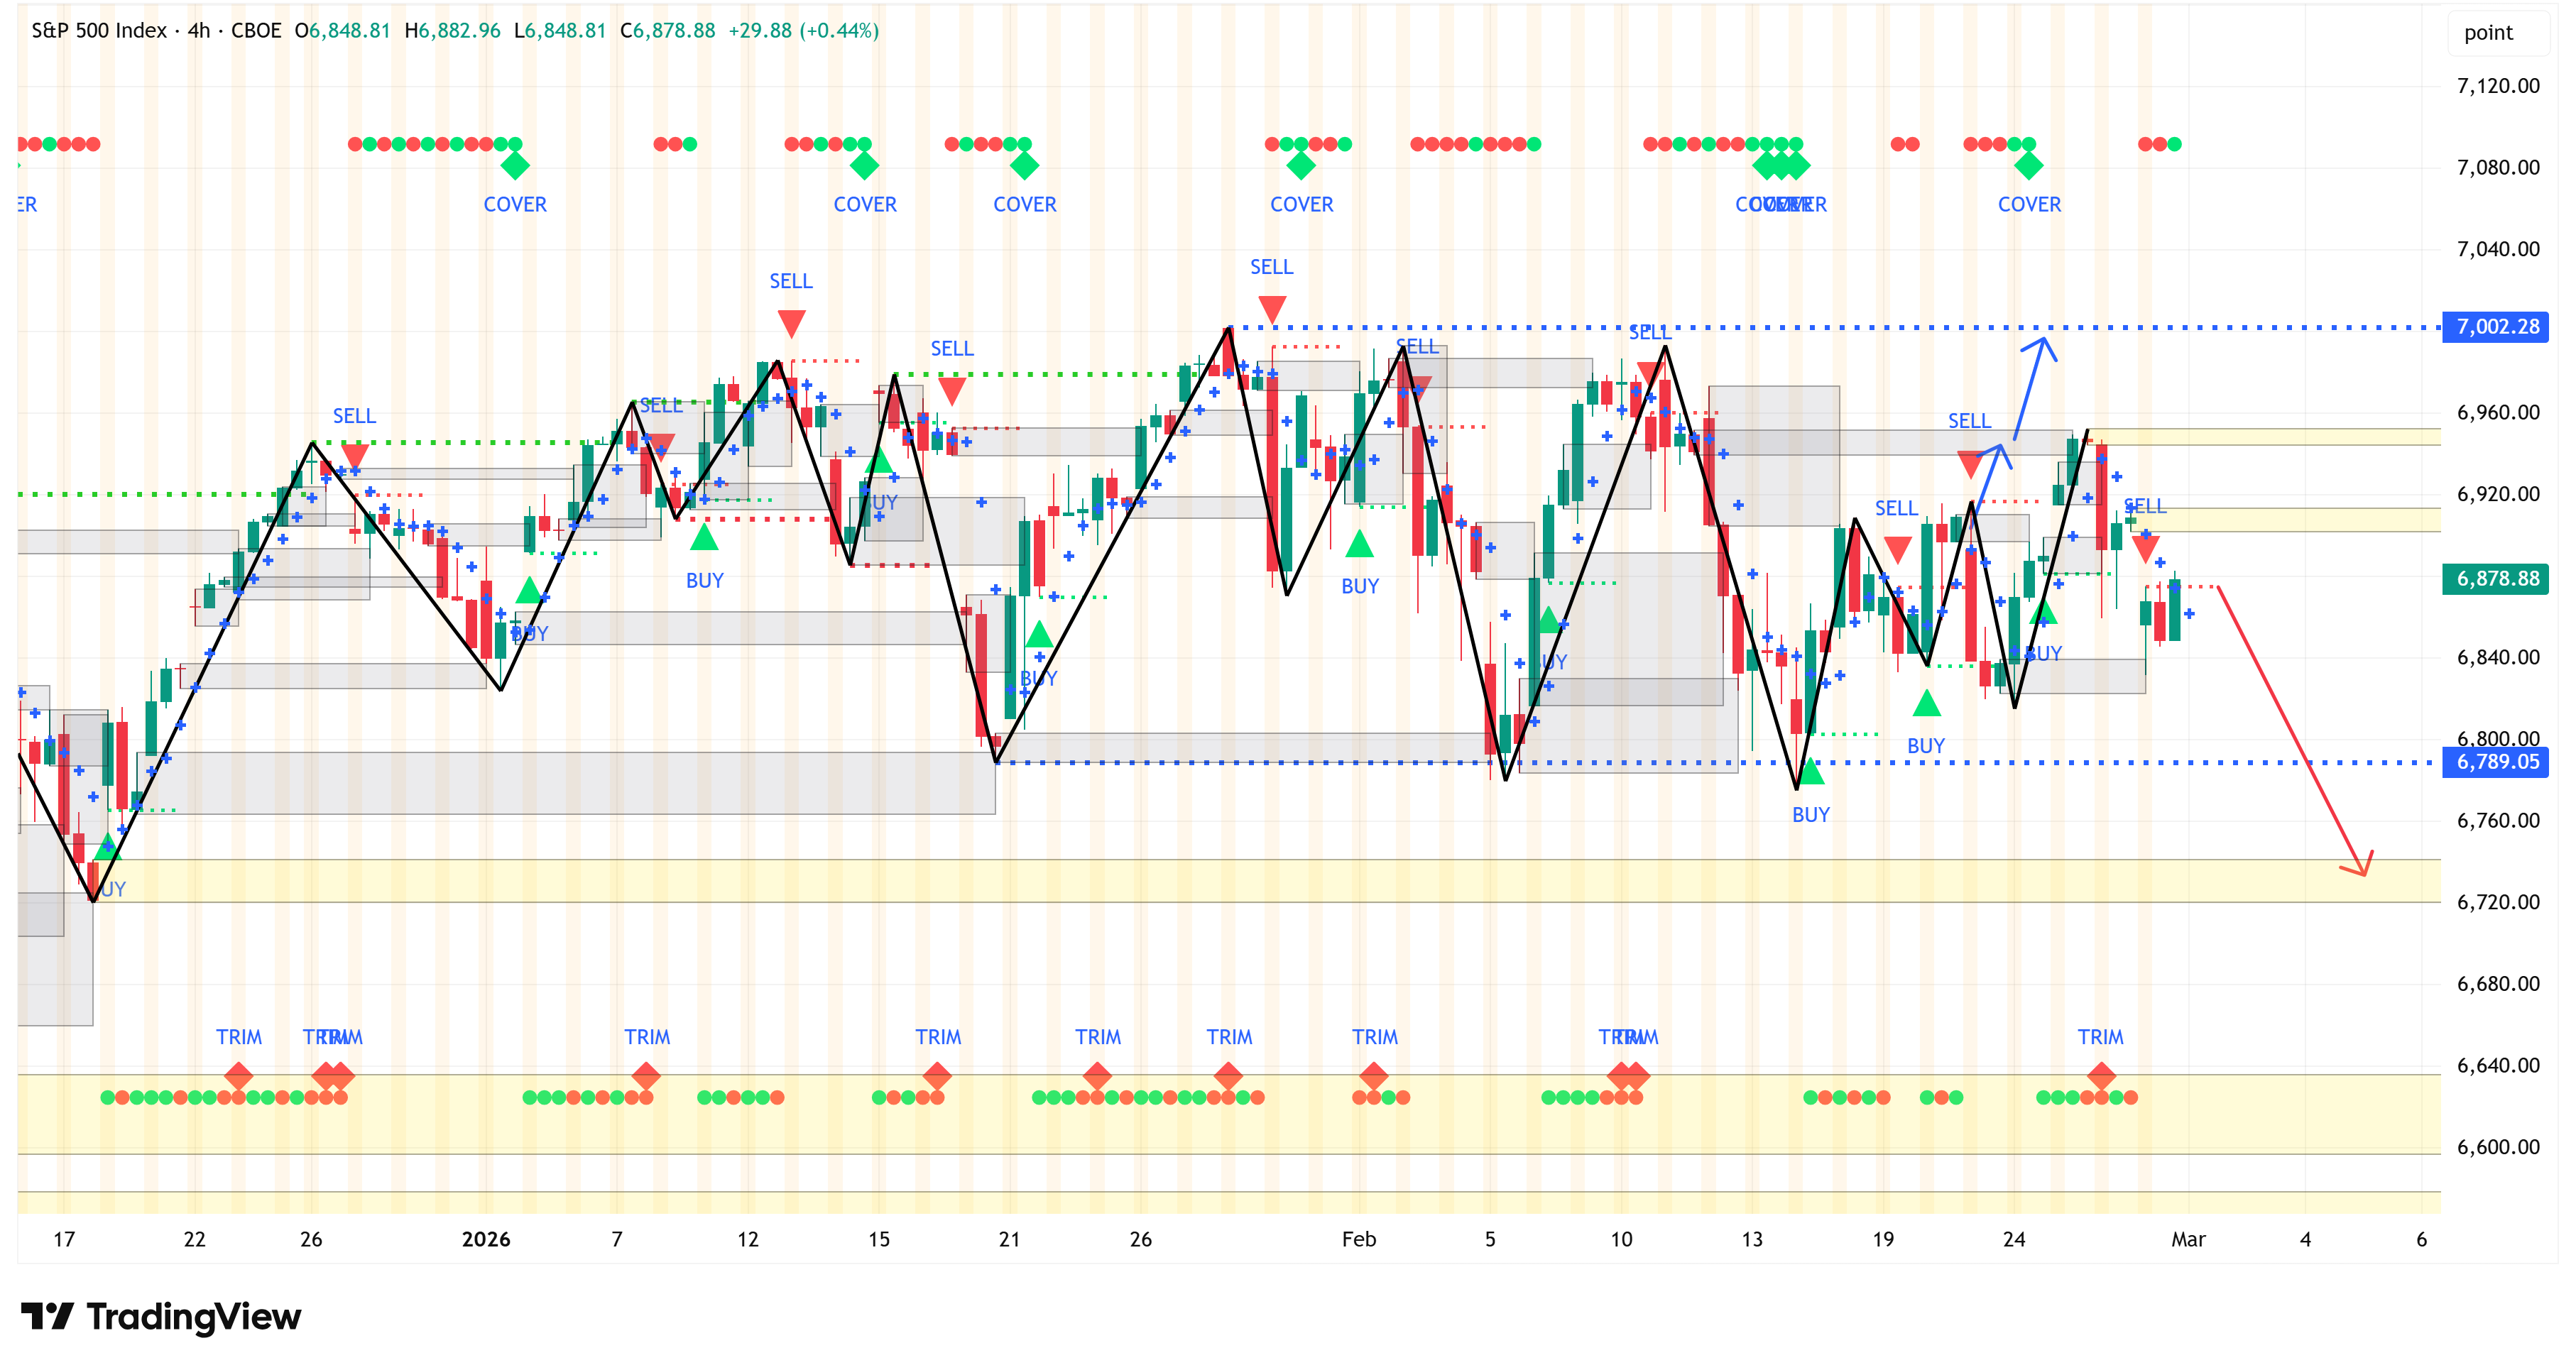
4-Hour Chart
Turning to the 4-hour chart, last week I said:
“I bet we take out the yellow box this week and then move directionally towards the 4-hour swing high value of 7,002.28.”
The S&P 500 did take out the yellow box as advertised, but we did not get the push towards 7,002.28 that I was hoping for.
With momentum flipping on the weekly chart and the 4-hour chart unable to continue pushing higher after taking out the yellow box, we should start looking at the 6,720 - 6,742 range as a possible target zone (red arrow).
Summary
The bulls need the S&P 500 to get in gear and to do so pretty quickly.
If the 4-hour chart closes below 6,789.05, this will flip the 4-hour chart from a “bullish structure” to a “bearish structure,” which will put more pressure on the weekly chart.
I don’t view this as an opportunity for adding risk; in fact, I see it as the opposite.
It may be a good time to think about adding protection and/or other measures to guard against a continued move lower.
Contagion Watch: Credit & Crude…
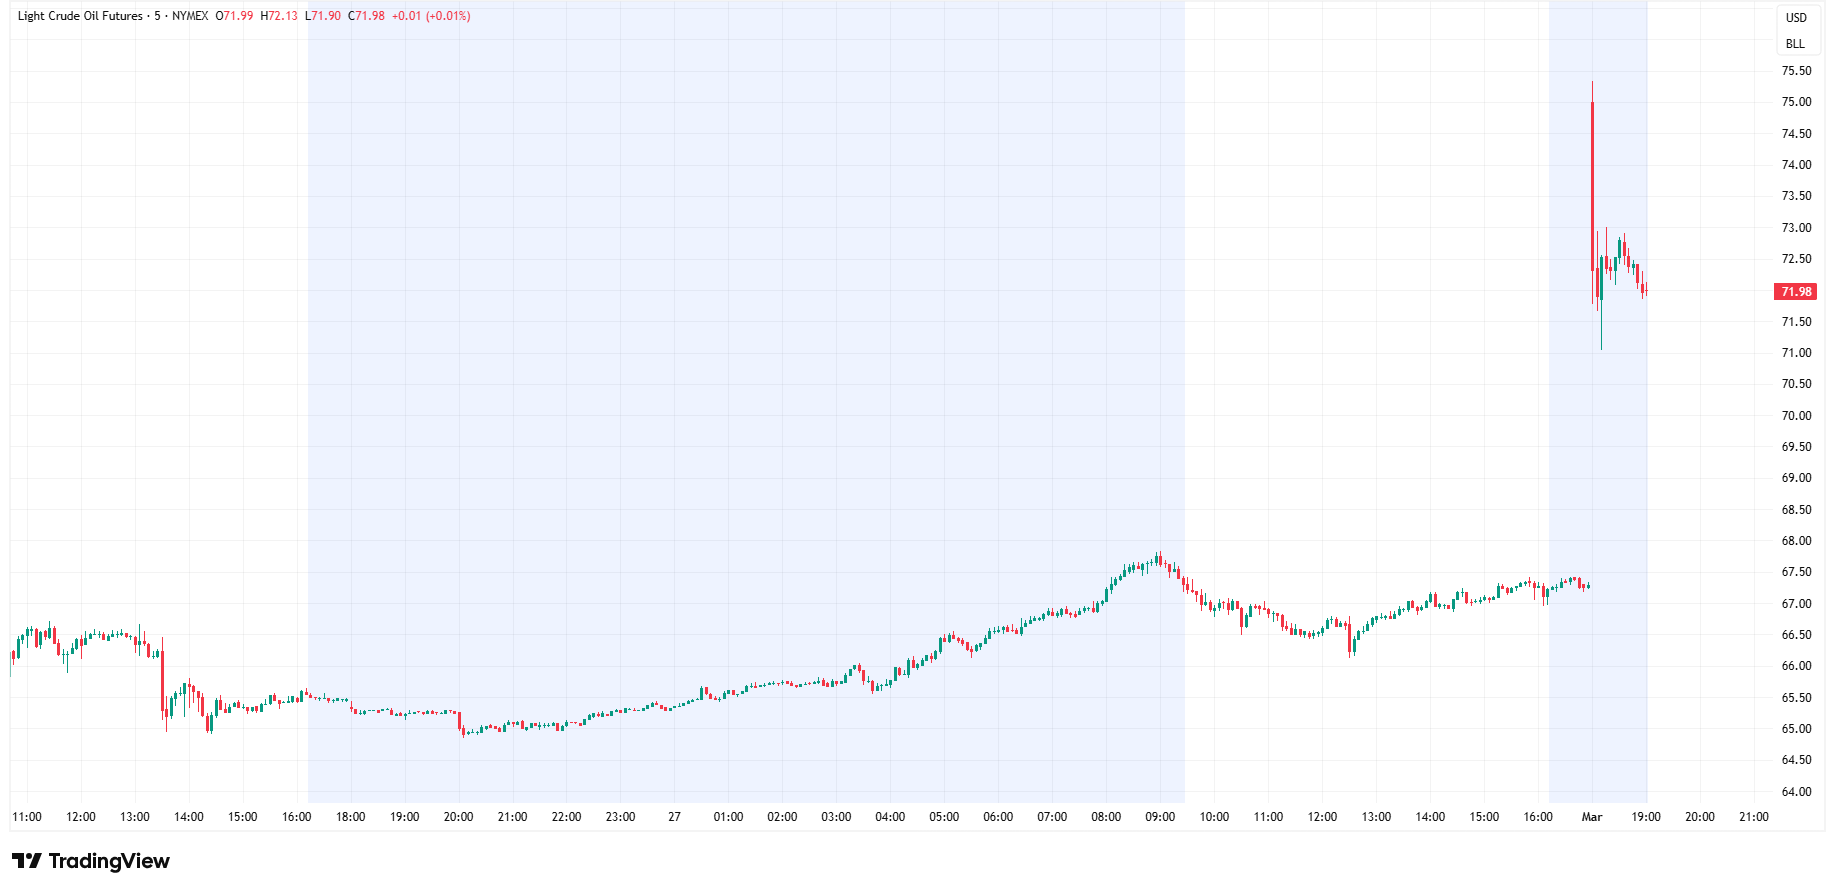
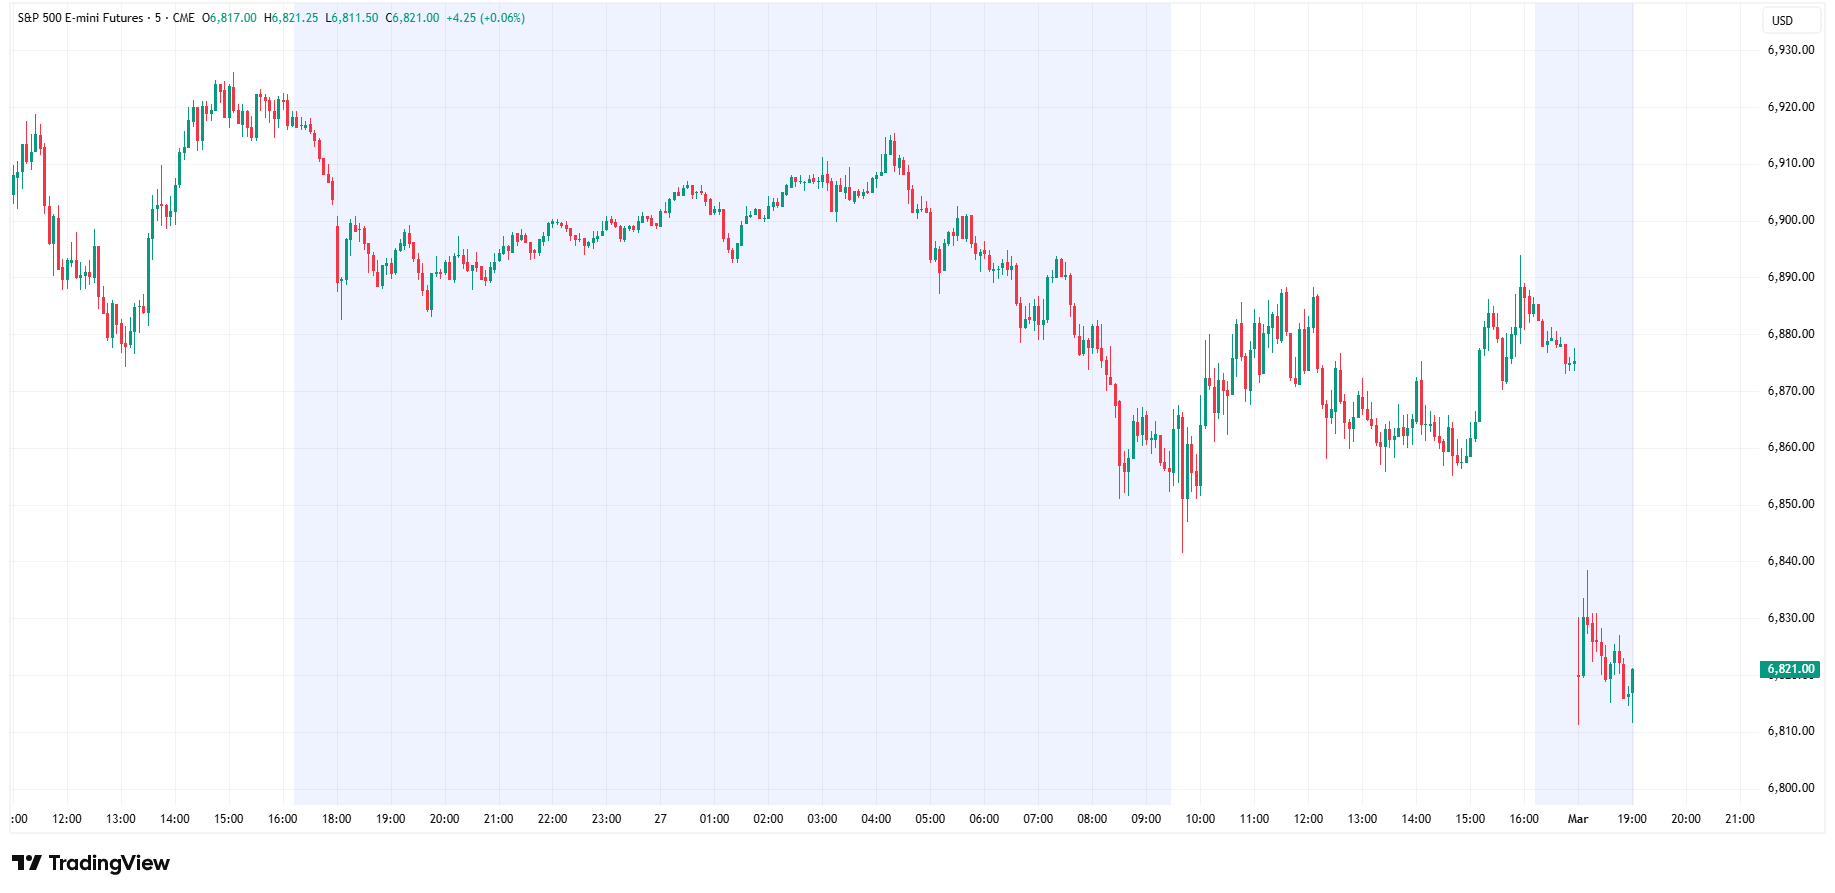
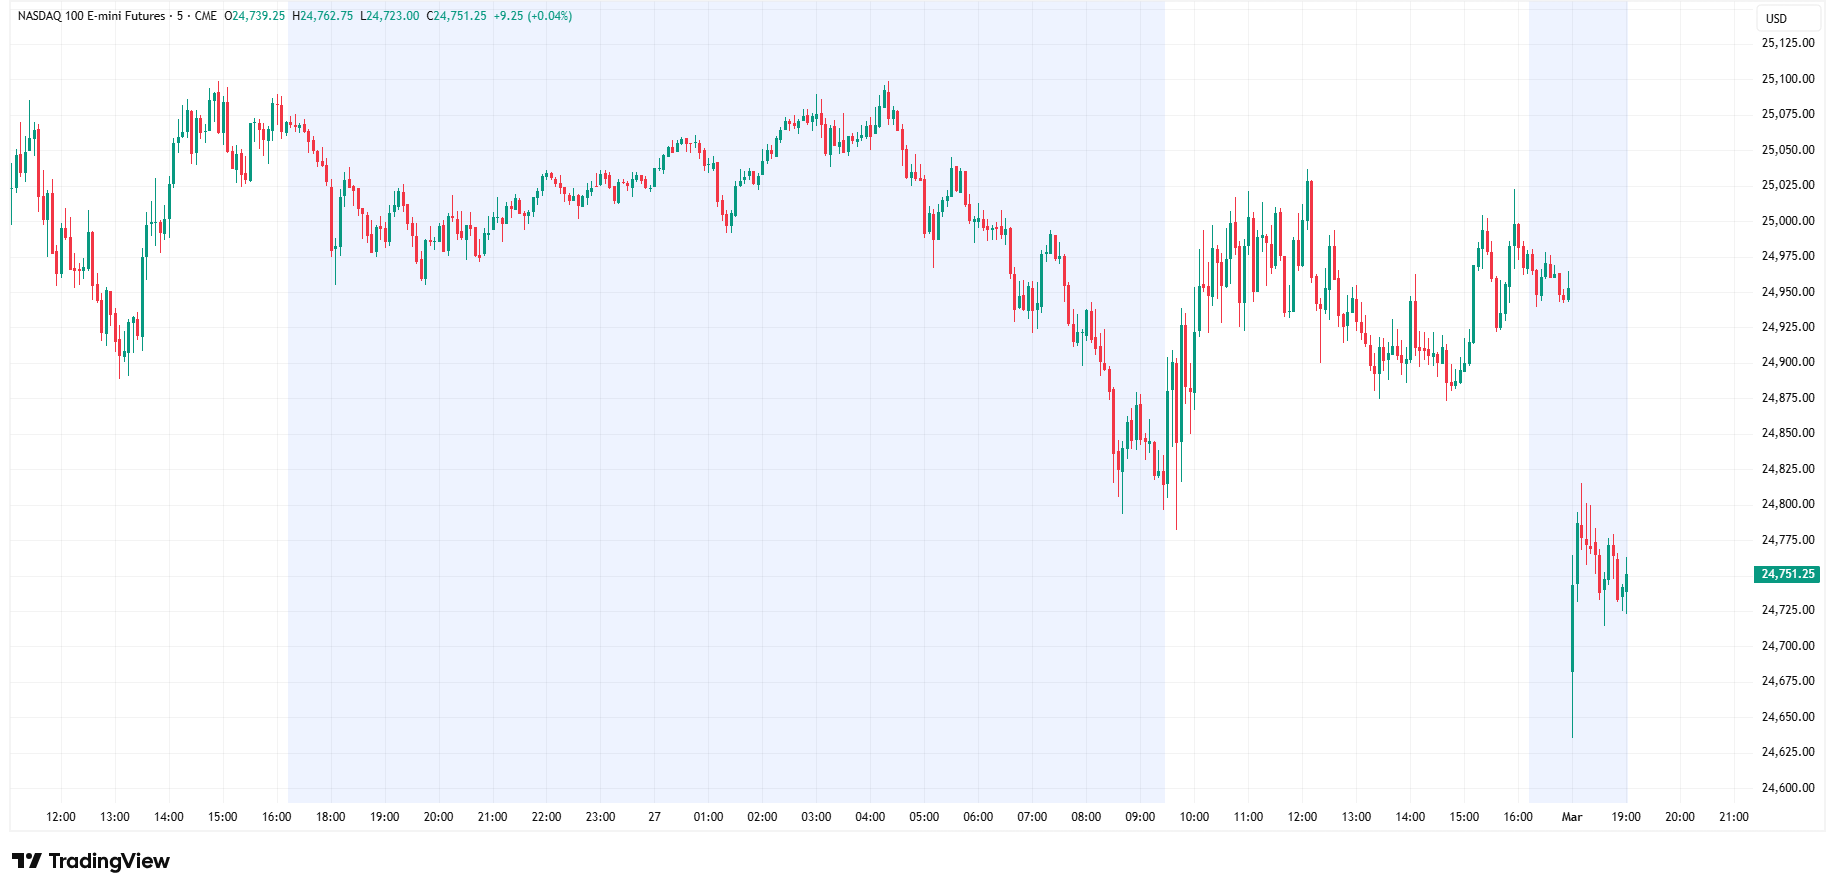
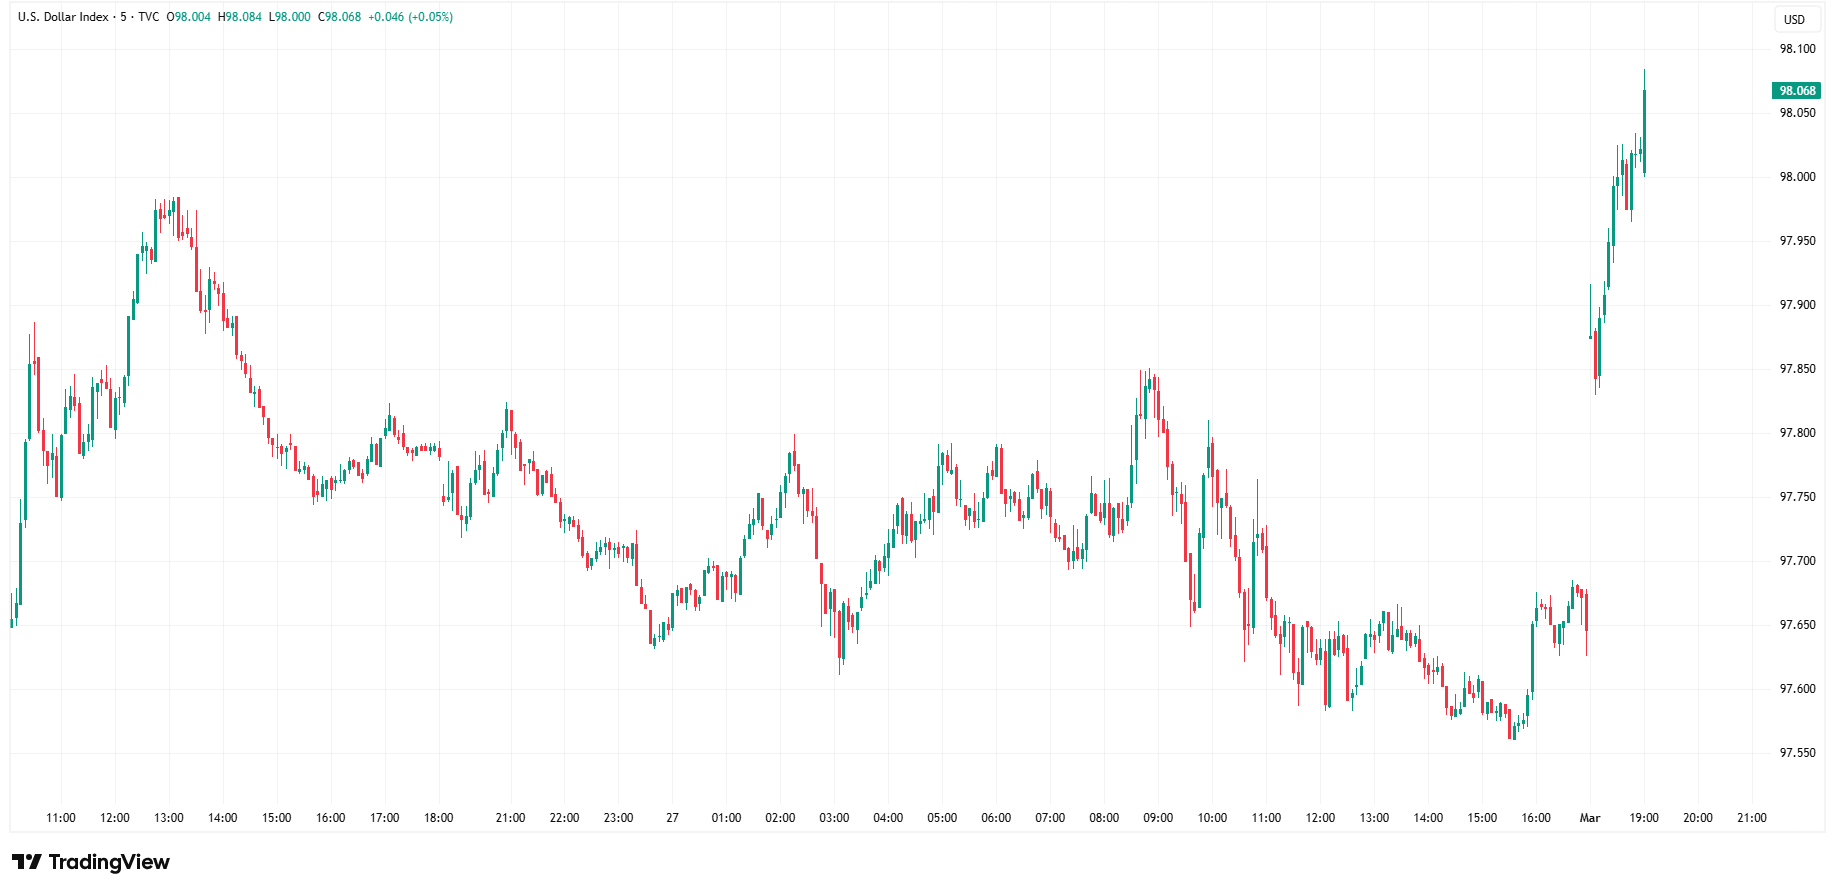
Here are a couple of charts to show the initial price action after the US/Iranian news this weekend.
Crude (WTI)
S&P 500
NASDAQ
US Dollar (DXY)
🚨 Contagion Watch: Credit & Crude
Two separate pressure points are developing in the market — and both share the same risk: spillover.
One sits inside the credit system.
The other sits in global energy logistics.
Neither is a full-blown crisis, but both deserve attention.
1️⃣ Private Credit — From Liquidity Stress to Default Risk
Last week, we flagged private credit as a yellow flag.
This week, the narrative has shifted from structural concern to rising credit risk.
What’s changed?
Major strategists are now openly discussing materially higher default rates in private credit under stress scenarios.
BDCs have begun selling assets at discounts to raise liquidity.
A London-based nonbank lender collapsed amid alleged collateral shortfalls and double-pledging concerns.
Several major banks and asset managers now have visible exposure.
The key shift is this:
We are moving from liquidity mechanics toward credit deterioration.
For over a decade, private credit expanded during:
Zero interest rate policy
Yield-starved institutional capital
Covenant-light underwriting
Aggressive sector concentration (notably software/tech)
What we have not yet experienced is a true cyclical shakeout.
If refinancing windows narrow or earnings weaken — especially in AI-exposed software borrowers — default risk becomes less theoretical.
The Contagion Pathway
If private credit stress continues, the waterfall is likely along these lines:
Private lenders → BDCs → Asset managers → Funding banks/insurers → Leveraged loan & HY markets
At that point, spreads widen. Financing costs rise. Corporate activity slows.
That’s how credit tightening feeds into the real economy.
What to Watch
If contagion builds, it will show up here first:
High Yield spreads (OAS)
Leveraged loan ETFs (BKLN, SRLN)
HY ETF (HYG)
Private credit equity proxies (OWL, APO, BX, ARES)
Regional banks (KRE)
We are not seeing systemic panic, but we are seeing early-stage stress.
2️⃣ Oil Shock Risk — The Strait of Hormuz Variable
Over the weekend, U.S./Iran tensions escalated, and markets immediately priced in additional geopolitical risk premium into crude.
The center of gravity is the Strait of Hormuz, which transports roughly 20% of global petroleum liquids consumption.
This is not just about Iranian production, it’s about deliverability.
Even partial disruption affects:
Tanker traffic
War-risk insurance
Shipping routes
Refined product balances
This is how a regional conflict becomes a global macro issue.
How High Can Oil Go?
Oil’s path from here depends on duration.
Short-lived disruption
After spiking, the risk premium will begin to stabilize
Brent holds low to mid-$80s
Prolonged disruption
$90–$100+ becomes plausible quickly
Refined products spike
If oil remains elevated:
Inflation expectations firm
Rate cuts get delayed
Real yields stay restrictive
Risk assets feel pressure
What to Watch
Brent & WTI front month
Gasoline & diesel
10-Year Treasury yield
Inflation breakevens
Credit spreads
Energy volatility can transmit into broader financial conditions faster than expected.
🎯 Bottom Line
We are seeing early stress in:
• Credit plumbing
• Energy logistics
Both represent pressure points that have the potential to expand.
Markets rarely break from a single event.
They break when multiple stress channels begin reinforcing each other.
Right now, we’re watching two of them.
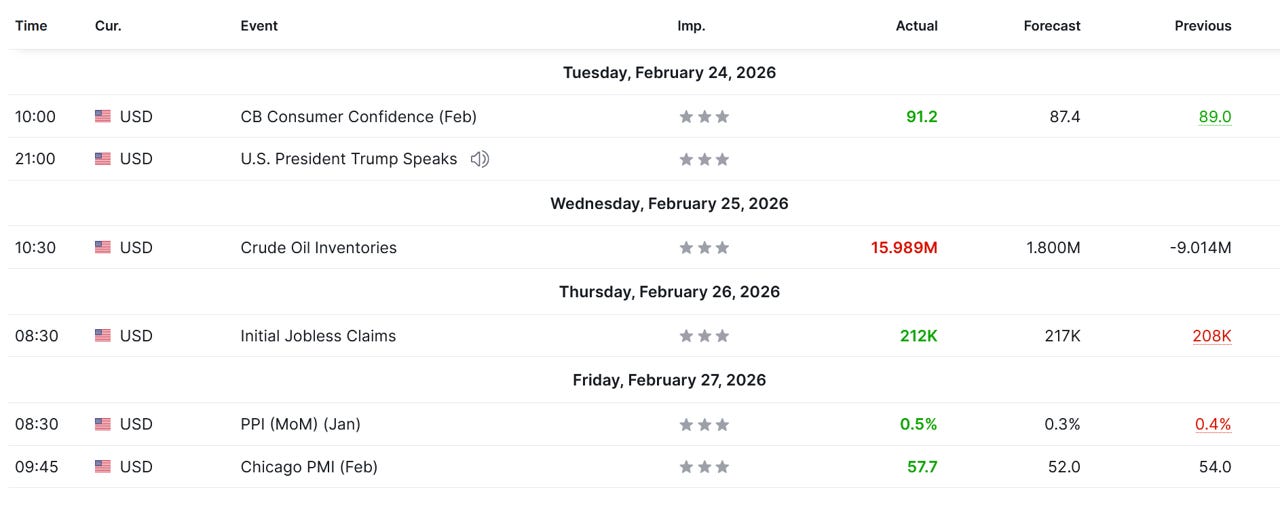
Economic Calendar
Last Week
We saw a nice rebound in Consumer Confidence last week, but PPI came in hotter than expected across the board, which suggests inflation may not be dead.
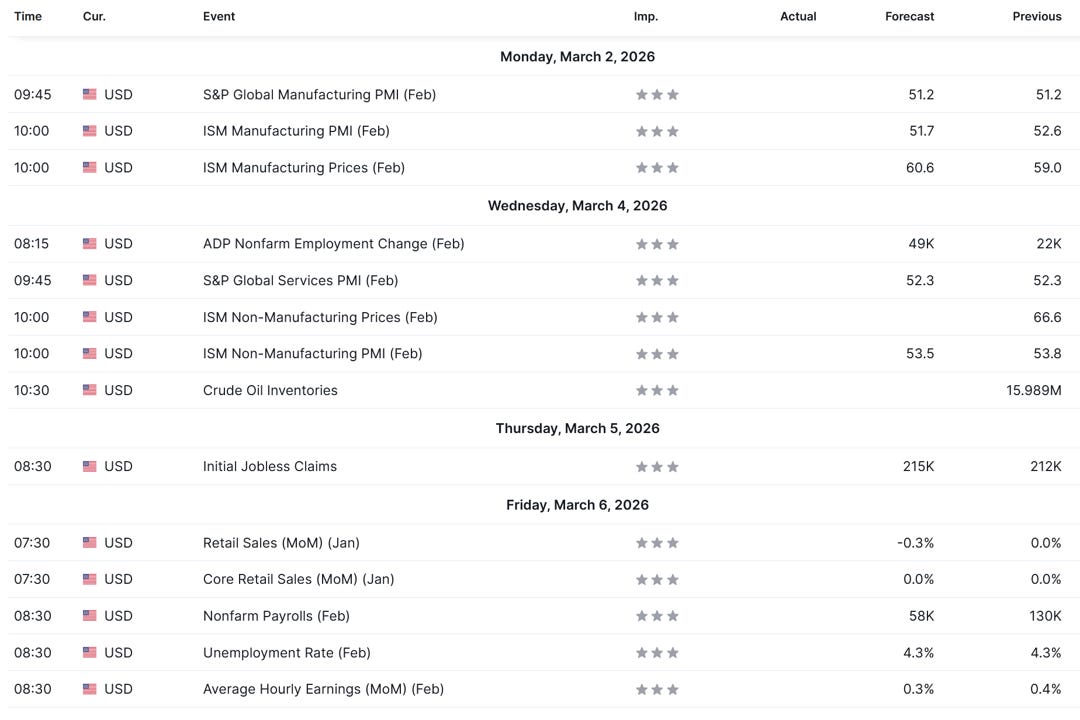
This Week
The key this week will be Nonfarm Payrolls and the Unemployment Rate on Friday. The ISM numbers will be closely watched as well.
Investment Ideas (Paid Section Below)
Last week, our investment ideas (behind the paywall) yielded an average return of 1.10% compared to a -0.44% return for the S&P 500.
This equates to outperformance of 1.54% for our picks last week.
Year-to-date, our investment ideas have outperformed the S&P 500 by 7.36%.
Would you like to see our investment ideas each week? Become a paid subscriber by clicking on the link below.
The following sections are available only to paid subscribers.
For subscribers who want to go deeper, we also offer a paid tier.
The Market Map – Elite
Elite subscribers receive everything included in the Free version, plus full access to our proprietary research, including:
Additional Market Map charts and analysis
A minimum of two investment ideas per month
S&P 500 Fair Value Model
The Market Map tutorials and walkthroughs
And more…
For those who want to learn “The Market Map” methodology, we also offer one-on-one coaching and cohort-based learning for larger groups.
If that is of interest, email jim@skillmangroveresearch.com to inquire.
If you would like exclusive access to our proprietary data, be sure to click on the link below to become a paid subscriber.
I am always trying to improve this newsletter for our readers, so let me hear from you!
If you have 30 seconds, I’d genuinely appreciate more detailed feedback (good or bad).
Click here 👉: Feedback Form
