All charts use a weekly time-frame unless otherwise noted.
1) US Investment Grade (LQD)
This might be the most important chart of the week. Note that LQD has now broken down and through an upward sloping trendline that was tested six times. The last time this occurred was in August when rates (yields) exploded higher and LQD declined by -14.13%.
If this holds true again for the same reasons (i.e., rates move higher), the remainder of the charts should be looked at through the lens of what happened in August.
2) S&P 500 E-Mini
Positive:
The year-long down trendline (blue line) has been breached to the upside.
An inverse Head & Shoulders (H&S) pattern has been formed.
If the H&S neckline (4,188) has a sustained break to the upside, the target becomes ~4,870.
Negative:
Watch for the year-long down trendline to act as support. If it fails, and the price falls below the right shoulder (3,785), the target becomes ~3,107.
3) NASDAQ 100 E-Mini
Positive:
The year-long down trendline (blue line) has been breached to the upside.
A double-bottom pattern has been formed which calls for a target of ~13,805.
Red trendline has acted as support for six weeks.
Negative:
Watch for a break of the red trendline. If that happens, the blue trendline should provide support. If that fails, watch out below.
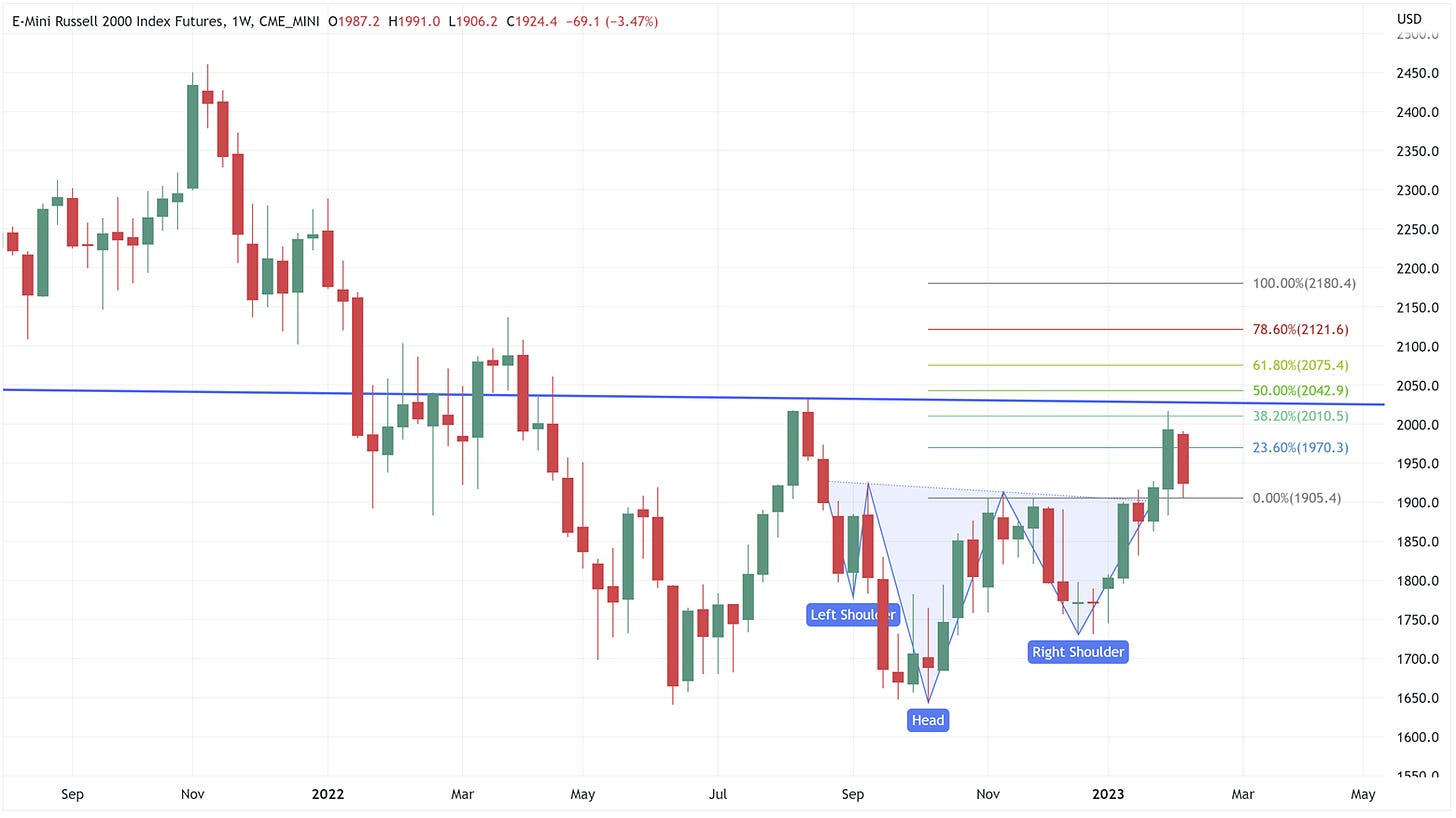
4) Russell 2000 E-Mini
Positive:
An inverse Head & Shoulders pattern has been formed calling for a target of ~2,180.
Negative:
Watch the blue line. This could become resistance and not allow the target of ~2,180 to be achieved.
5) US Dollar Index (DXY)
DXY could be in the process of forming a Head & Shoulders pattern (not confirmed). If it does, and the neckline incurs a sustained break, the target becomes ~88.21 which is almost exactly the lows of 2018.
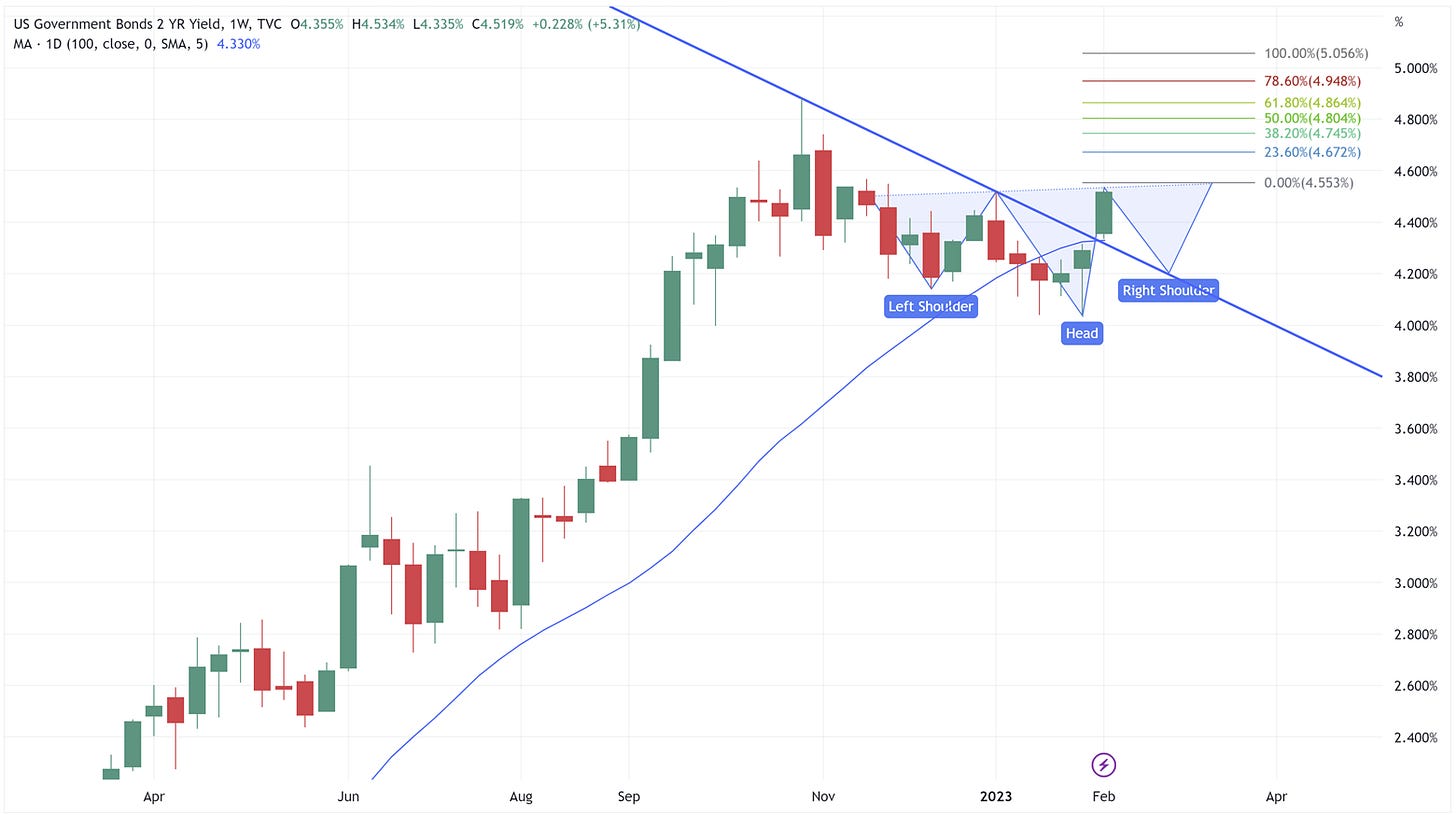
6) US Treasury – 2YR
After spending three weeks below its 100-day moving average (on the daily chart), the UST 2YR has now breached the 100-day moving average. See our “Reading the FOMC Tea Leaves” piece to understand the implications for this break.
It’s probably too early to call this the beginning of an inverse Head & Shoulders pattern, but should it play out, expect a test of the blue trendline and a target of ~5.06% if a sustained break of the neckline can be held.
7) US Treasury – 10YR
A double bottom is in the process of forming. If it completes, it would call for a target of ~4.49%. With that said, it has significant overhead resistance (blue lines) to contend with in the process.
8) US Treasury – 30 YR
Similar to the UST 10YR, a double bottom is in the process of forming. If it completes, it would call for a target of ~4.57%. With that said, it has significant overhead resistance (blue lines) to contend with in the process.
9) US High Yield (HYG)
Possible inverse Head & Shoulders pattern forming. If it completes, target becomes ~85.04.
Triangle pattern has formed as well. Most triangle patterns resolve themselves by about 75% of the way through the triangle (so we are effectively there) with an explosive move higher or lower depending upon which way it breaks the triangle pattern.


