


Weekly Chart Review
Is the S&P 500 in the process of topping?

Hey everyone, it’s Jim.
I hope you had a great weekend!
Let’s dive into this week’s newsletter.
In this week’s newsletter:
Stay Informed
Key Macro Events From Last Week (ICYMI)
Key Macro Events To Watch This Week
The Market Map
Application - S&P 500
S&P 500 Fair Value Model
The Market Map - Extended Analysis
Major US Indices
11 Major US Equity Sectors
US Treasuries
Stay Informed
Key Macro Events From Last Week (ICYMI)
Here’s a brief recap of the major U.S. financial economic news releases for May 12–16, 2025.
Consumer Price Index (CPI) – April 2025
The CPI rose 0.2% month-over-month in April, after a 0.1% decline in March, with the annual inflation rate at 2.3%, the lowest since February 2021.
Shelter and energy increases drove the monthly rise, while food prices fell 0.1%. (Link)
Producer Price Index (PPI) – April 2025
The PPI for final demand fell 0.5% month-over-month, the first decline since 2023, with core PPI (excluding food and energy) down 0.4%.
Annual core PPI inflation slowed, reflecting easing price pressures at the wholesale level. (Link)
University of Michigan 1-Year Inflation Expectations – May 2025
Consumers’ 1-year inflation expectations surged to 7.3% from 6.5% in April, the highest since November 1981, driven by tariff concerns.
The increase was broad-based across political affiliations. (Link)
University of Michigan 5-Year Inflation Expectations – May 2025
Long-run inflation expectations rose to 4.6% from 4.4%, the highest since March 1991, with a notable jump among Republicans.
Tariff uncertainty contributed to heightened long-term inflation fears. (Link)
University of Michigan Consumer Expectations – May 2025
The expectations index fell sharply, contributing to the overall sentiment decline, with consumers citing uncertainty over tariffs and economic policy. (Link)
University of Michigan Consumer Sentiment – May 2025
The preliminary sentiment index dropped to 50.8 from 52.2 in April, the second-lowest on record, reflecting fears of tariff-driven inflation and economic slowdown.
Tariffs were mentioned by nearly 75% of respondents, up from 60% in April. (Link)
Moody's Ratings downgrades United States ratings to Aa1 from Aaa; changes outlook to stable
On Friday, May 16, 2025, Moody's Ratings downgraded the U.S. sovereign credit rating from Aaa to Aa1, citing a $36 trillion national debt, rising interest costs, and persistent fiscal deficits, marking the first time the U.S. lost its top-tier rating from all three major agencies (S&P downgraded in 2011, Fitch in 2023).
The downgrade, announced after market close, raised Treasury yields and could increase borrowing costs, with Moody's projecting federal debt to reach 134% of GDP by 2035; critics, including the White House, called it politically motivated, while Senate Democrats urged fiscal restraint. (Link)
Summary
In the latest economic releases, the U.S. economy showed cooling inflation (CPI at 2.3%, PPI declining) but faced growing consumer pessimism (sentiment at 50.8) and housing sector weakness, with tariff-driven inflation fears (1-year expectations at 7.3%) signaling potential stagflation risks.
Key Macro Events To Watch This Week

All things considered, this should be a fairly tame week on the economic news release front. Famous last words.
The Market Map - Application - S&P 500
We won’t have a new lesson this week, instead, I want to spend a week or two continuing to dive into the application of what we’ve learned so far as I believe we’re at a critical juncture in the market.
In “Lesson #4”, we learned that reversals often take place between the 61.8% - 78.6% Fibonacci retracement levels.
However, I made a caveat that when looking for a reversal:
“We want to use the lower timeframe to give us further confirmation that the market intends to go lower.”
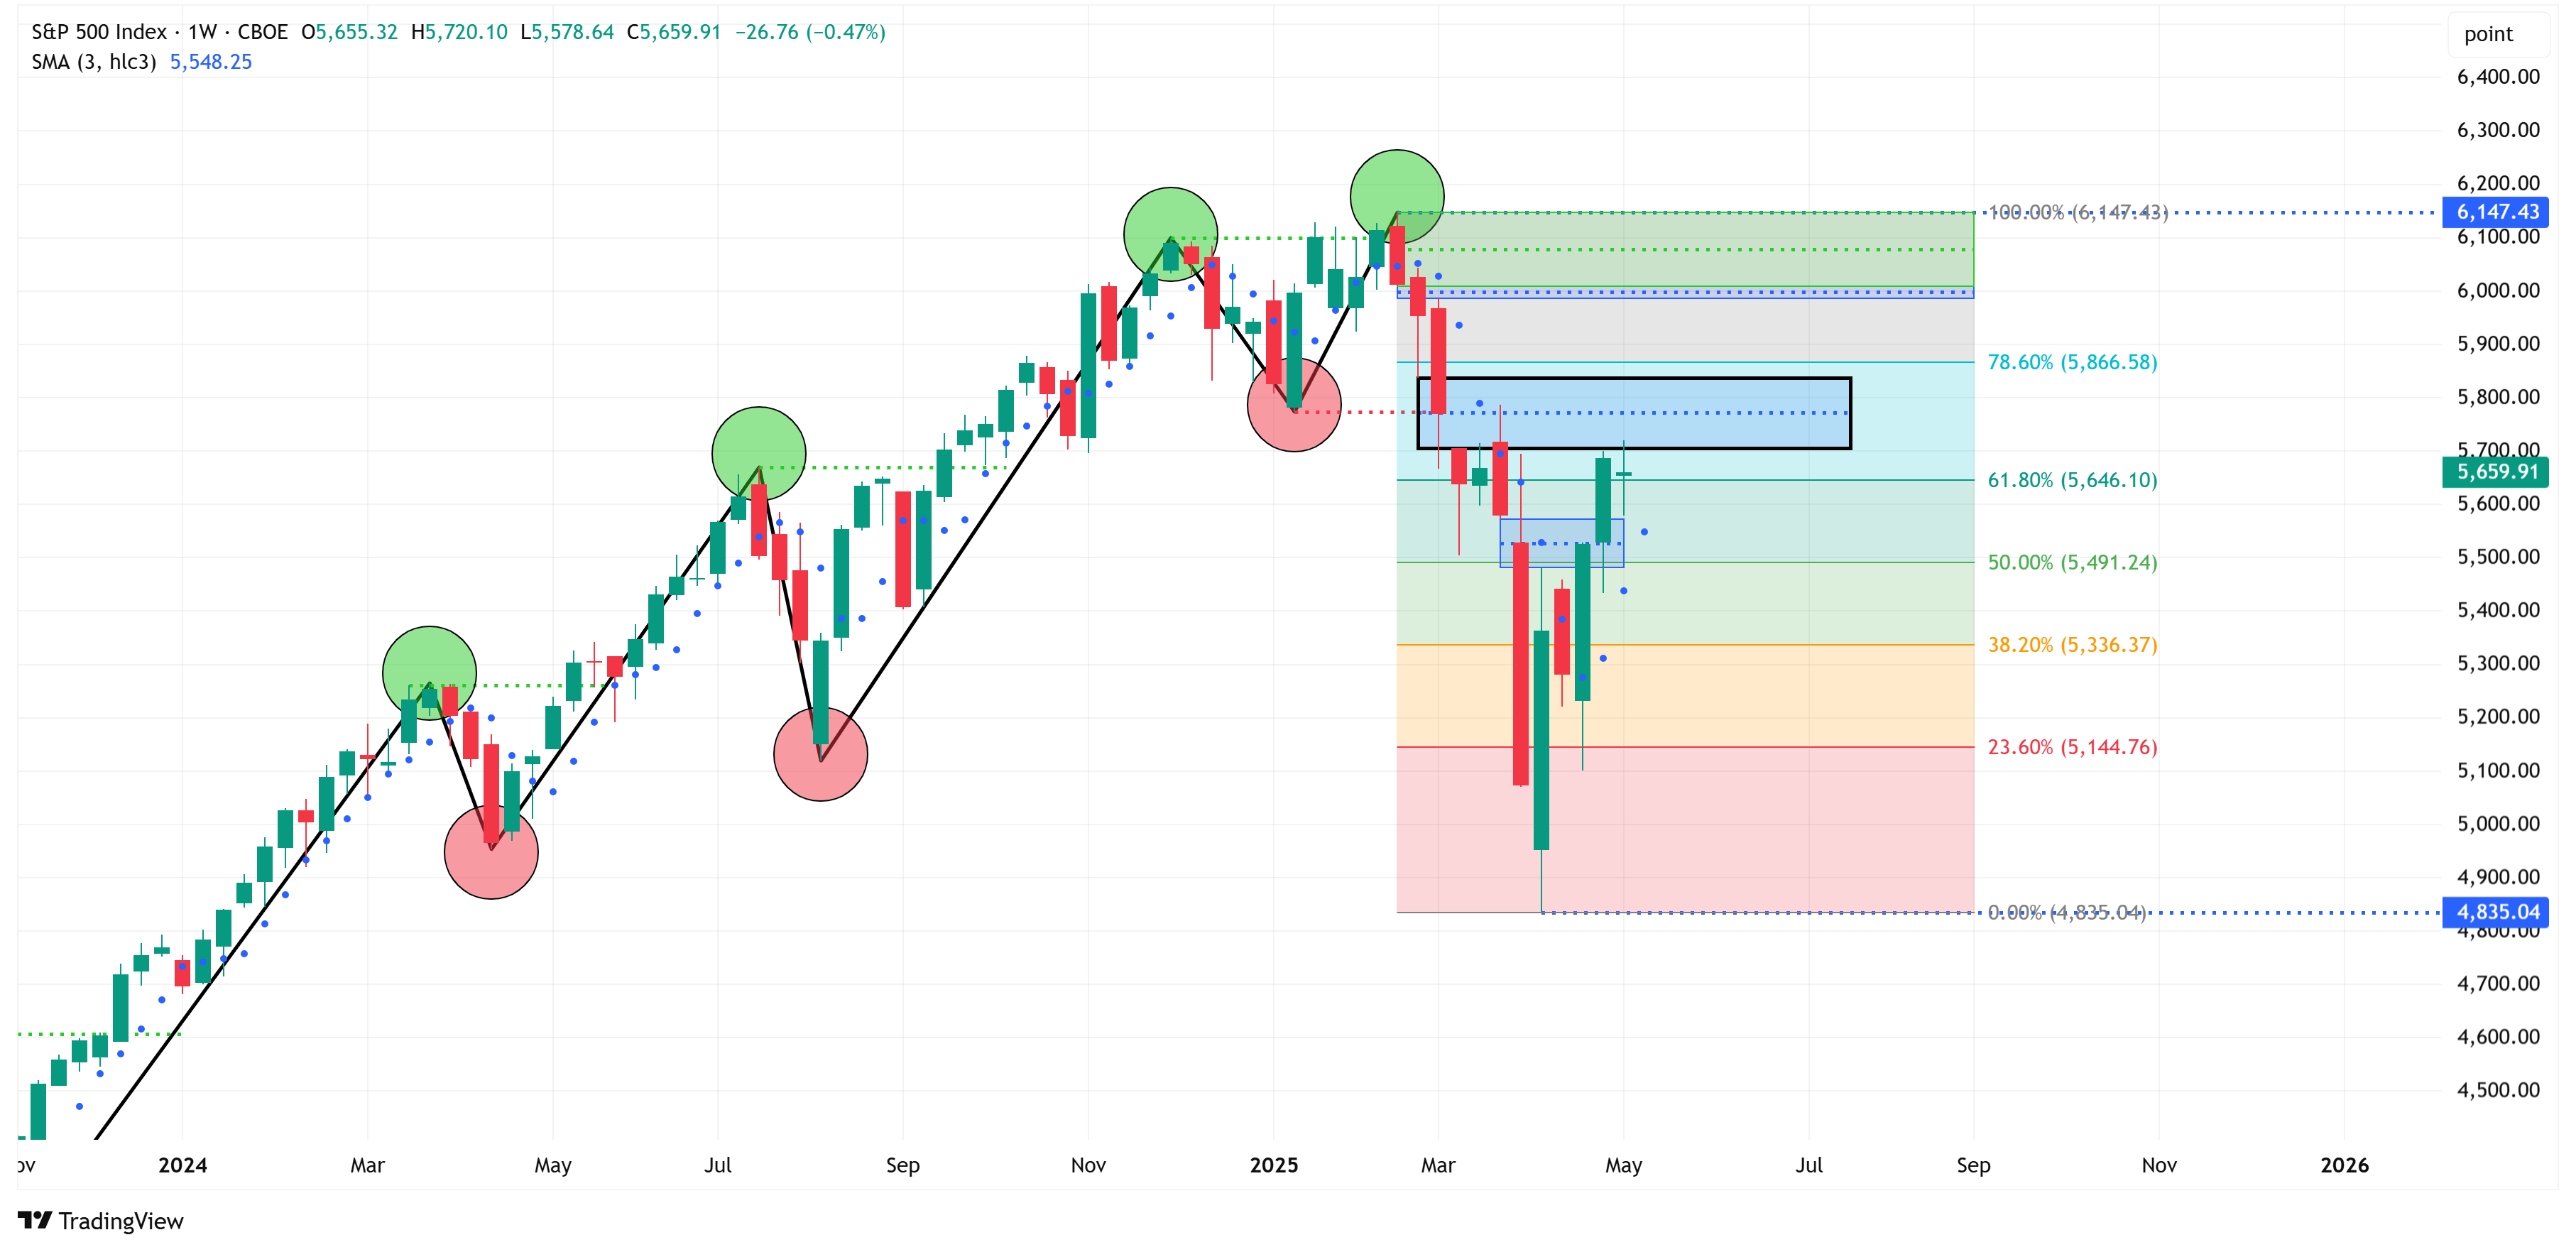
Last week, when speaking more specifically about the S&P 500, I posted the following chart and made this statement:
“For the last several weeks, we have been looking at the following weekly chart of the S&P 500 and suggesting that a reversal could potentially occur as we got into the region between the 61.8% - 78.6% Fibonacci levels.
Further, notice that the blue box with the black border around it has already been an area of reversal in the past. This lends further relevance to suggest that it could lead to a similar outcome again.”
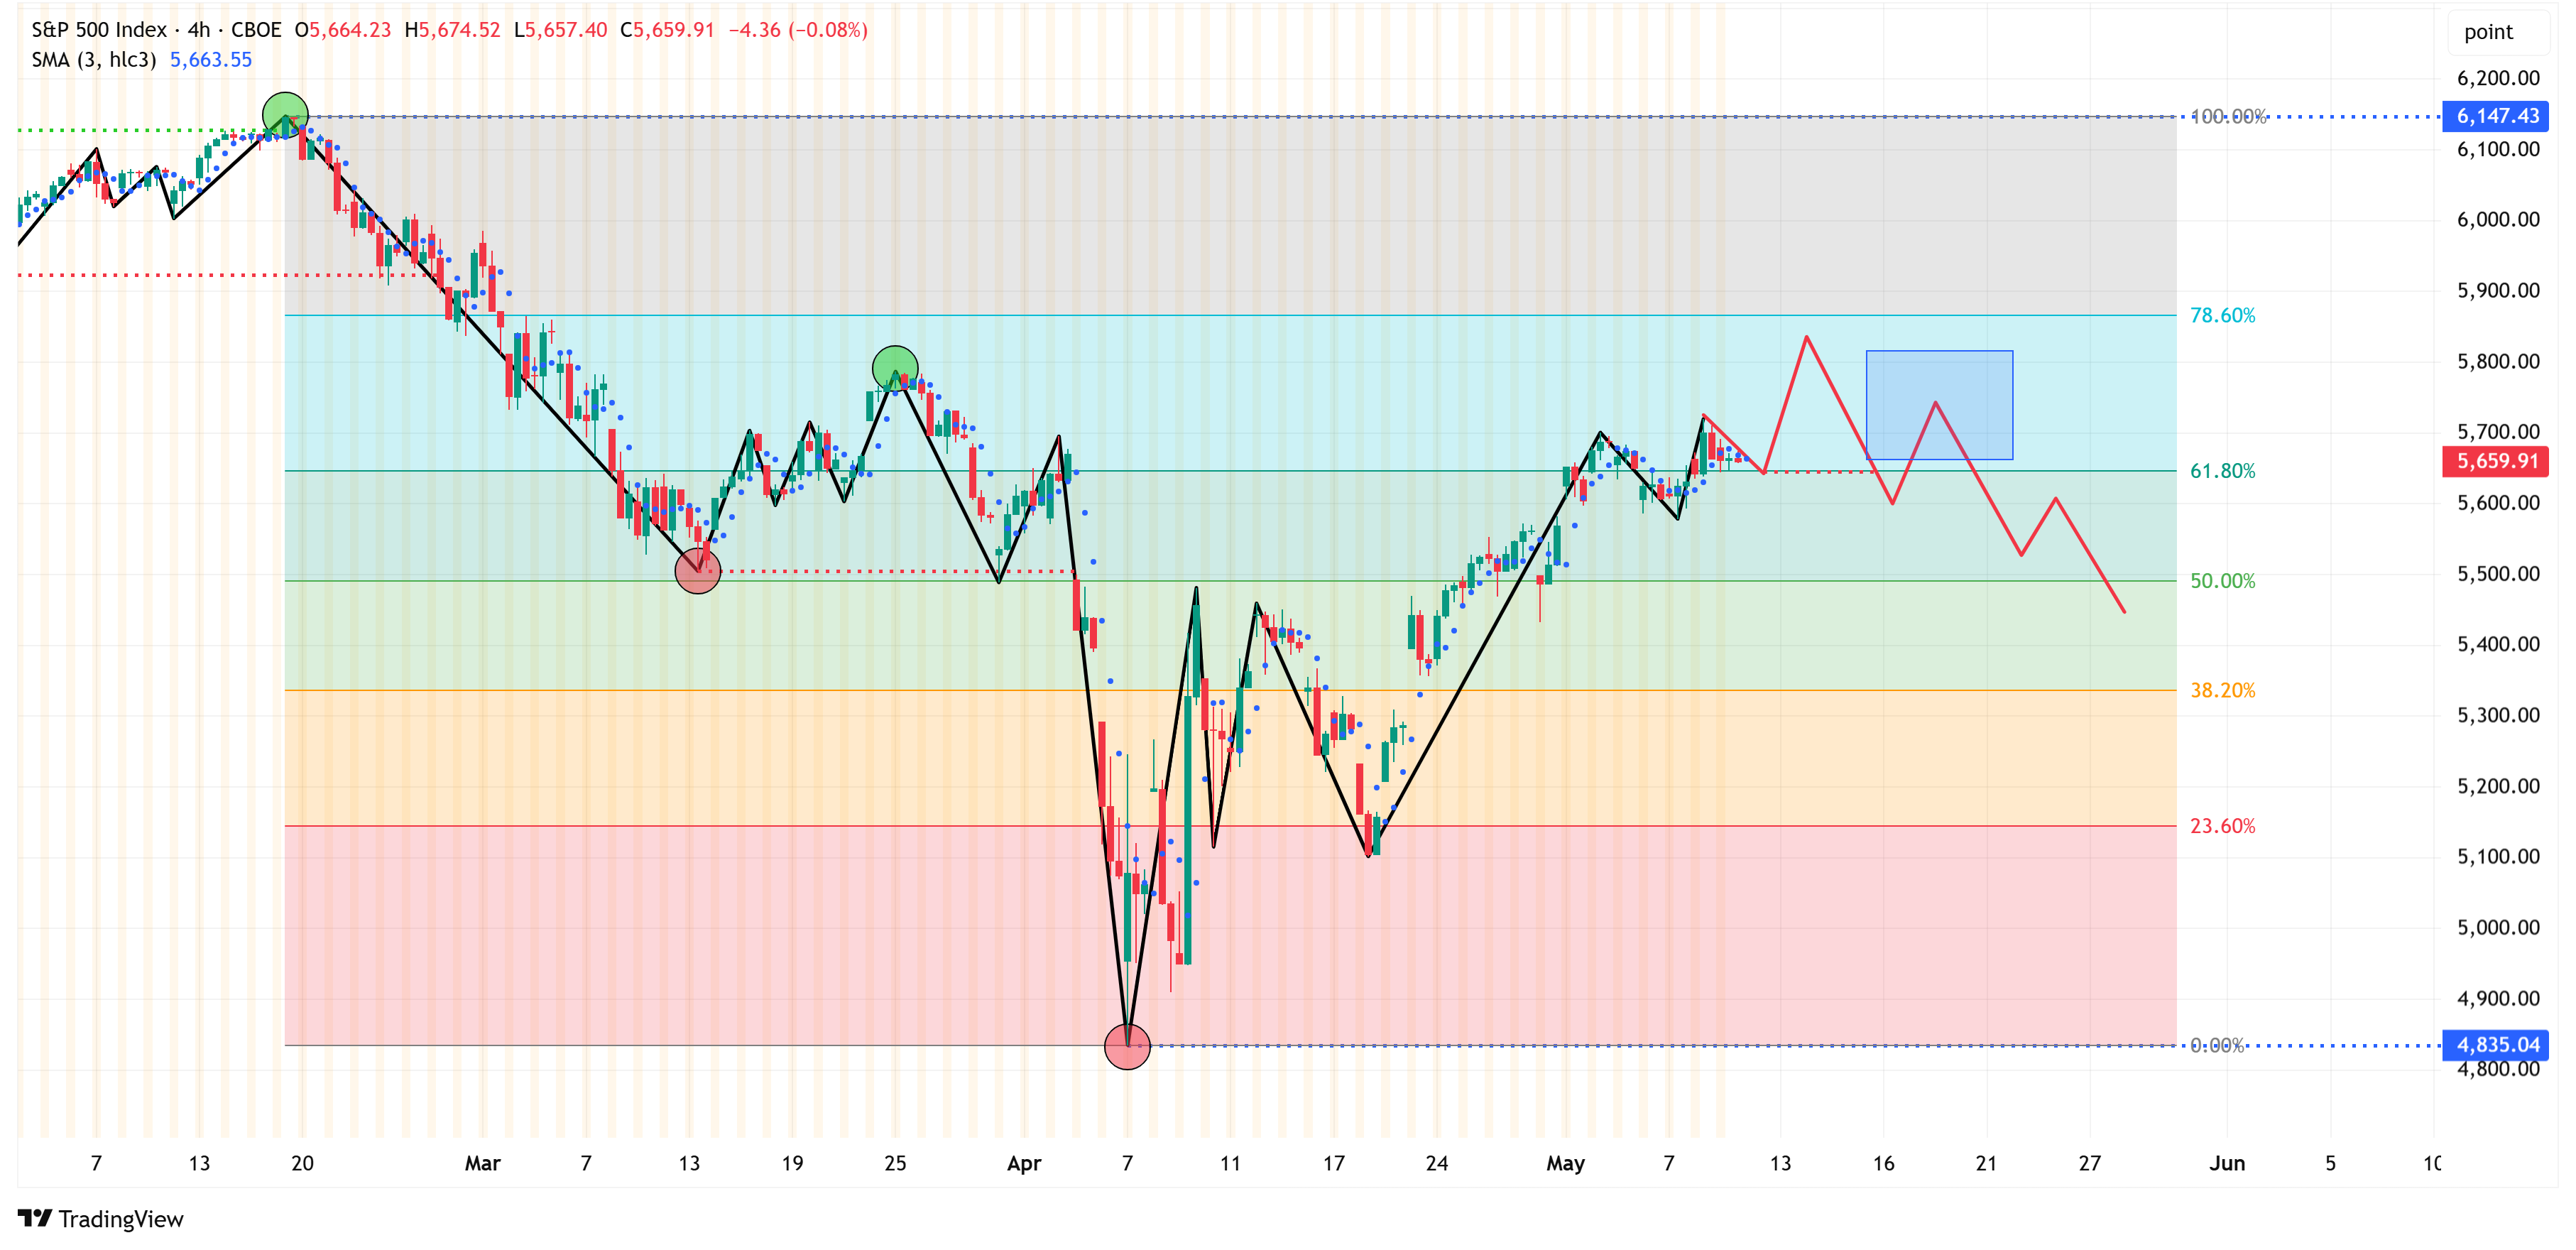
I followed that statement with this one and the following chart:
“Let’s move to the same chart as above, but on the 4 hour timeframe. If a reversal is going to occur, we’ll likely see it happen on the 4 hour chart before the weekly chart.”
Let’s fast forward to the price action over the previous week and see what we find.
Here is the updated S&P 500 through Friday’s close.
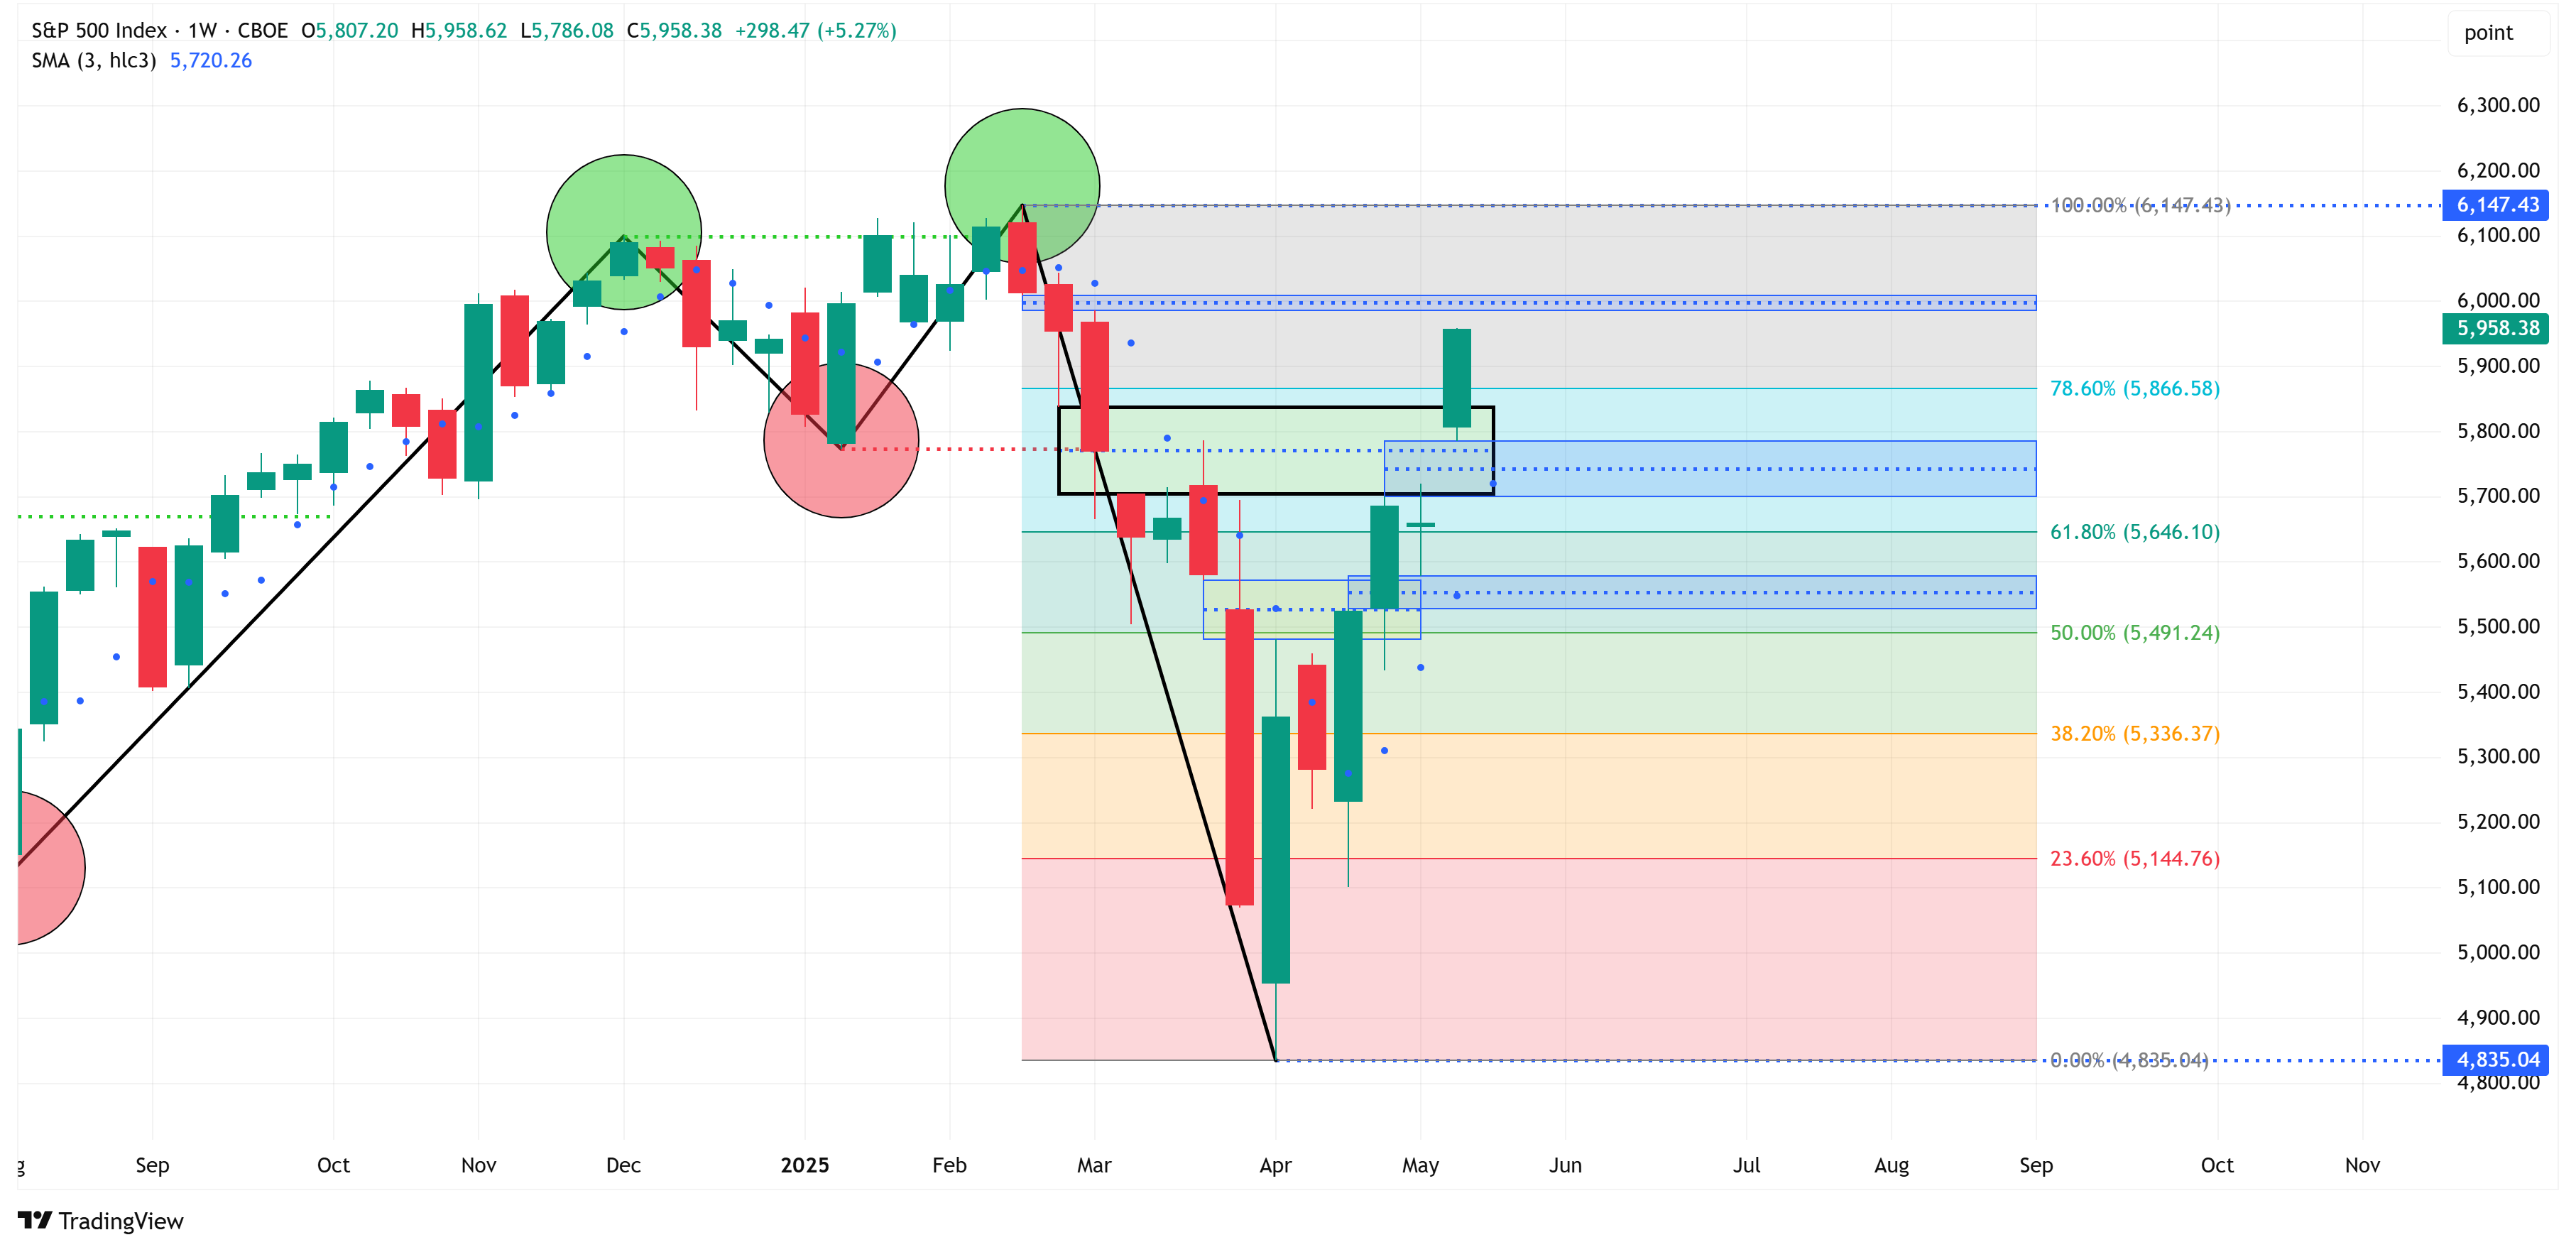
Notice that last week’s price action blew right through the box with the black border that I had highlighted last week.
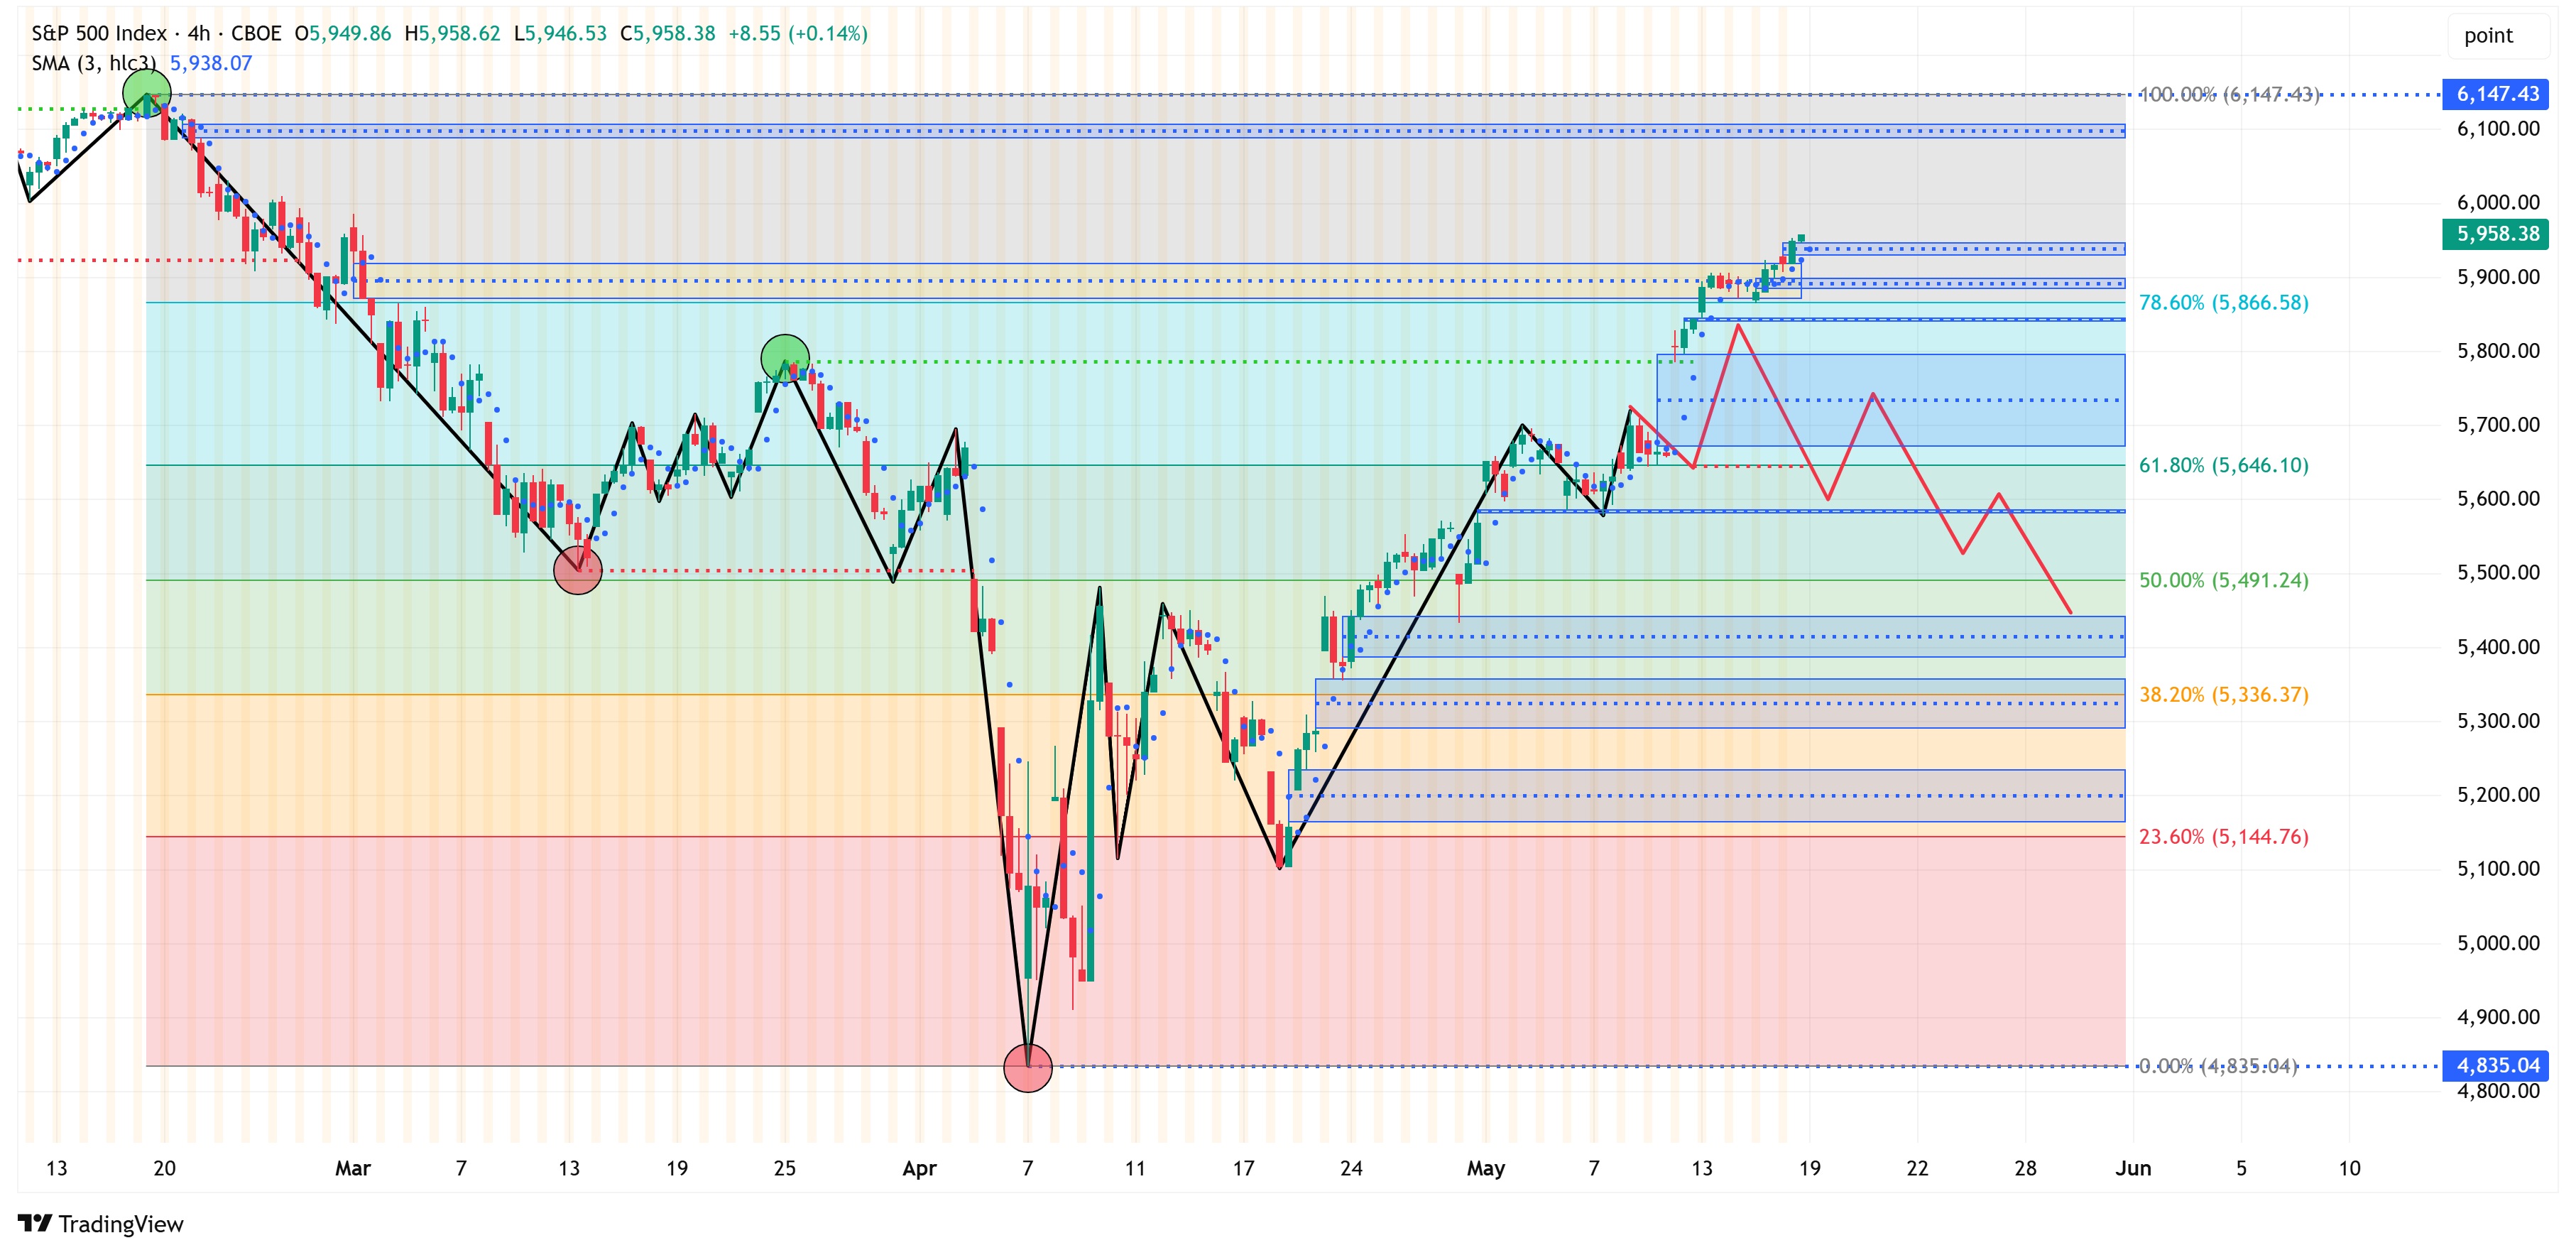
However, notice in the 4-hour chart below, that we never got any indication that the market was trying to move lower.
Recall, we were looking for something akin to the red line to happen to suggest a reversal might be underway. That never happened and hence we wouldn’t have taken a short.
So, what do we do now?
By my work, the market is still in a down trend and will be until we have a weekly close above 6,147.
Given the recent momentum, it wouldn’t surprise me if the S&P 500 continues to push higher until it closes the overhead Fair Value Gaps (FVG).
You can see an FVG (blue boxes on the charts) on the weekly chart between 5,986 - 6,009 and on the 4-hour chart between 6,089 - 6,108. This means these values are still in play and the market could push towards them.
If/when that happens, we want to dial in to the 4-hour chart to see if we are in the process of creating a top thus suggesting a potential move lower.
With regard to a move lower, notice the FVG’s on the weekly chart below that still need to be filled.
These suggest to me that there’s a very real possiblity that this market still “needs” to go lower and what we’ve witnessed over the last several weeks is nothing more than a bear market rally.

The sections that follow are for paid subscribers only.
In these sections, we will discuss our proprietary:
S&P 500 Fair Value Model
This model provides a guide for a) how far the S&P 500 could decline in the next recession and b) when to get back into the market after it has declined.
“The Market Map” Systematic Process
We will call out specific price objectives (up trends vs. down trends, targets, stop losses, etc.) on the following:
Major US Indices
11 Major US Equity Sectors
US Treasuries
Subscribe today and take advantage of our “70% Off For Life!!!” promotion!
This equates to less than $10/month for institutional quality analysis that can pay for itself multiple times over for you and your clients.
Keep reading with a 7-day free trial
Subscribe to Skillman Grove Research to keep reading this post and get 7 days of free access to the full post archives.