Weekly Chart Review
Down...But Not Out.
I am back from vacation, rested, tan, and ready to take on the world! Okay, that might be a bit aggressive but it was good to get away for a bit. With that said, I tried my best to unplug last week so this will be a shorter update than usual as I get back into the groove of things.
On most of my posts, the “Asset Class Review” and my “S&P 500 Fair Value model” are behind the paywall but I am going to lead with them this week and then close out with a few charts and price targets that I believe are extremely important in today’s market.
Let’s make it a great week and enjoy the rest of the newsletter!
Asset Class Review
Each week we take a spin through the major asset classes in an attempt to discern a) what has changed, b) how markets are tilted (i.e., “Bullish” or “Bearish”), and c) where markets may be extended (either positively or negatively) which may provide an opportunity to either enter or exit a position.
We do this by looking at three different time periods: Daily, Weekly, and Monthly, and by analyzing the applicable Z-Scores to get a sense for overbought or oversold conditions.
Overview - Weekly Changes
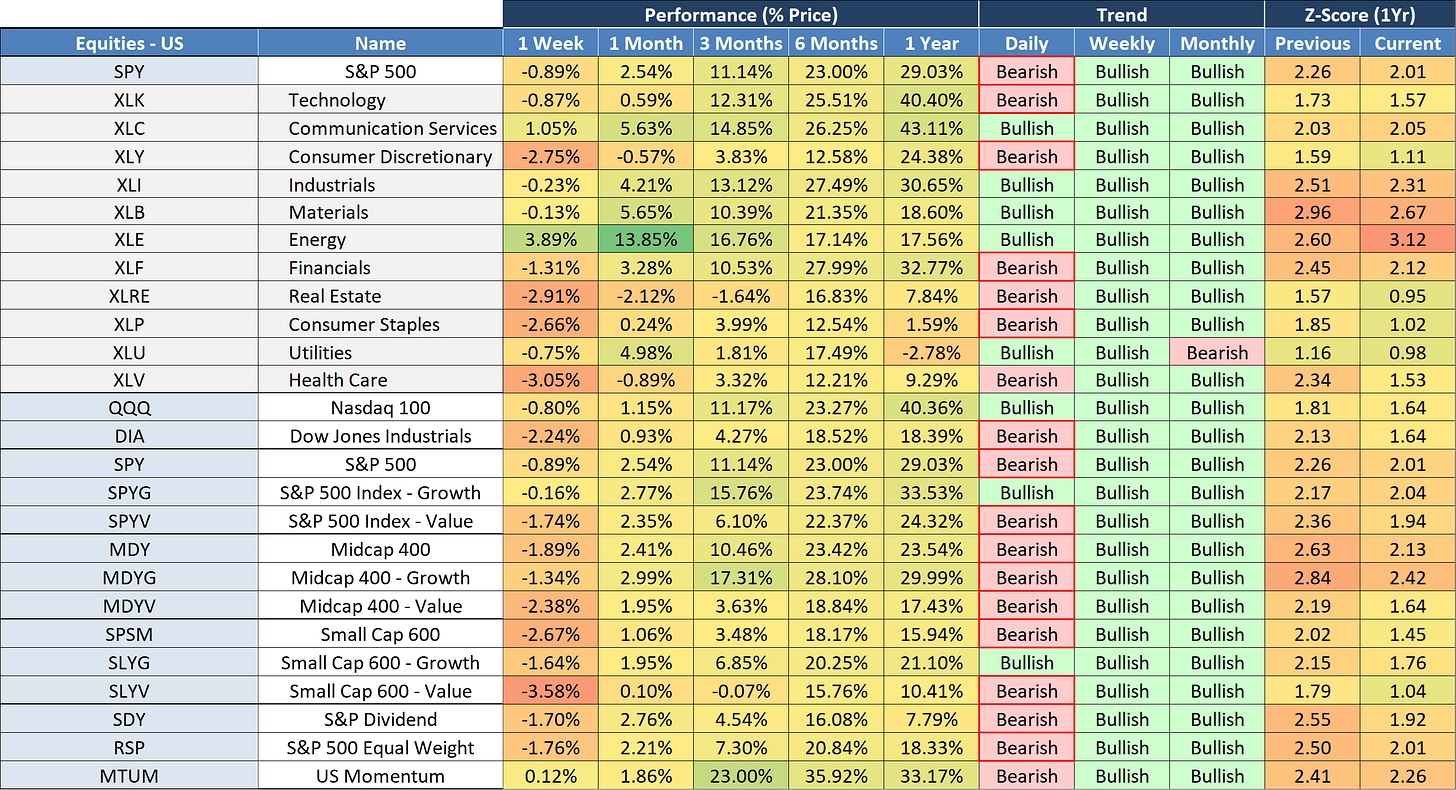
Last week, we saw a decidedly “Bearish” move on the Daily charts as 30% of the ETFs we track moved from “Bullish” to “Bearish”. The largest contributor to this was seen in US Equities as 58% (or 15 of the 26 US equity ETFs we track) turned “Bearish”.
The bright spot for the week on the “Daily” charts was in commodities and currencies.
The Weekly charts tilted “Bullish” with positive moves in Emerging Markets and Commodities while we saw no changes on the Monthly charts.
Overview - Totals
Note that the tilt for US and International equities is now towards the “Bearish” side of the ledger on the Daily charts. However, the Weekly and Monthly charts remain firmly in the “Bullish” camp.
This suggests that what we’ve seen over the last week or two still constitutes a modest correction, not a deeper sell-off.
With that said, given where we are in the cycle, (go back and read my “Quarterly Update: Average Investor Allocation to Equities” piece from a few weeks ago), we need to operate with the understanding that deeper corrections all have to begin somewhere.
Am I suggesting this is the beginning of a deeper correction, No, but a shift like this should at least get our attention and we need to make sure that we have a game plan in place should this turn into something bigger.
US Equities
Note the “Daily” column and the shift towards “Bearish”. Further, note that almost half of the ETFs still maintain a Z-Score greater than +2.0 standard deviations. This would suggest that while they have sold off recently, they have done so from very high levels and therefore could still have further to fall.
International Equities
Very similar picture for International Equities as compared to US Equities.
Emerging Market Equities
Emerging Markets continue to be much more balanced when looking at “Bullish” vs. “Bearish” over multiple time frames (Daily, Weekly, and Monthly).
Further, note that several ETFs are in the oversold camp with negative Z-Scores. This doesn’t mean that they couldn’t sell off further but certainly a different picture relative to US Equities where the lowest Z-Score we have is +0.95.
Fixed Income
Fixed Income took it on the chin last week with the continued rise in rates.
Regular readers know that I have been a big fan of TLT and ZROZ over the last six months or so. I continue to be as these will likely be a safe haven when the market has a deeper correction and/or when the Fed begins to cut rates.
Can I tell you when either of those will happen, No, but when it does happen, it will happen more quickly than you would think and if you aren’t pre-positioned, you’ll probably miss out on some of the bigger moves.
In the interim, this means that you’ll have to be comfortable with the feeling that you are wrong but I would suggest that you go back and look at how the Fed deals with “issues” that come up…they cut rates.
Commodities
Commodities have posted some strong gains over the last month. I think this is in response to the fact that inflationary numbers continue to come in hotter than anticipated.
With that said, take note of the red-hot Z-Scores in the far right-hand column. Those likely cannot remain at such elevated levels for long so they either need to move sideways for a bit or lower.
Currencies
Outside of Bitcoin, the currencies appear fairly balanced across trends and time periods.
S&P 500 - Fair Value
Here is a quick look at the daily version of my S&P 500 fair value chart.
The red line in the chart below is the fair value I have constructed for the S&P 500. Based on my model, the current fair value for the S&P 500 is 2,577.23.
Friday’s close on the S&P 500 was 5,204.34.
This means it would take a decline of -50.5% from the S&P 500’s current value to its fair value.
Additionally, note that the current Z-Score of the difference between the current S&P 500 price and the fair value model price is +2.15 standard deviations.
Lastly, let’s close out with a few charts and relevant price targets for the S&P 500 and NASDAQ. Additionally, I’ll look at the US Treasury 10-year and how high I think rates can go.
Keep reading with a 7-day free trial
Subscribe to Skillman Grove Research to keep reading this post and get 7 days of free access to the full post archives.


