
Weekly Chart Review
July 9th Tariff Deadline Looms...

Hey everyone, it’s Jim.
I hope you had a great 4th of July weekend!
I have been out of pocket for the last week, so this week’s newsletter will be a bit on the abbreviated side, but I think you’ll still find plenty of value!
Okay, with that out of the way, let’s jump into this week’s newsletter.
In this week’s newsletter:
Stay Informed
Key Macro Events From Last Week (ICYMI)
Key Macro Events To Watch This Week
The Market Map
Application - S&P 500
S&P 500 Fair Value Model
Stay Informed
Key Macro Events From Last Week (ICYMI)
Here’s what moved markets last week:
📉 ADP Nonfarm Employment (June)
Private payrolls decreased by 33,000 in June—the first drop since March 2023, versus a consensus forecast of +99,000. (Link)
Losses were concentrated in professional/business services, education & health (~–56K and –52K), while leisure/hospitality and manufacturing saw minor gains.
Annual wage growth eased slightly: +4.4% for job‑stayers (vs. +4.5% in May), indicating cooling wage pressures.
📊 Nonfarm Payrolls & Unemployment (June, official BLS)
The economy added 147,000 nonfarm jobs, aligning with the 12‑month average (~146K). (Link)
The unemployment rate dipped slightly to 4.1% (from 4.2%), supported by government and healthcare job gains.
Average hourly earnings rose 0.2% month‑over‑month (+3.7% year‑over‑year), while average weekly hours fell to 34.2.
🏭 ISM Manufacturing Index (June)
PMI rose slightly to 49.0, up from 48.5—still signaling contraction for a fourth straight month. (Link)
Declines in new orders (46.4, a three‑month low) and employment (45.0), emphasizing persistent weakness.
Input prices remained elevated: Prices Index at 69.7%, near 2022 peaks due to rising costs and tariffs.
📈 ISM Non‑Manufacturing (Services) PMI (June)
Services PMI returned to expansion at 50.8 (from 49.9 in May). (Link)
Business activity (54.2) and new orders (51.3) expanded, but employment slipped back into contraction (47.2), and backlogs declined.
Services prices remained high at 67.5%, marking seven consecutive months above 60%.
🔍 Context & Market Reaction
Markets were spooked by the ADP drop ahead of the BLS payrolls, though the official data showed stronger job growth, improving Fed outlook toward delaying rate cuts.
Elevated price indices across ISM reports and cooling payrolls reinforced debate over inflation persistence vs. growth resilience.
🏛️ “One Big Beautiful Bill” (H.R. 1) — Signed July 4, 2025
Trump signed the One Big Beautiful Bill Act, a sweeping ~900‑page tax-and-spending package. (Link)
Key provisions:
Makes 2017 tax cuts permanent (~$4.5 T), adds deductions for tips/overtime, increases child tax credit, and raises SALT cap.
Cuts Medicaid & SNAP funding (work mandates, co-pays), phases out clean-energy & EV tax credits, funds border enforcement & missile defense (“Golden Dome”).
Fiscal impact: Adds ~$3.3–4.5 trillion to the deficit over the next decade; CBO projects ~12 M lose Medicaid by 2034, the poorest face ~$1,600 average annual tax increase.
Political fallout: Mixed reception—Republicans celebrate it as transformative; Democrats, economists, and public opinion polls (Pew, Fox, KFF) paint it unpopular and risky.
Key Macro Events To Watch This Week
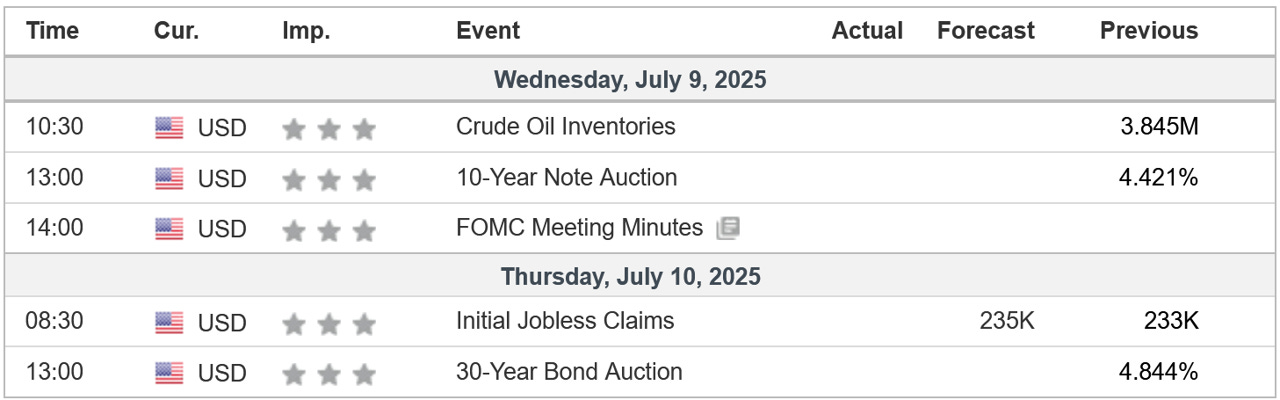
It’s a very light week on the economic data calendar front…
I think the fireworks this week will revolve around any headlines pertaining to the July 9th tariff deadline.
Here’s what to expect:
⚖️ What Is the Deadline?
The 90‑day pause on country-specific reciprocal tariffs (announced April 2, 2025) expires July 9, 2025. (Link)
If no bilateral trade deal is reached by midnight, country-specific tariffs—ranging from 11% up to 50%+ on top of the 10% baseline—will snap back, triggering “Liberation Day” tariffs.
📨 What’s Happening Now?
On July 7, the White House is sending out warning letters to around 100 countries, stating tariffs will go back into effect on August 1st unless deals are finalized.
Different countries fall into buckets:
Agreements reached (e.g., UK, Vietnam, China) → spared from tariff escalation.
Negotiating in good faith → may retain baseline 10% tariff.
Uncooperative → heavy tariffs reinstated post‑July 9th.
🌍 Who’s Safe—Who’s at Risk?
Australia: Stays at baseline 10%, avoids tariff warnings.
Major partners (EU, Japan, South Korea, India): Still negotiating—likely to receive letters if no deal by July 9.
📅 Timeline & Market Outlook
July 9: Automatic expiration of pause; tariff reinstatement legally possible.
July 7–8: Letters dispatched to targeted countries.
August 1: New tariffs formally take effect for those lacking agreements.
Markets are on edge—anticipation of inflationary imports and supply‑chain disruptions is growing.
🔎 Bottom Line
Expect a global flurry of diplomacy ahead of July 9th, as nations race to secure exemptions.
Many will receive warning letters, effectively extending the final implementation to August 1st.
For those unable to strike deals, tariffs of 10–70% could be reimposed, potentially reshaping trade and markets.
If you’re finding this helpful, please consider sharing our newsletter with a colleague or subscribing. It helps us grow and allows us to keep providing this research each week.
The Market Map - Application - S&P 500
Given the “abbreviated” nature of this week’s newsletter, we’re only going to focus on the S&P 500 and NASDAQ 100.
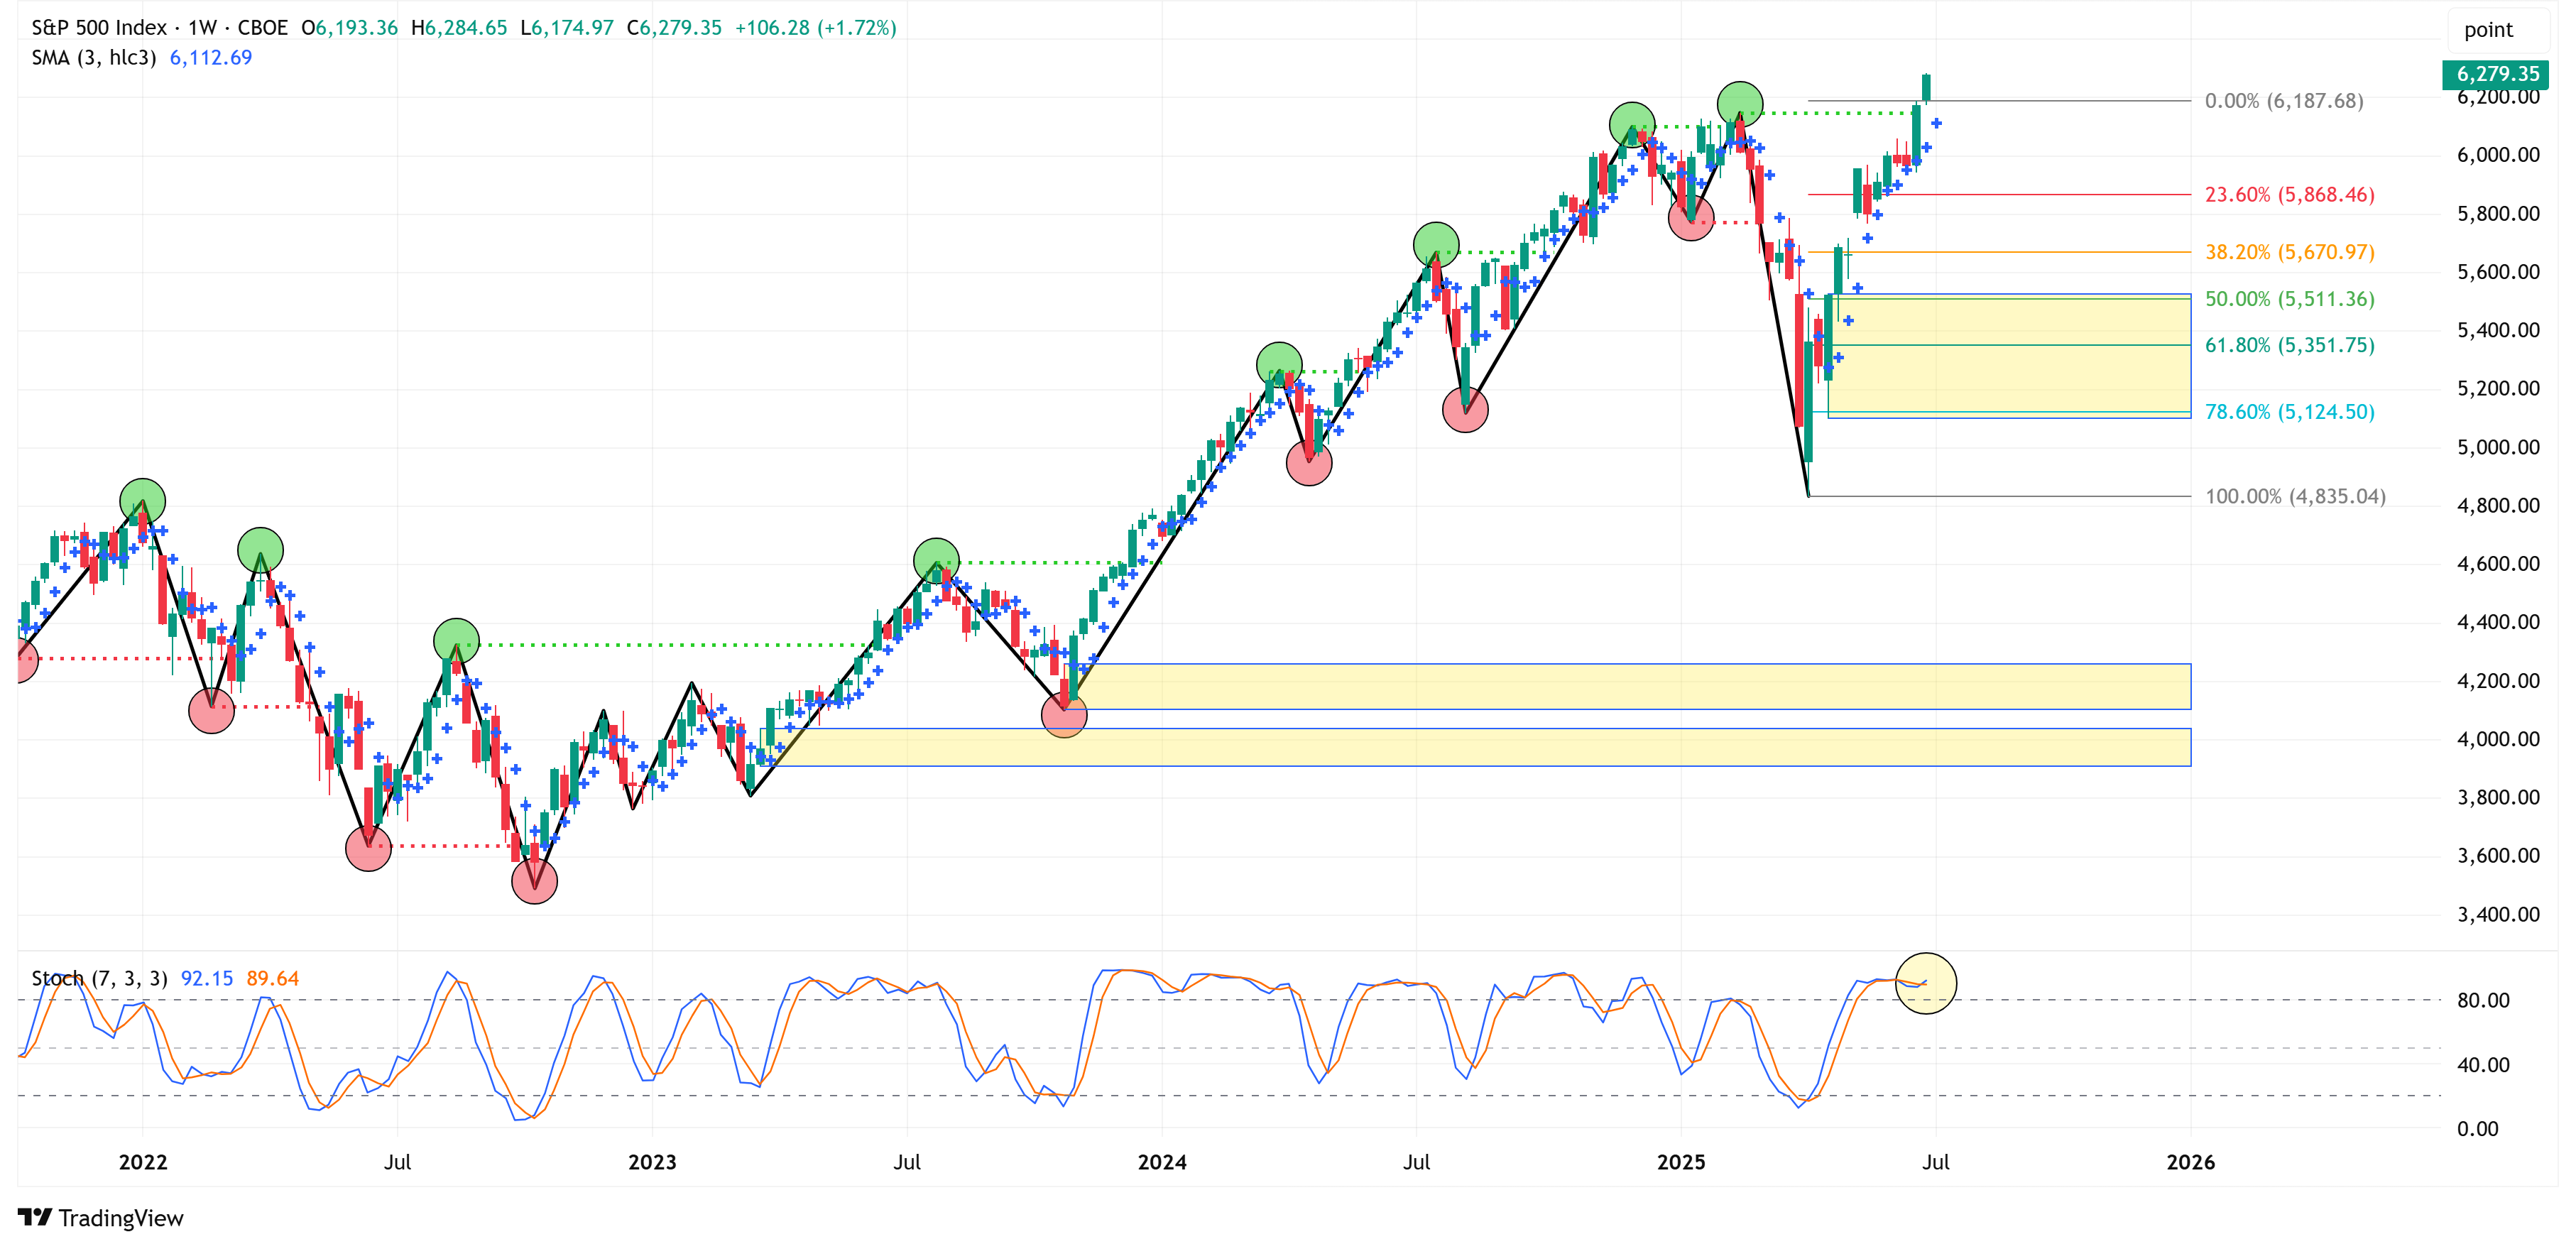
Let’s start by looking at the bigger picture, the weekly timeframe.
You can see that both the S&P 500 and NASDAQ 100 have the following characteristics in common:
Trend = Bullish + New All-Time Highs
Stochastic Indicator = Overbought
S&P 500 (Weekly Timeframe)
NASDAQ 100 (Weekly Timeframe)
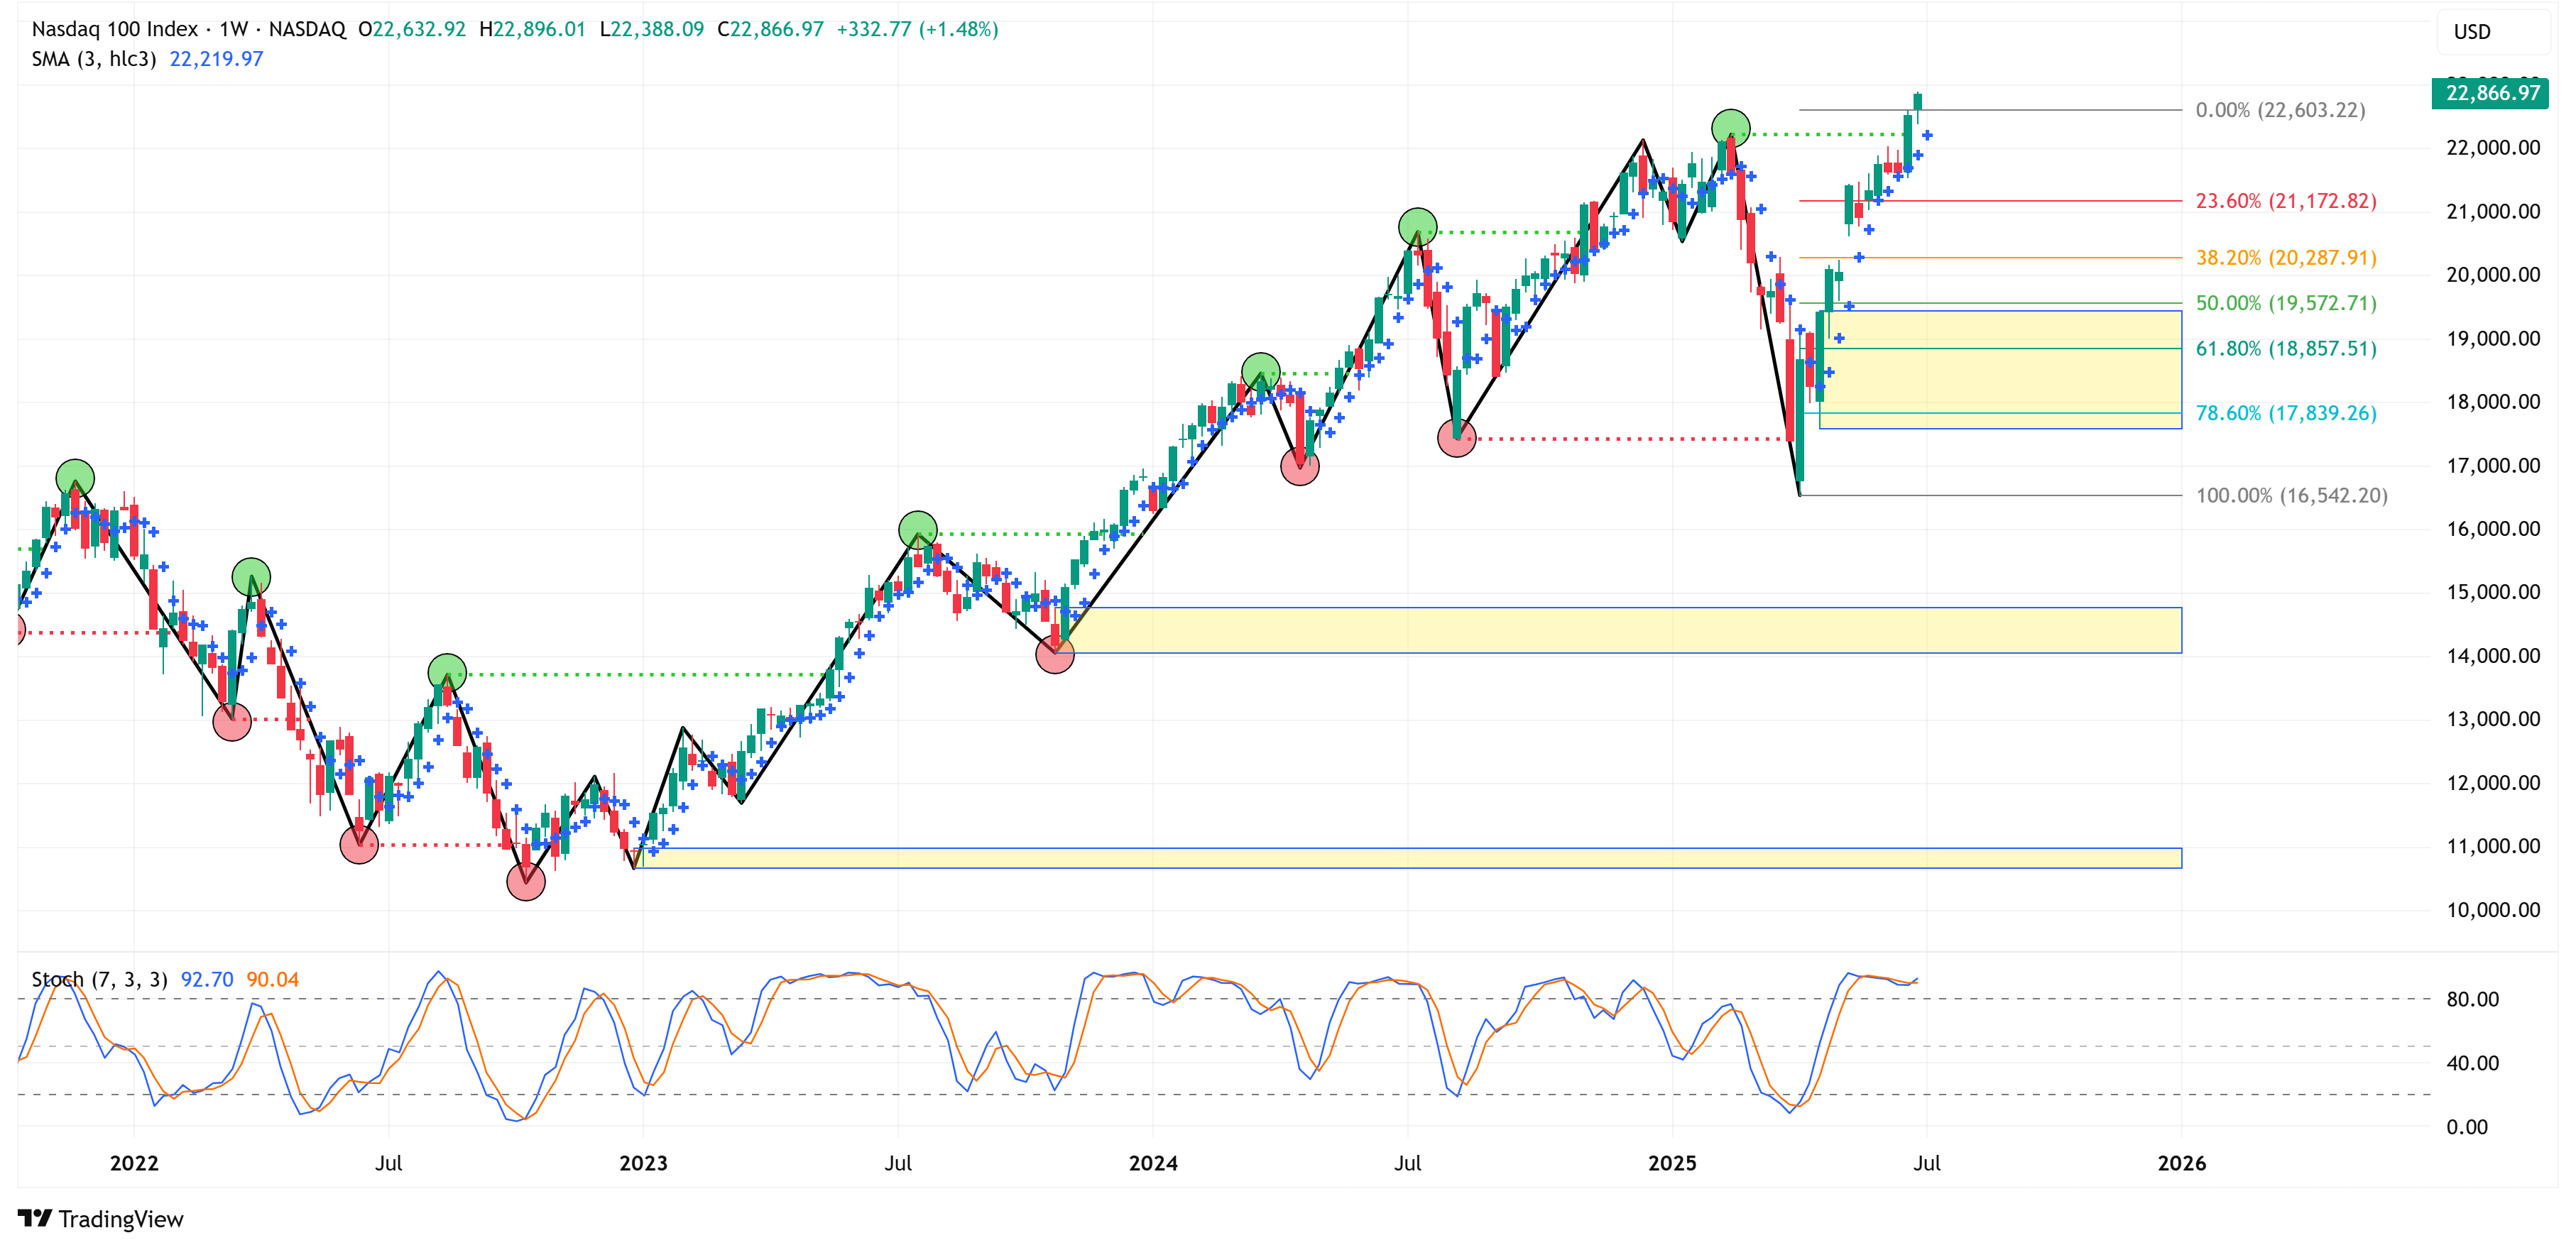
When any asset breaks out to new all-time highs, it is inherently difficult to call a top.
Further, an “overbought” stochastic reading can remain “overbought” for longer than you think.
Net/net, all else being equal, the path of least resistance is likely higher over the short term.
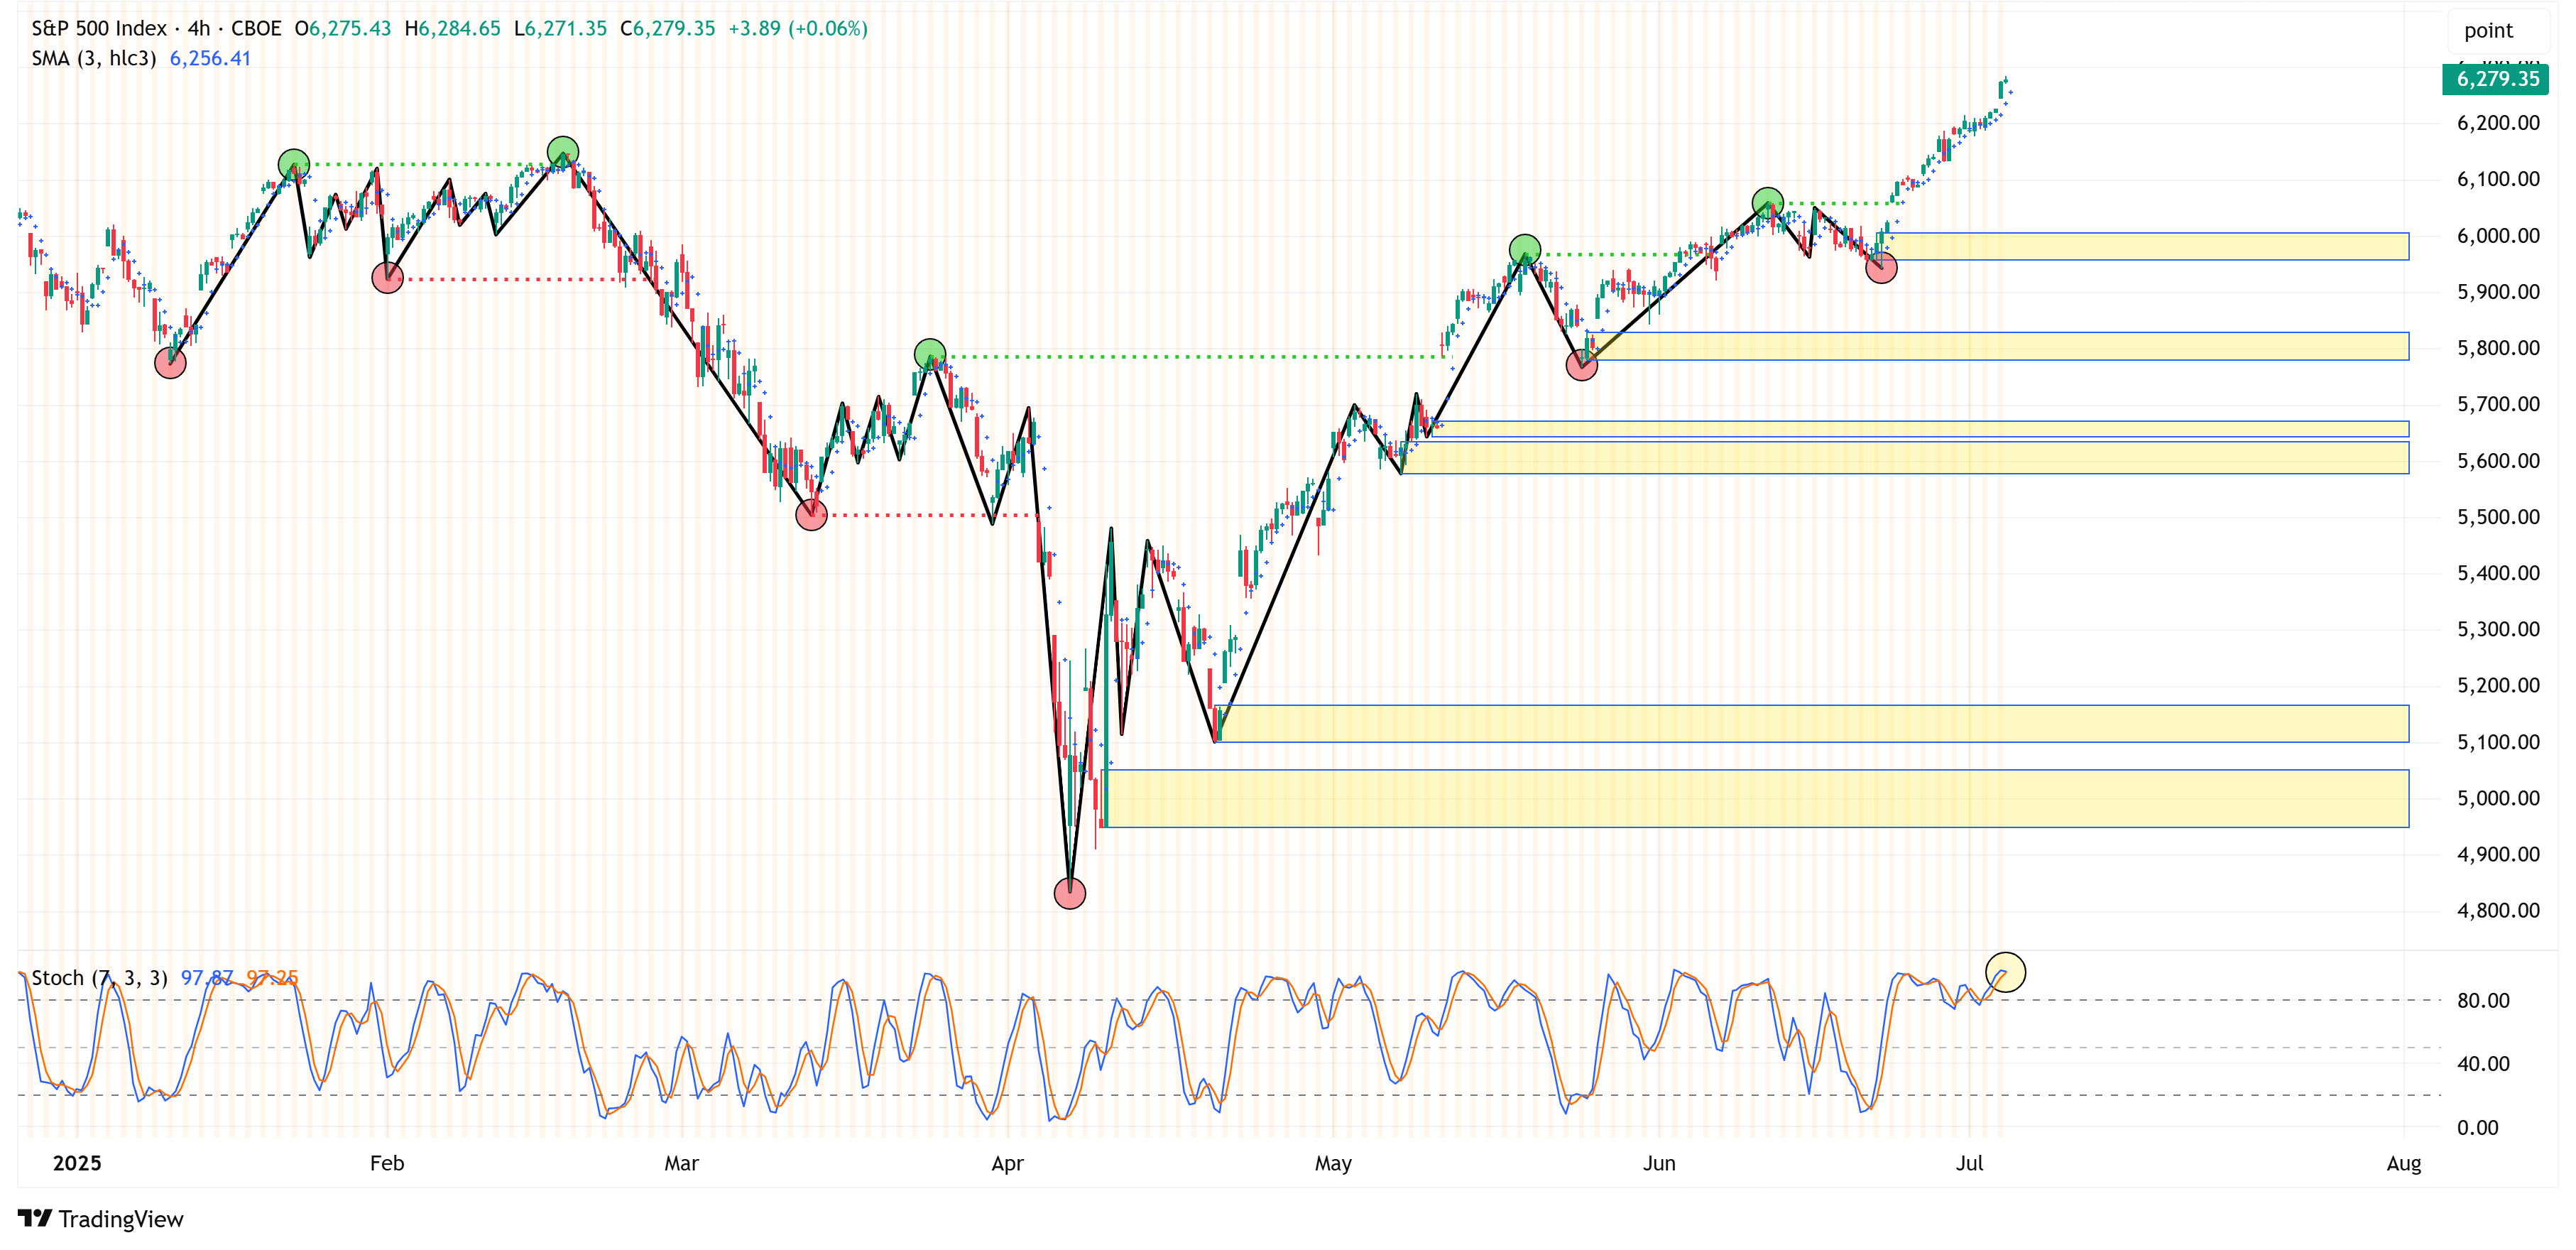
In situations like this, I like to scale down to a lower time frame (i.e., the 4-hour chart) to see if the market is giving us any clues as to its next move.
S&P 500 (4-Hour Timeframe)
NASDAQ 100 (4-Hour Timeframe)
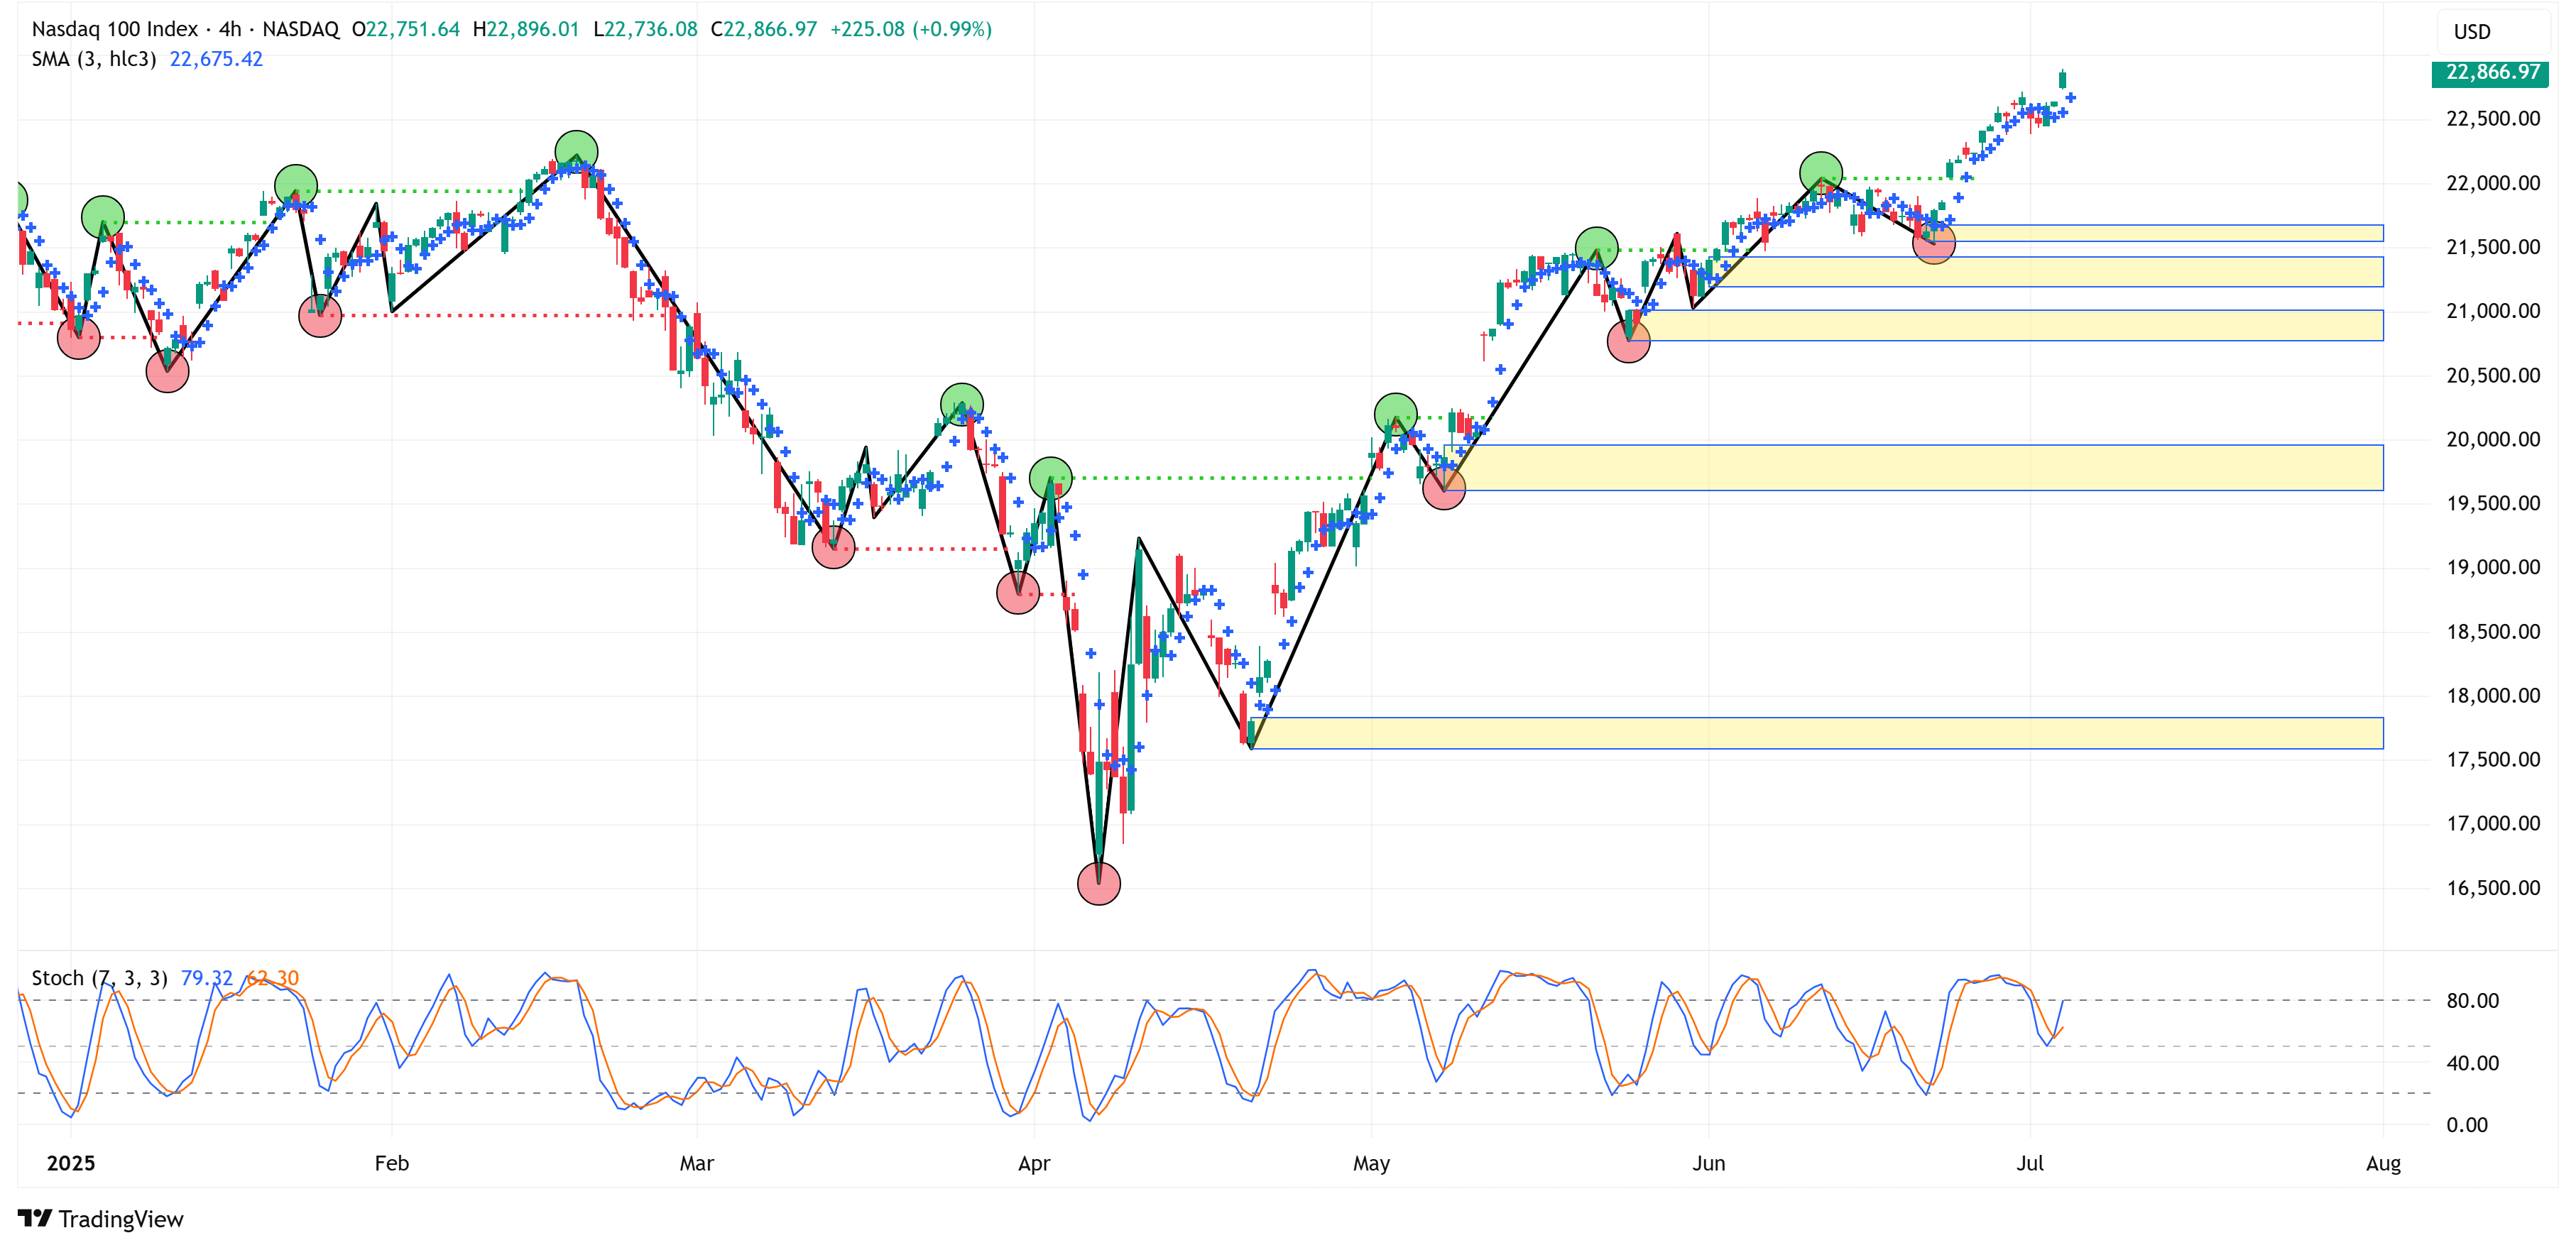
Here again, both S&P 500 and NASDAQ 100 remain bullish on the 4-hour chart, thus suggesting that even on the lower timeframe, the path of least resistance is likely higher.
Important caveat…
The S&P 500 and NASDAQ 100 are BOTH overbought on the weekly timeframe AND the 4-hour timeframe (technically, the NASDAQ 100 hasn’t crossed the 80 threshold on the stochastic on the 4-hour chart, it’s at 79.32 as of this writing, but that’s close enough for government work…)
This suggests to me that a pullback is coming. How much? Impossible to tell, but both timeframes suggest the markets are extended.
Throw into the mix the July 9th tariff situation, and you could very easily have an “excuse” to move lower this week, which may provide an opportunity to re-establish longs if you are biased in that direction.
I said it last week, but new all-time highs are bullish in nature, but the market never moves in a straight line, and given the overbought nature of the markets right now, I wouldn’t be surprised to see a modest pullback soon.
S&P 500 Fair Value Model
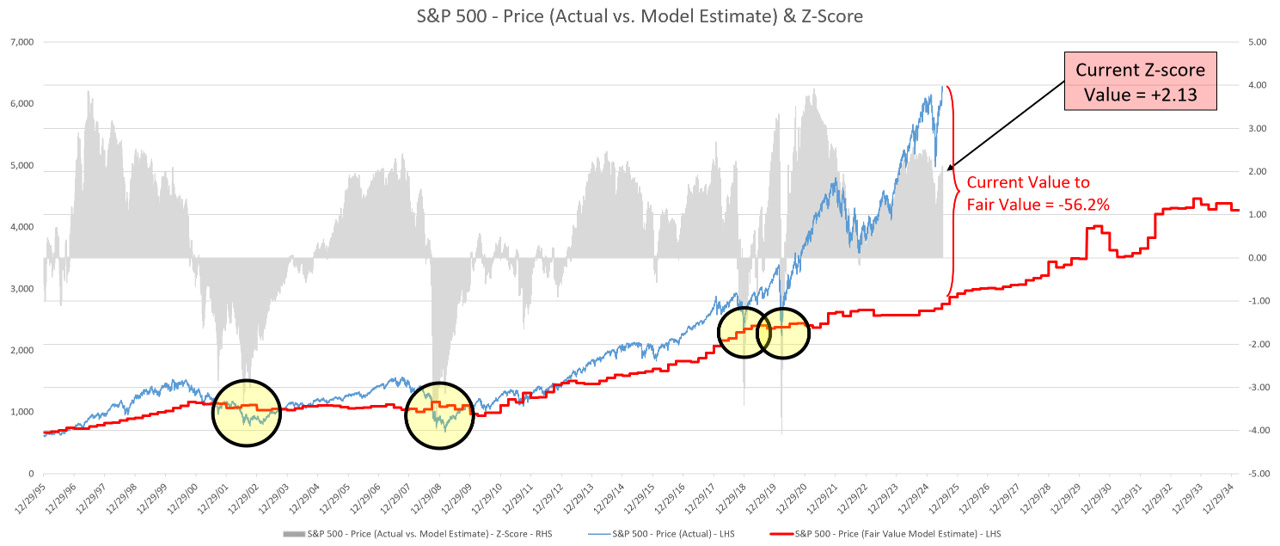
Here are the updated results from my proprietary S&P 500 fair value model.
The red line in the chart below is the fair value I have constructed for the S&P 500. Based on my model, the current fair value for the S&P 500 is 2,752.34.
Thursday’s close on the S&P 500 was 6,279.36.
This means it would take a decline of -56.2% from the S&P 500’s current value to its fair value.
Note: The market can remain well above fair value for extended periods. However, in deeper corrections (i.e., 2002, 2008, 2018, 2020, and in previous historical periods not shown on the chart below), the market always corrects back to the fair value line and often well below the fair value line (i.e., 2002, 2008, etc).
Thank you, as always, for your continued support of this newsletter!
Let’s make it a great week!
Take care,
Jim Colquitt
The Weekly Chart Review is a publication of Skillman Grove Research.
All opinions and views expressed herein are based on our judgments as of the date of writing and are subject to change at any time.
The content of this newsletter is for educational purposes only and should not be construed as investment advice.
Investing involves risk, including loss of principal, and past performance may not be indicative of future results.
Do your research and, where appropriate, seek the advice and counsel of a reputable financial advisor.
Matt 6:33