
Weekly Chart Review
Charts, Charts, and More Charts...

Hey everyone, it’s Jim.
I hope you had a great weekend!
As I noted in last week’s newsletter, I was out of pocket for most of last week with very little access to the internet or email.
With that said, this week’s newsletter is going to be chart-heavy, and I’m going to open up the “paid” sections to all subscribers this week.
If you find the additional charts and proprietary models in the paid section helpful, you should consider becoming a paid member.
Also, we have some new items coming soon for paid subscribers that you won’t want to miss, so now is a great time to join!
Click on the link below to become a paid subscriber and receive a “15% Discount” for life!
In this week’s newsletter:
Stay Informed
Key Macro Events To Watch This Week
The Market Map
S&P 500
Deep Dive
Just One Chart…
S&P 500 Fair Value Model
The Market Map - Extended Analysis
Major US Indices
11 Major US Equity Sectors
US Treasuries
Currencies
Commodities
Fixed Income
Key Macro Events To Watch This Week
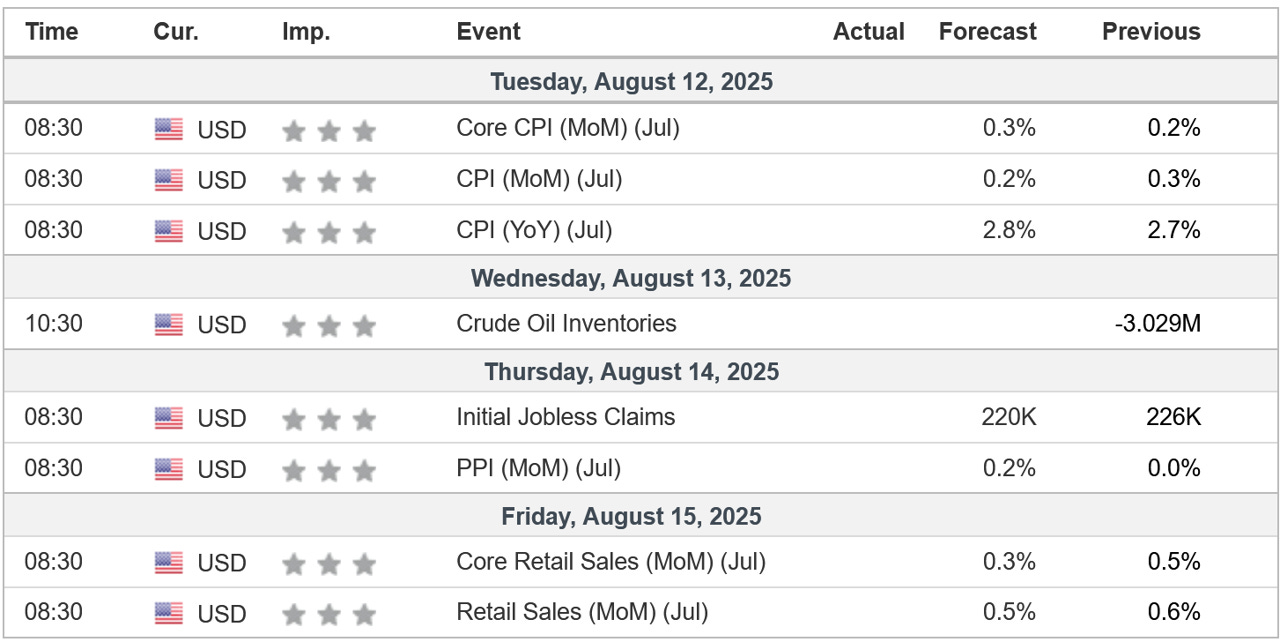
All eyes will be on the inflation numbers (CPI & PPI) this week. This could have big implications for stocks, bonds, and Fed policy, so stay tuned…
The Market Map - S&P 500
We use this section each week to “Map the Market” using our proprietary, systematic methodology to gauge a) the current trend of the market and b) where the market may be heading over the medium term.
Most of our readers are longer-term investors, so we focus on the weekly charts; however, our methodology can be used on any timeframe.
As always, let’s start by looking at the weekly chart.
The S&P 500 gained +2.43% last week and closed the week at a new all-time high.
For the week of June 23rd, the S&P 500 created a new “higher high” by closing above the previous high from the week of February 18th.
This shifted the S&P 500 from a bearish structure to a bullish structure, and we remain in a bullish structure today.
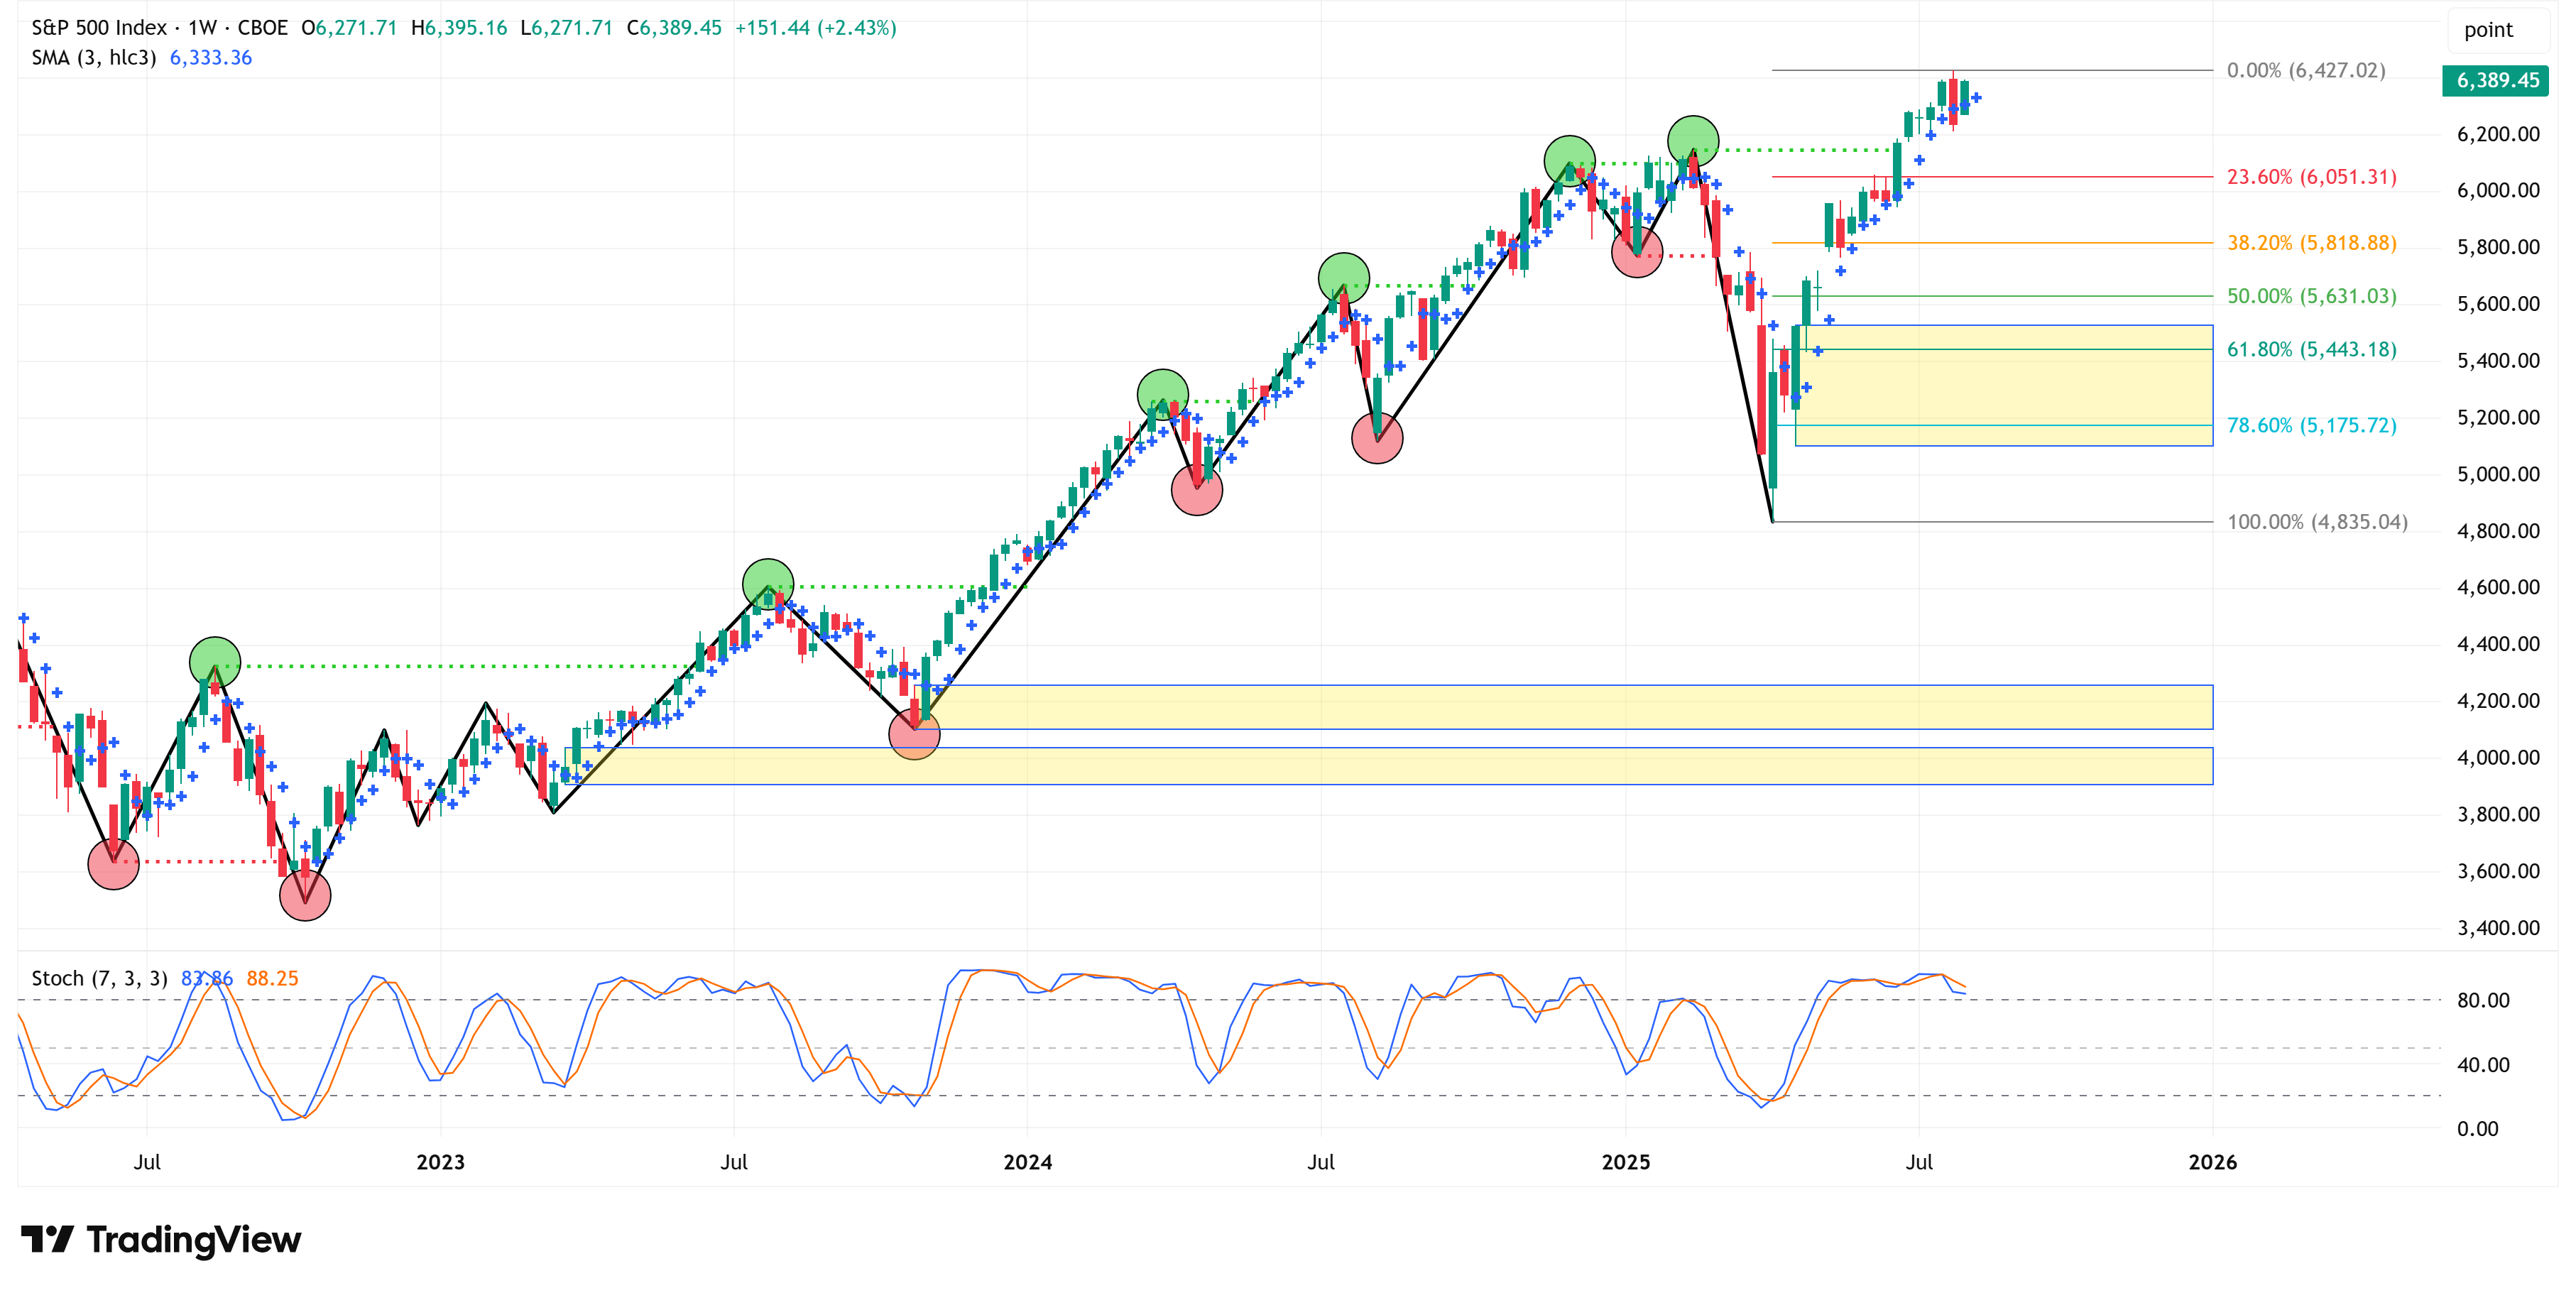
In situations like this, we should a) assume the market is biased higher and b) monitor a lower time frame (4-hour) to get clues as to when the market may begin to consolidate.
Given the bullish structure, we would expect this consolidation to be followed by another push higher.
However, this would be negated if the market structure shifted to bearish. As the chart stands right now, we would need a weekly close below 4,835 to shift bearish.
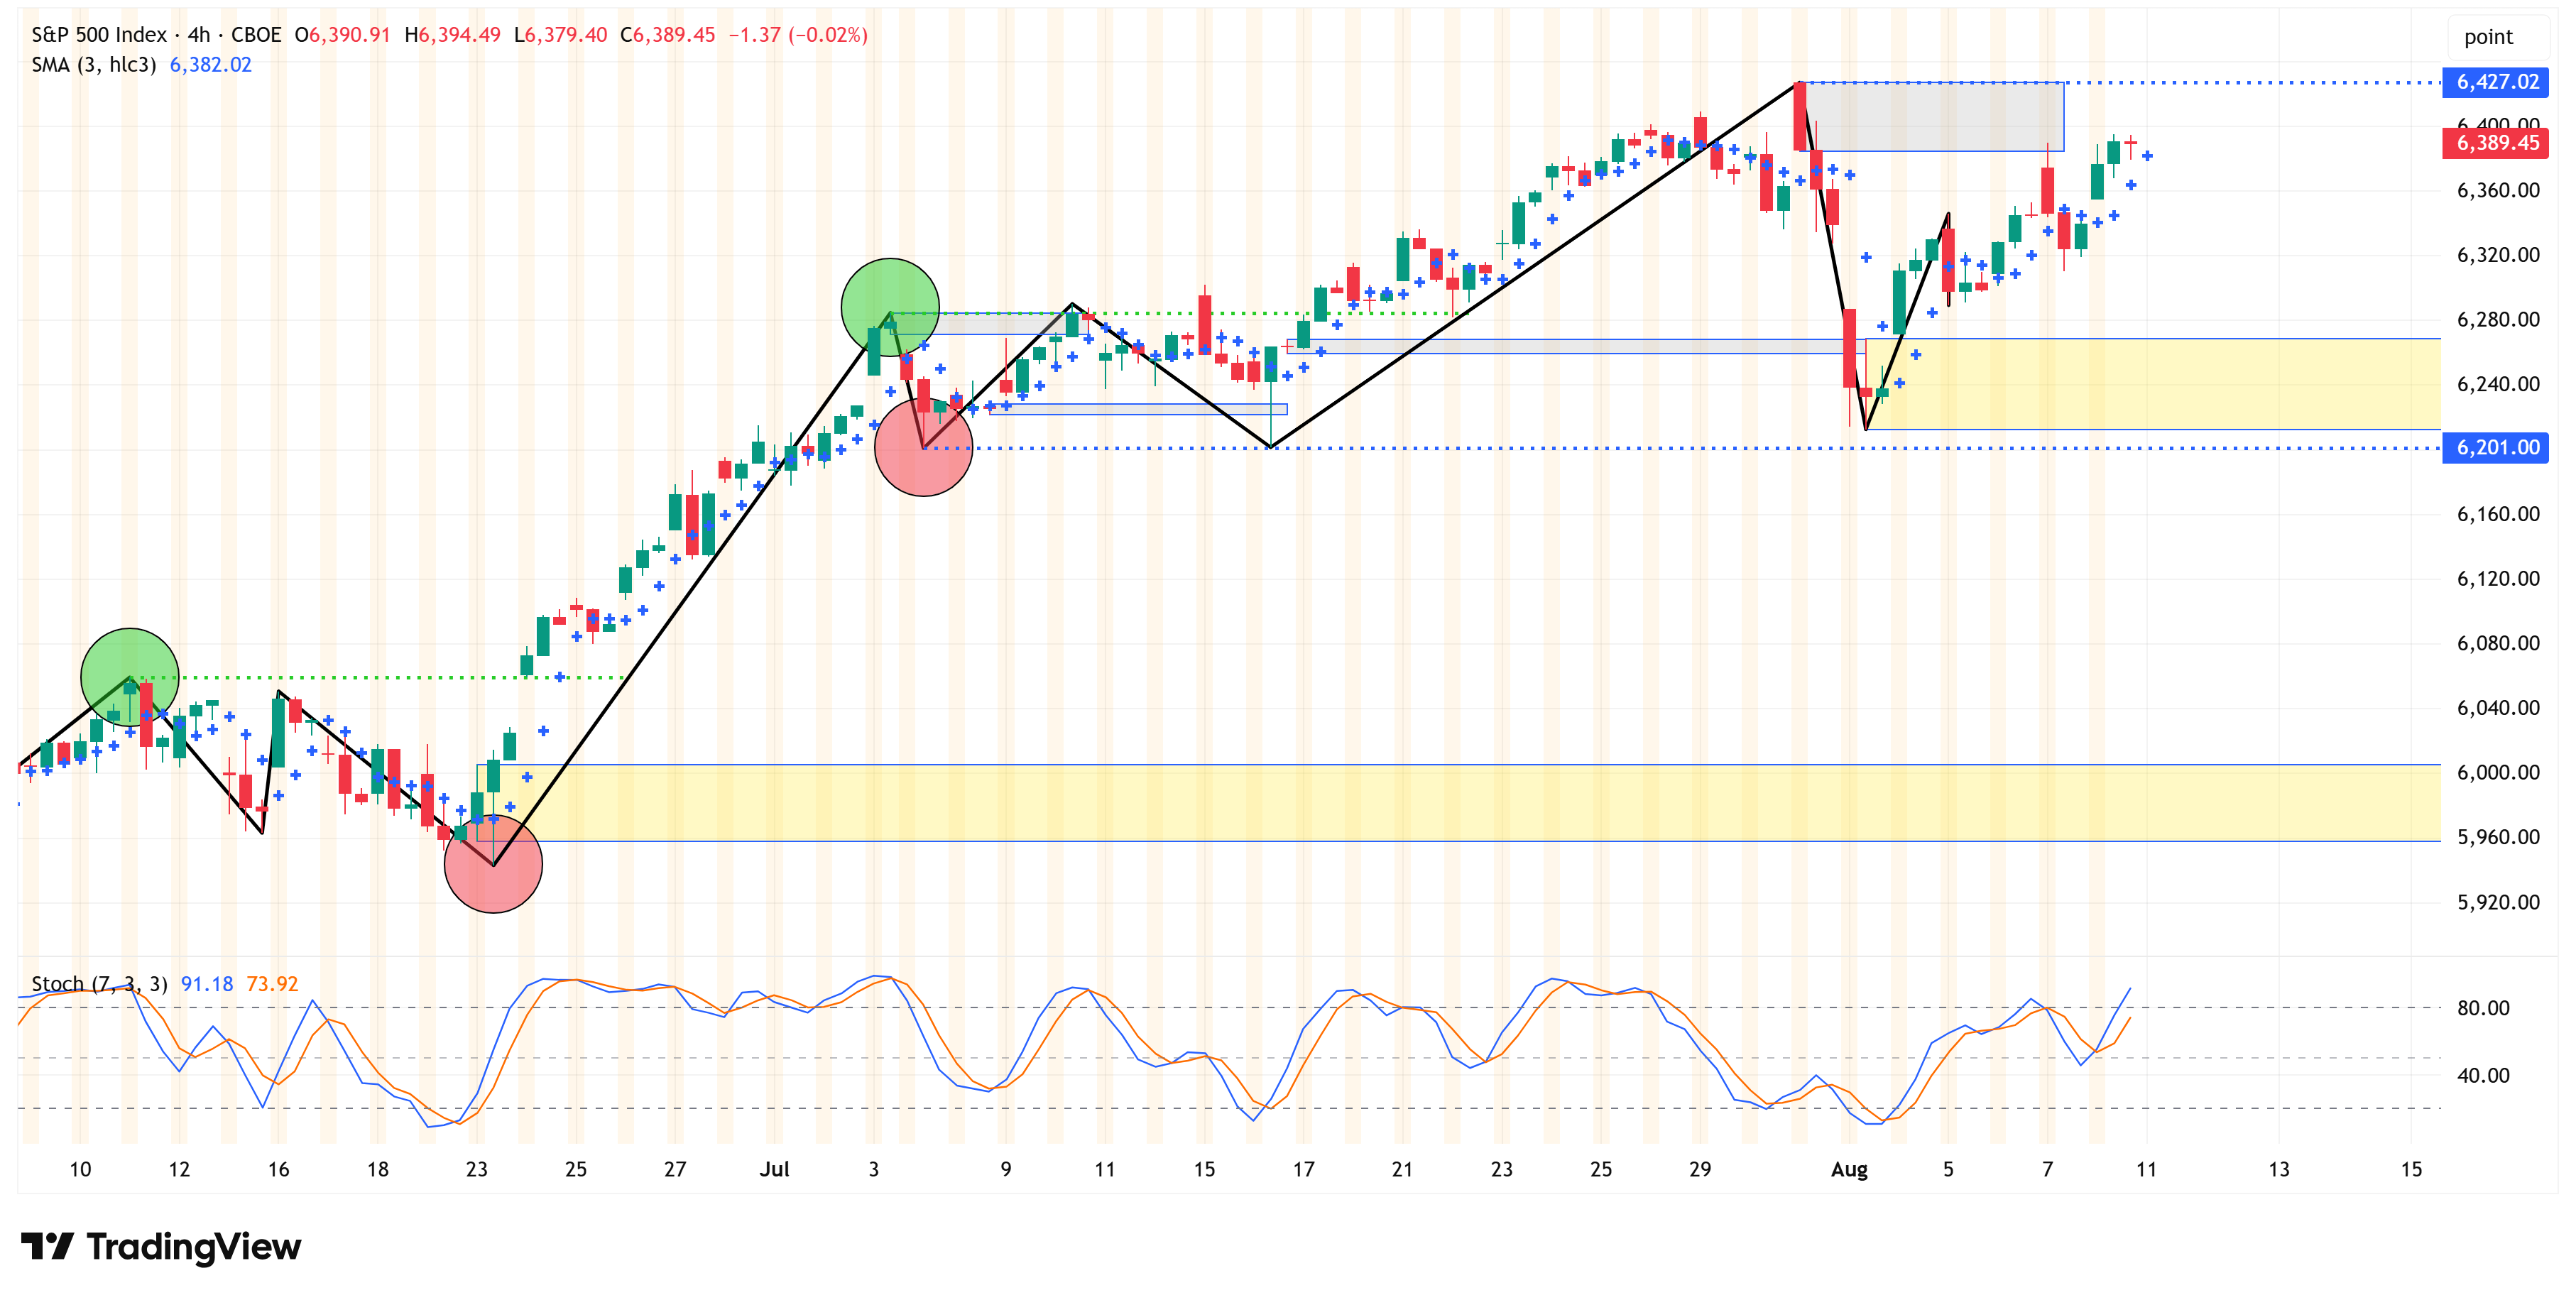
4-Hour Chart
Shifting to the 4-hour chart, we can see that the 4-hour chart remains bullish as well.
Two key levels on the 4-hour chart are 6,427.02 and 6,201.00.
A close above 6,427.02 confirms a continued move higher.
A close below 6,201.00 could be our first warning sign that a pullback is coming.
If we do get a pullback, the most likely area for a stopping point will be within the yellow box on the weekly chart that is situated around the 61.8% and 78.6% Fibonacci levels drawn on the chart.
If we get a weekly close below 4,835, we will shift to a bearish structure, and you should be biased towards even lower values.
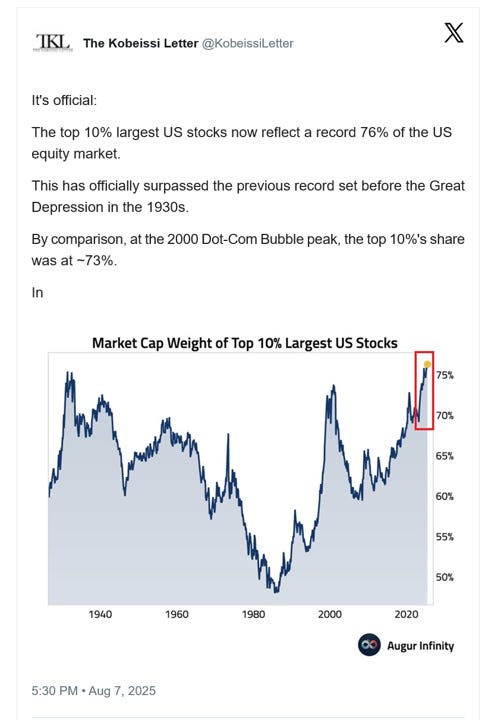
Net/net, bullish for now, but things are feeling frothy (see the chart below in the “Deep Dive” section).
Deep Dive
Just One Chart…
As I noted above, I was out of pocket for the majority of last week, but I did come across this chart that I thought was worthy of sharing.
Just let this sink in for a little bit…
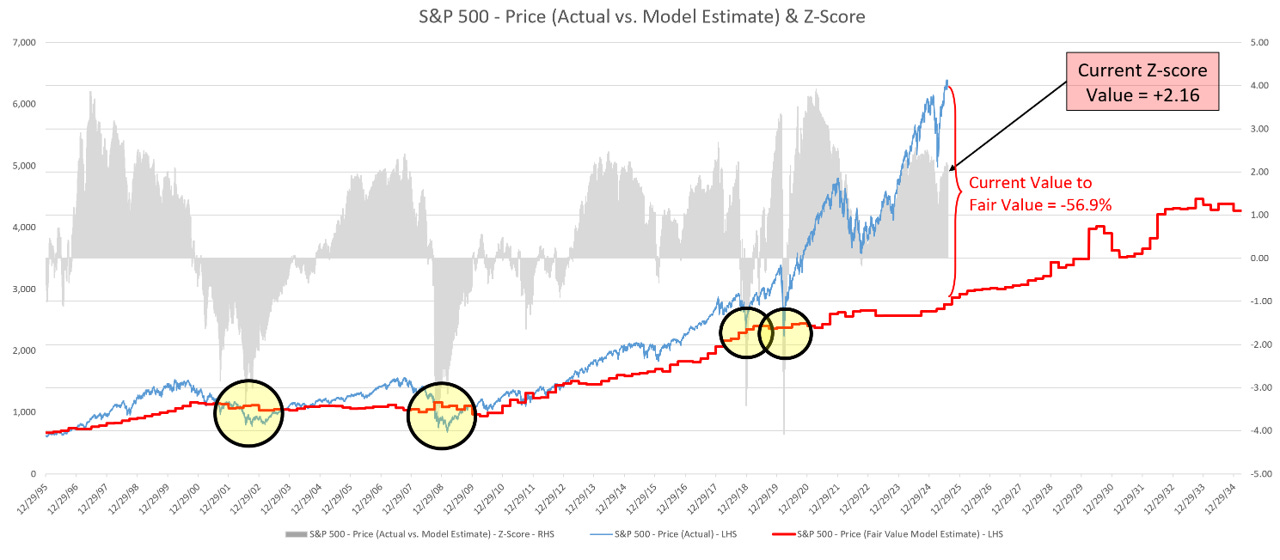
S&P 500 Fair Value Model
Here are the updated results from our proprietary S&P 500 fair value model.
The red line in the chart below is the fair value we have constructed for the S&P 500. Based on our model, the current fair value for the S&P 500 is 2,752.34.
Friday’s close on the S&P 500 was 6,389.44.
This means it would take a decline of -56.9% from the S&P 500’s current value to achieve our model-derived fair value.
Note: The market can remain well above fair value for extended periods. However, in deeper corrections (i.e., 2002, 2008, 2018, 2020, and in previous historical periods not shown on the chart below), the market always corrects back to the fair value line and often well below the fair value line (i.e., 2002, 2008, etc).
The Market Map - Extended Analysis
The following charts use the weekly time frame. Therefore, price targets and/or stop losses are expected to be achieved over the medium (3 months) to longer (12 months) term.
Note: The content of this newsletter is for educational purposes only. Price targets and/or stop losses should not be considered a recommendation to buy or sell any security. Please do your research and consult with a professional before making any investment decisions.
Chart Notes:
📈📉Trend = Structural bias of the market.
⬆️ = The market is currently in a bullish trend and therefore should move higher over the medium term.
⬇️ = The market is currently in a bearish trend and therefore should move lower over the medium term.
🎯 Target = The price we believe (although not guaranteed) the market will achieve over the medium term.
“Undefined (see 4-hour timeframe)” = We use this description when markets close at (or near) new all-time highs, and we do not have a valid reference point for a target. The path of least resistance is likely higher; however, you should reference the 4-hour timeframe to identify potential turning points.
🛑 Stop Loss = The price at which our target price objective has been negated, and we need to reassess the structural trend bias of the market.
🟨 Yellow Boxes = Supply/demand zones that price should gravitate towards over time.
Indices:
S&P 500
📈 Trend = ⬆️ / 🎯 Target = 6,427 / 🛑 Stop Loss = 4,835

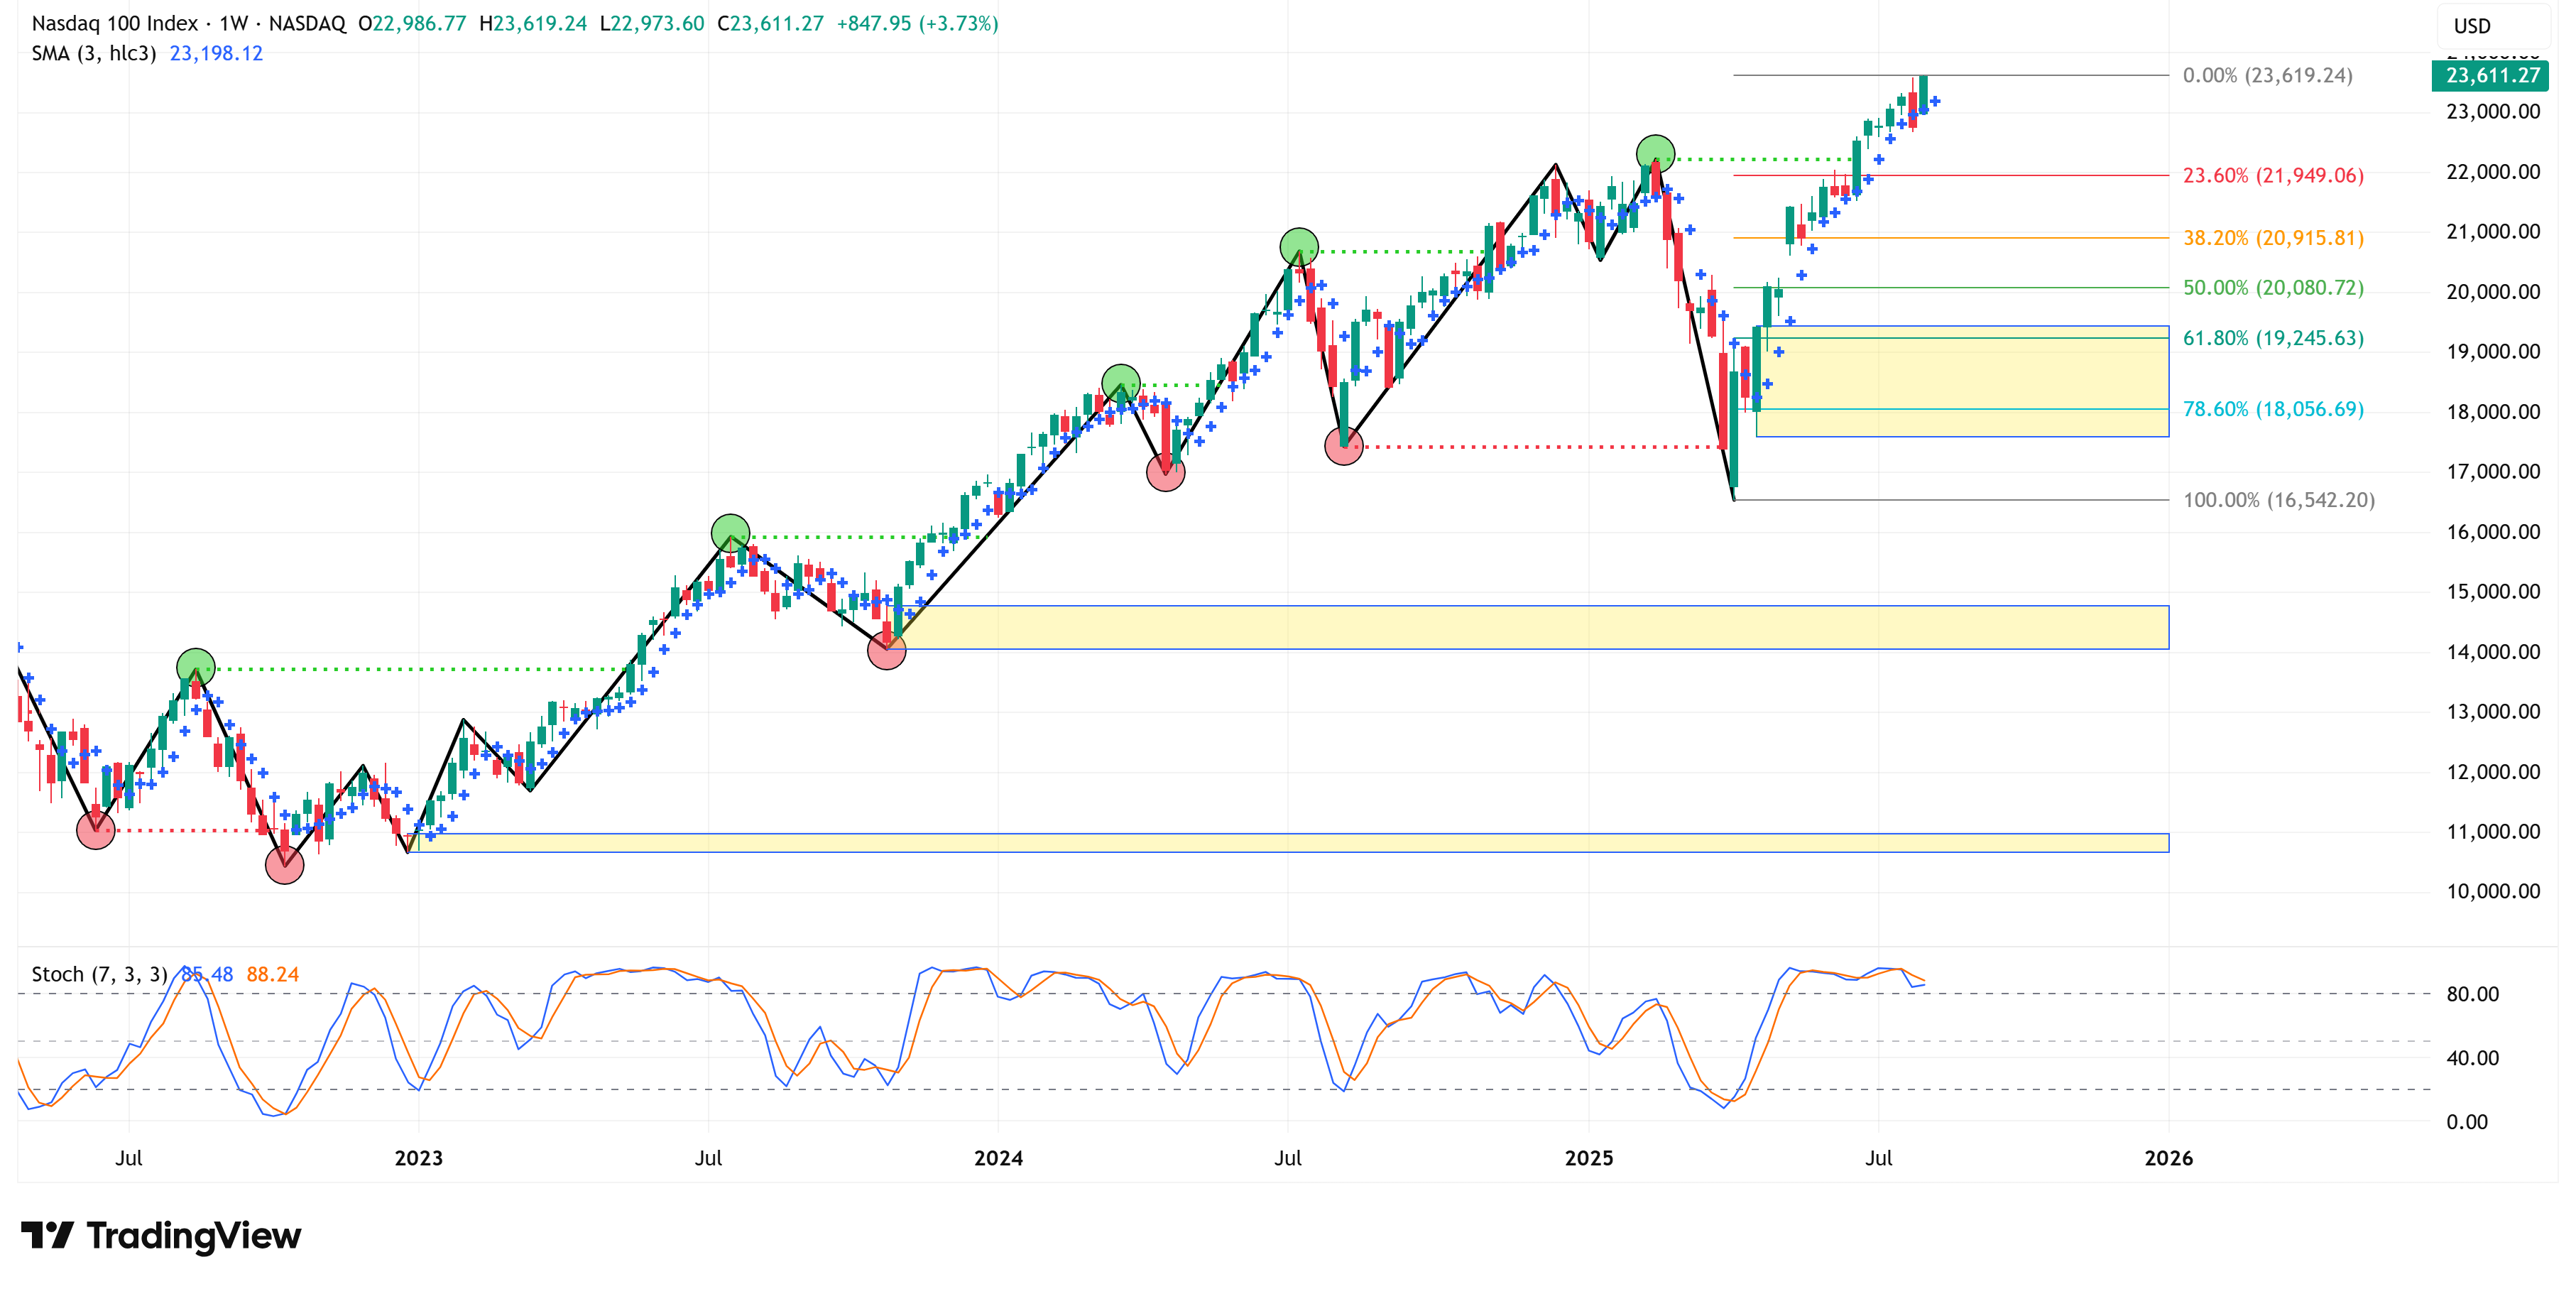
NASDAQ 100
📈 Trend = ⬆️ / 🎯 Target = Undefined (see 4-hour timeframe) / 🛑 Stop Loss = 16,542
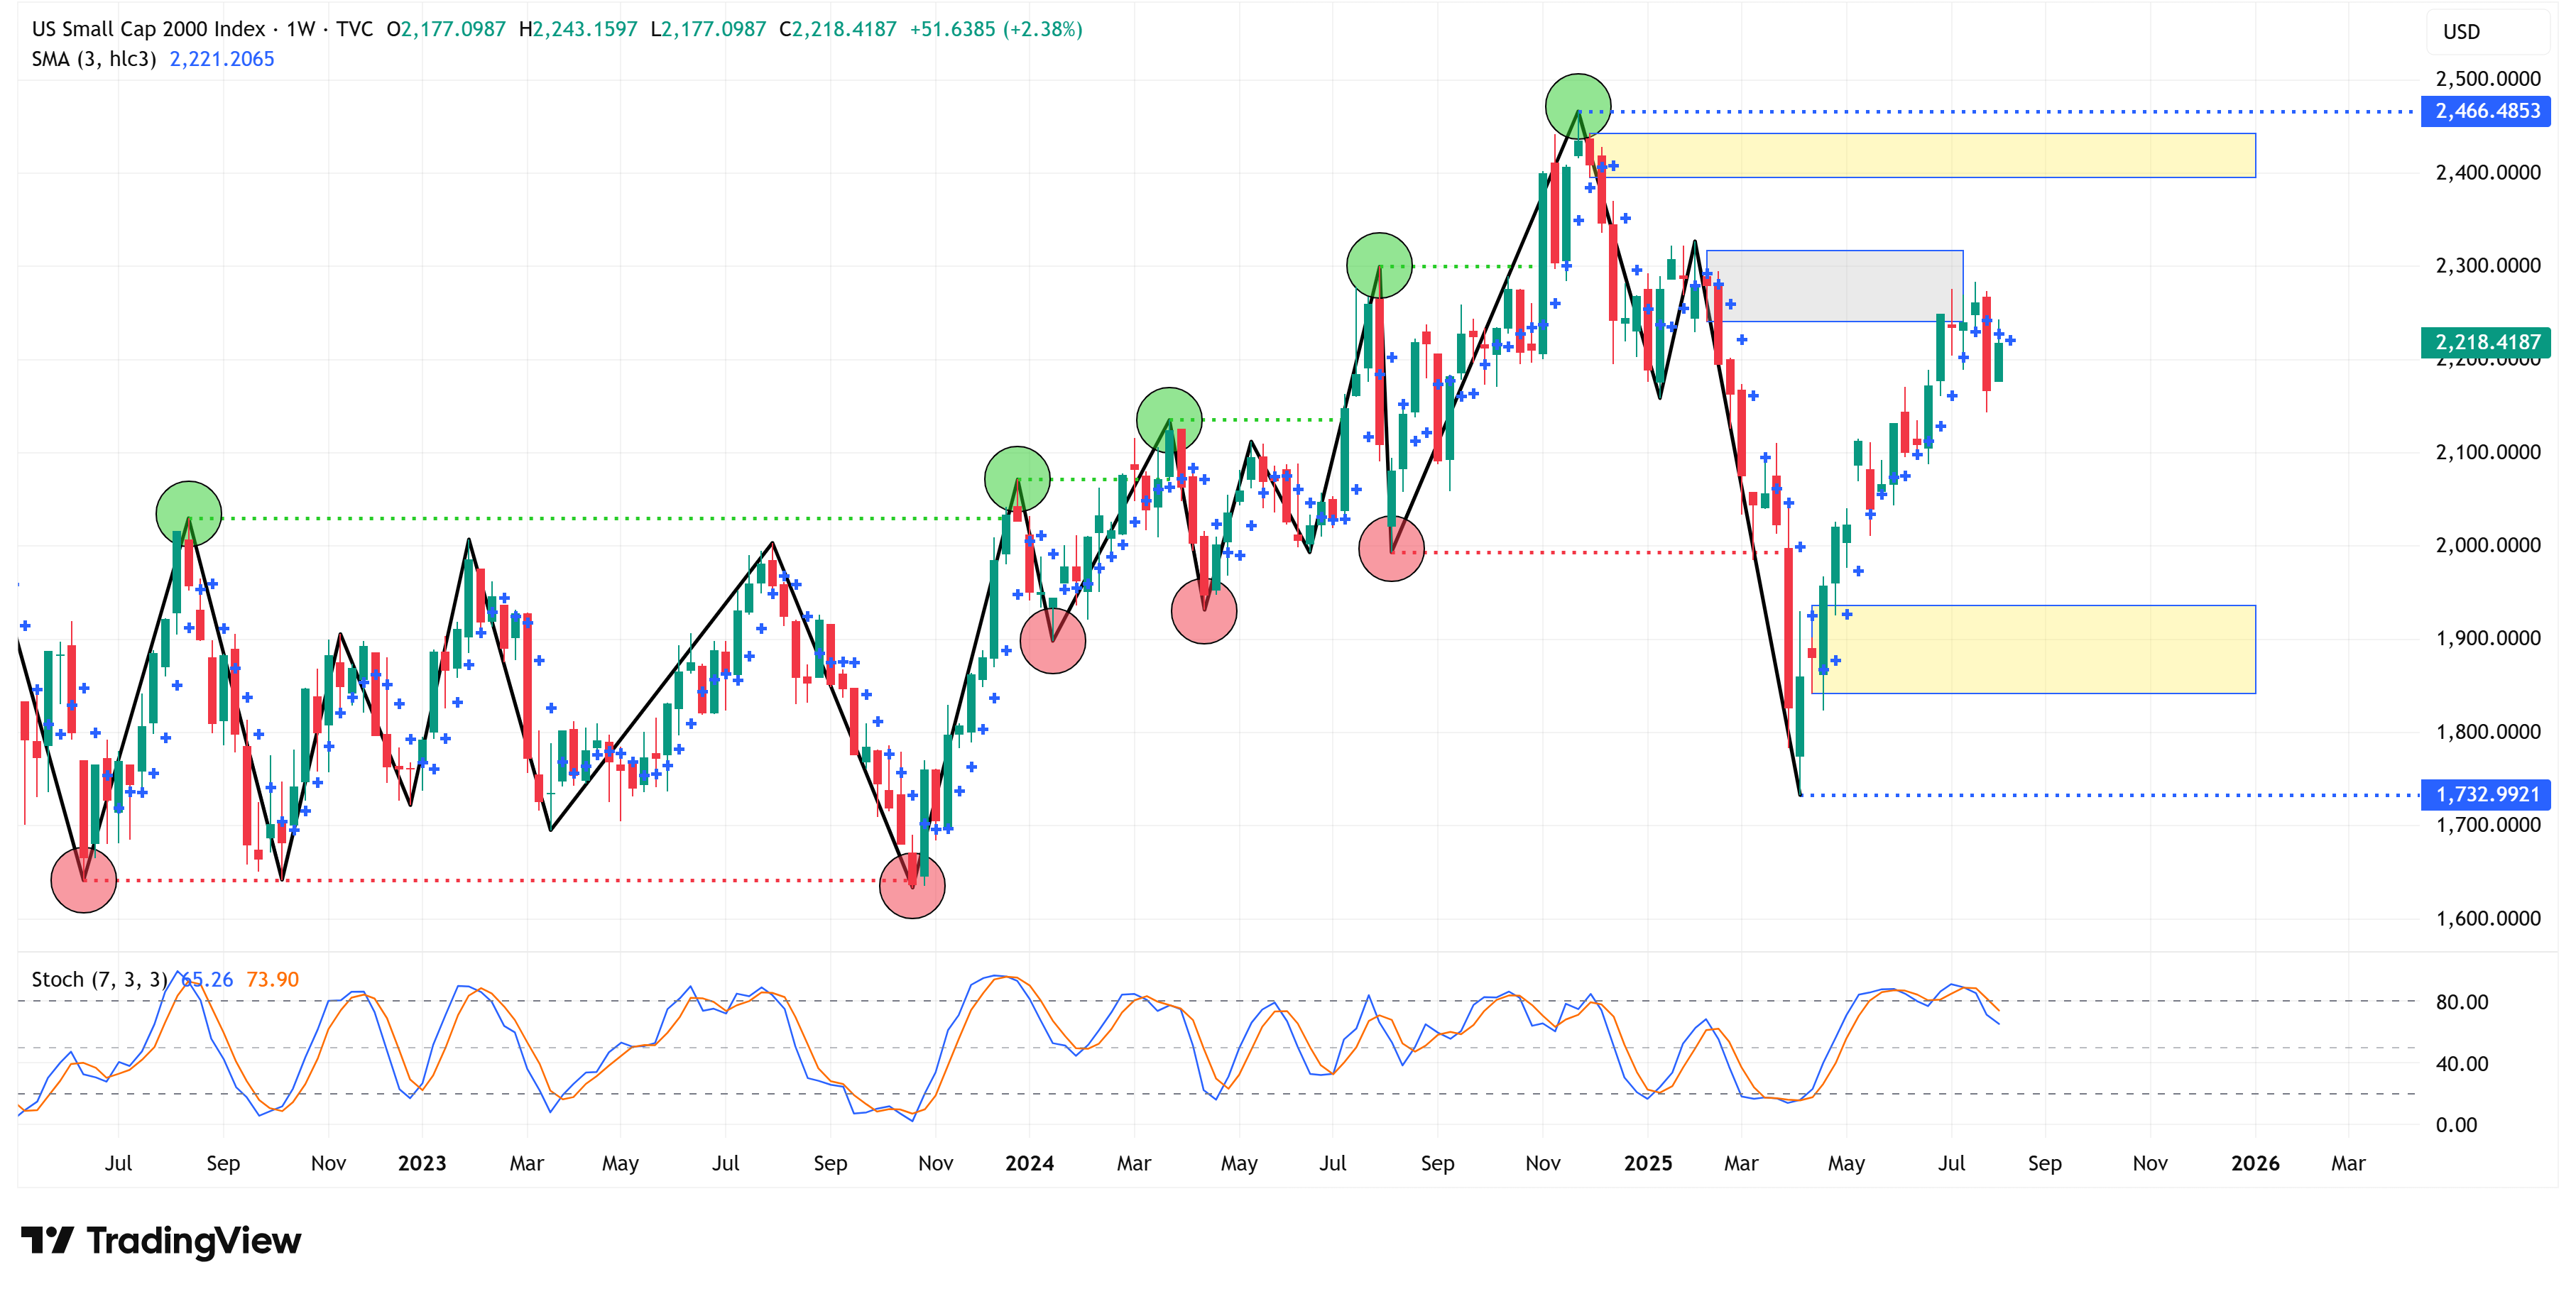
Russell 2000
📉 Trend = ⬇️ / 🎯 Target = 1,733 / 🛑 Stop Loss = 2,466
Sectors:
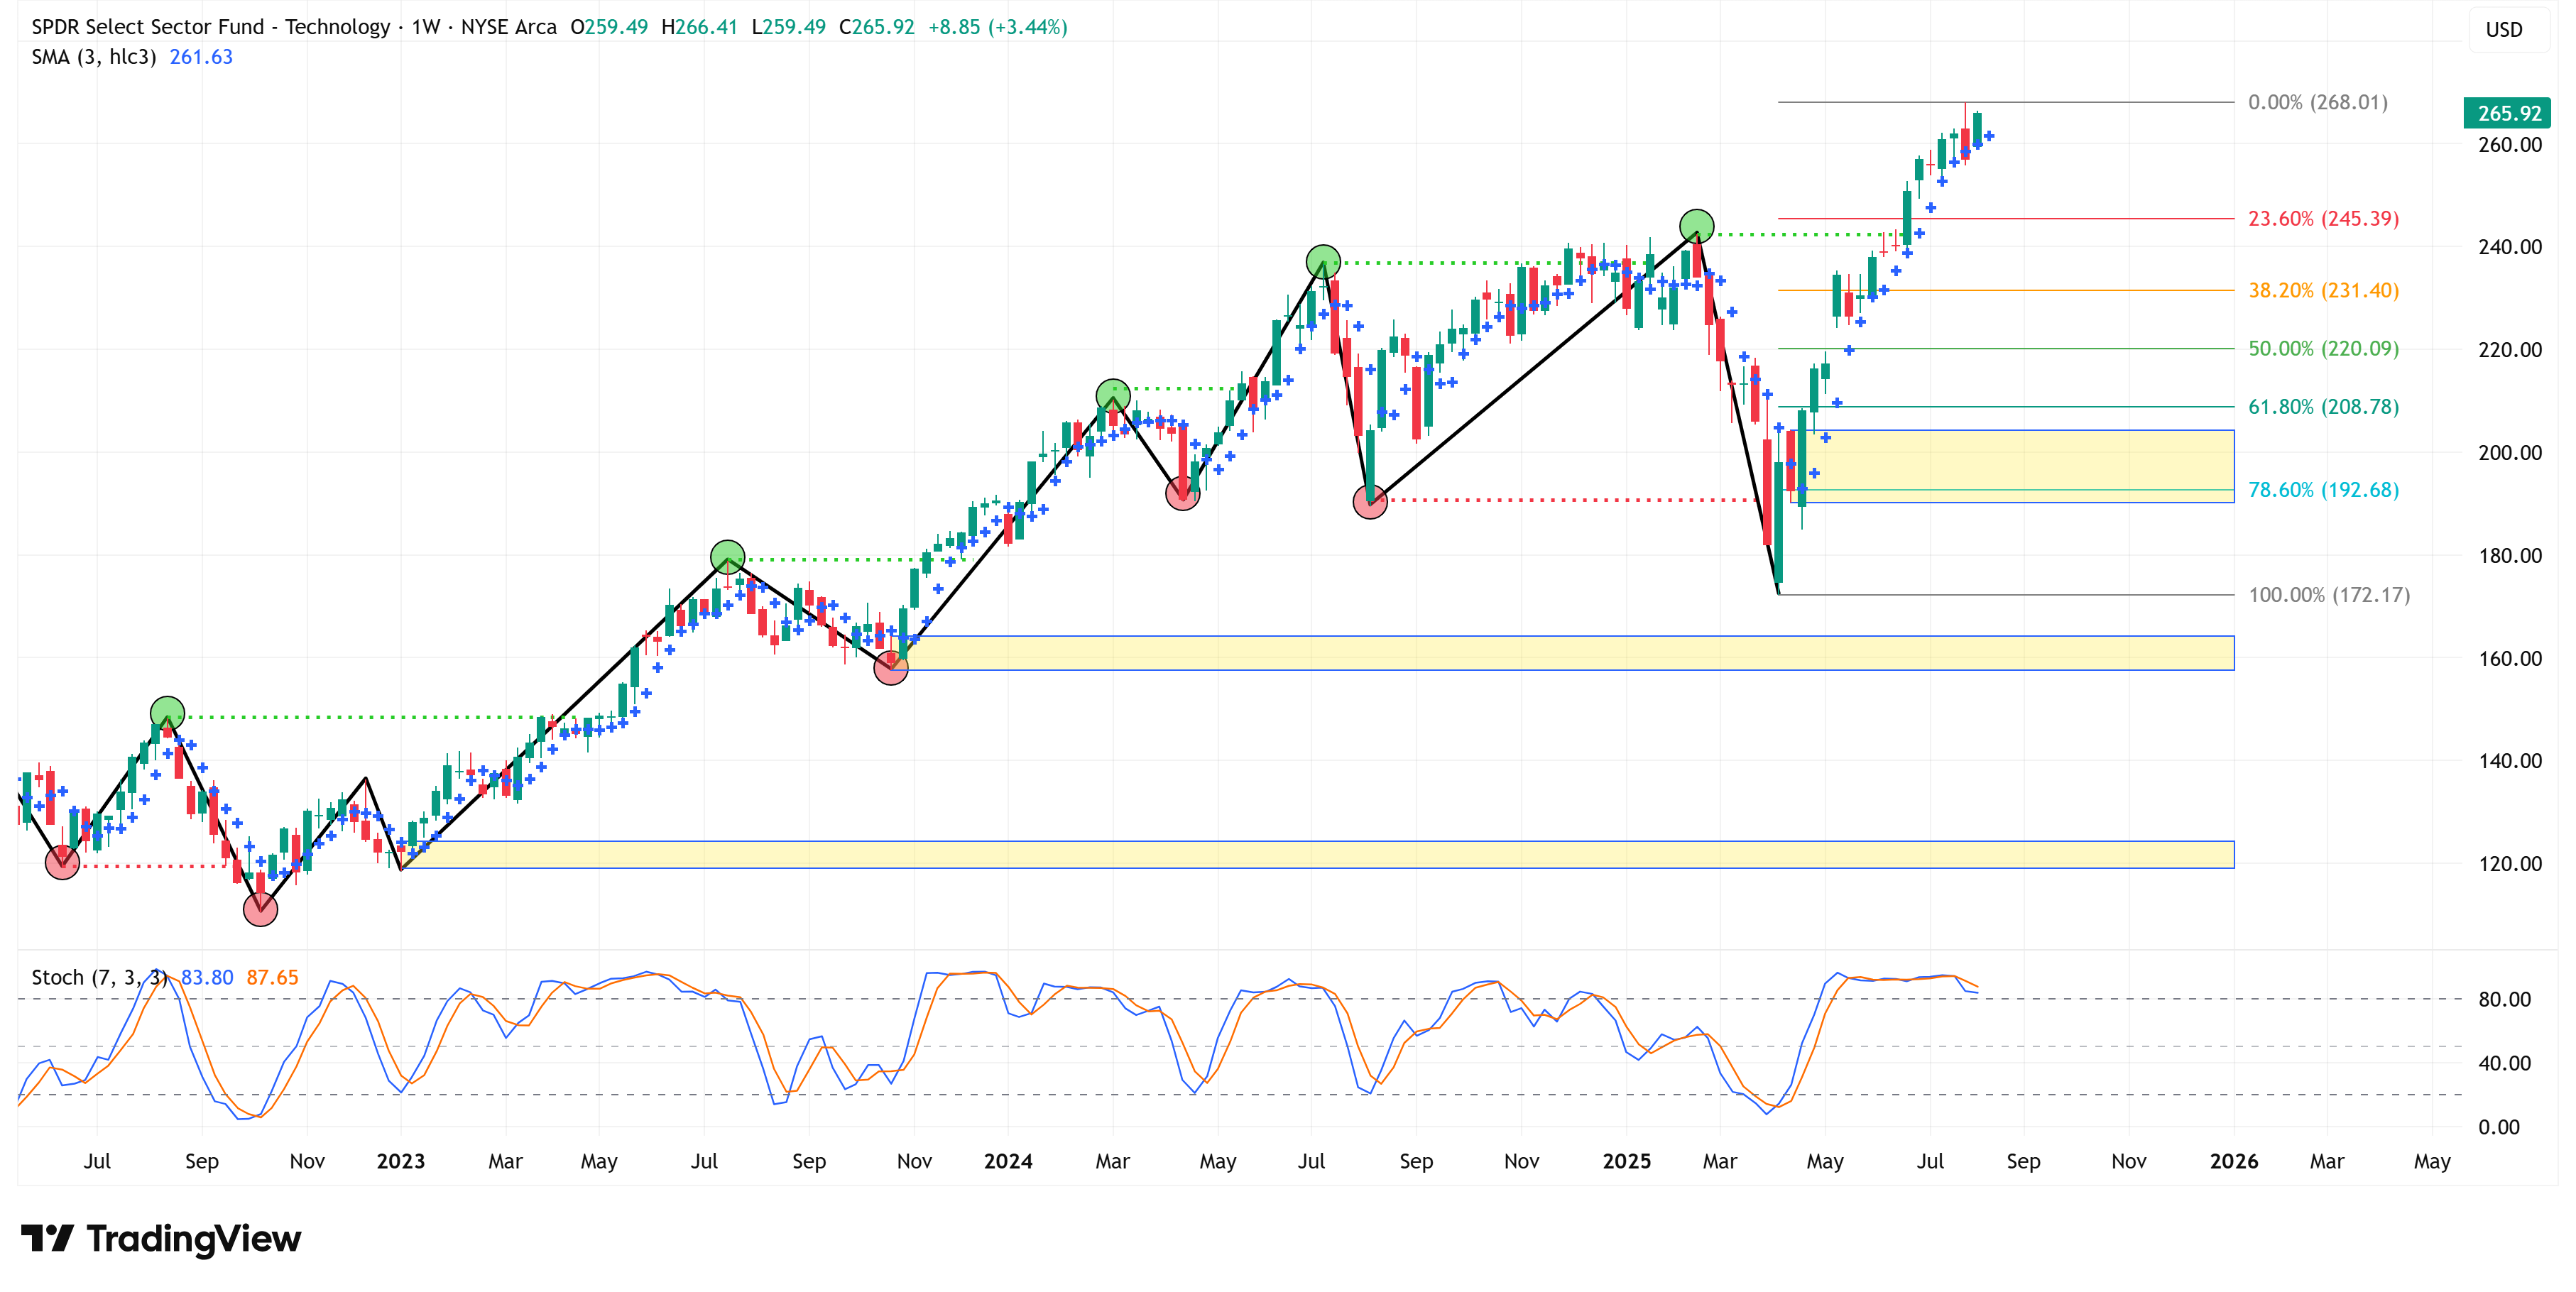
Technology
📈 Trend = ⬆️ / 🎯Target = 268.01 / 🛑Stop Loss = 172.17
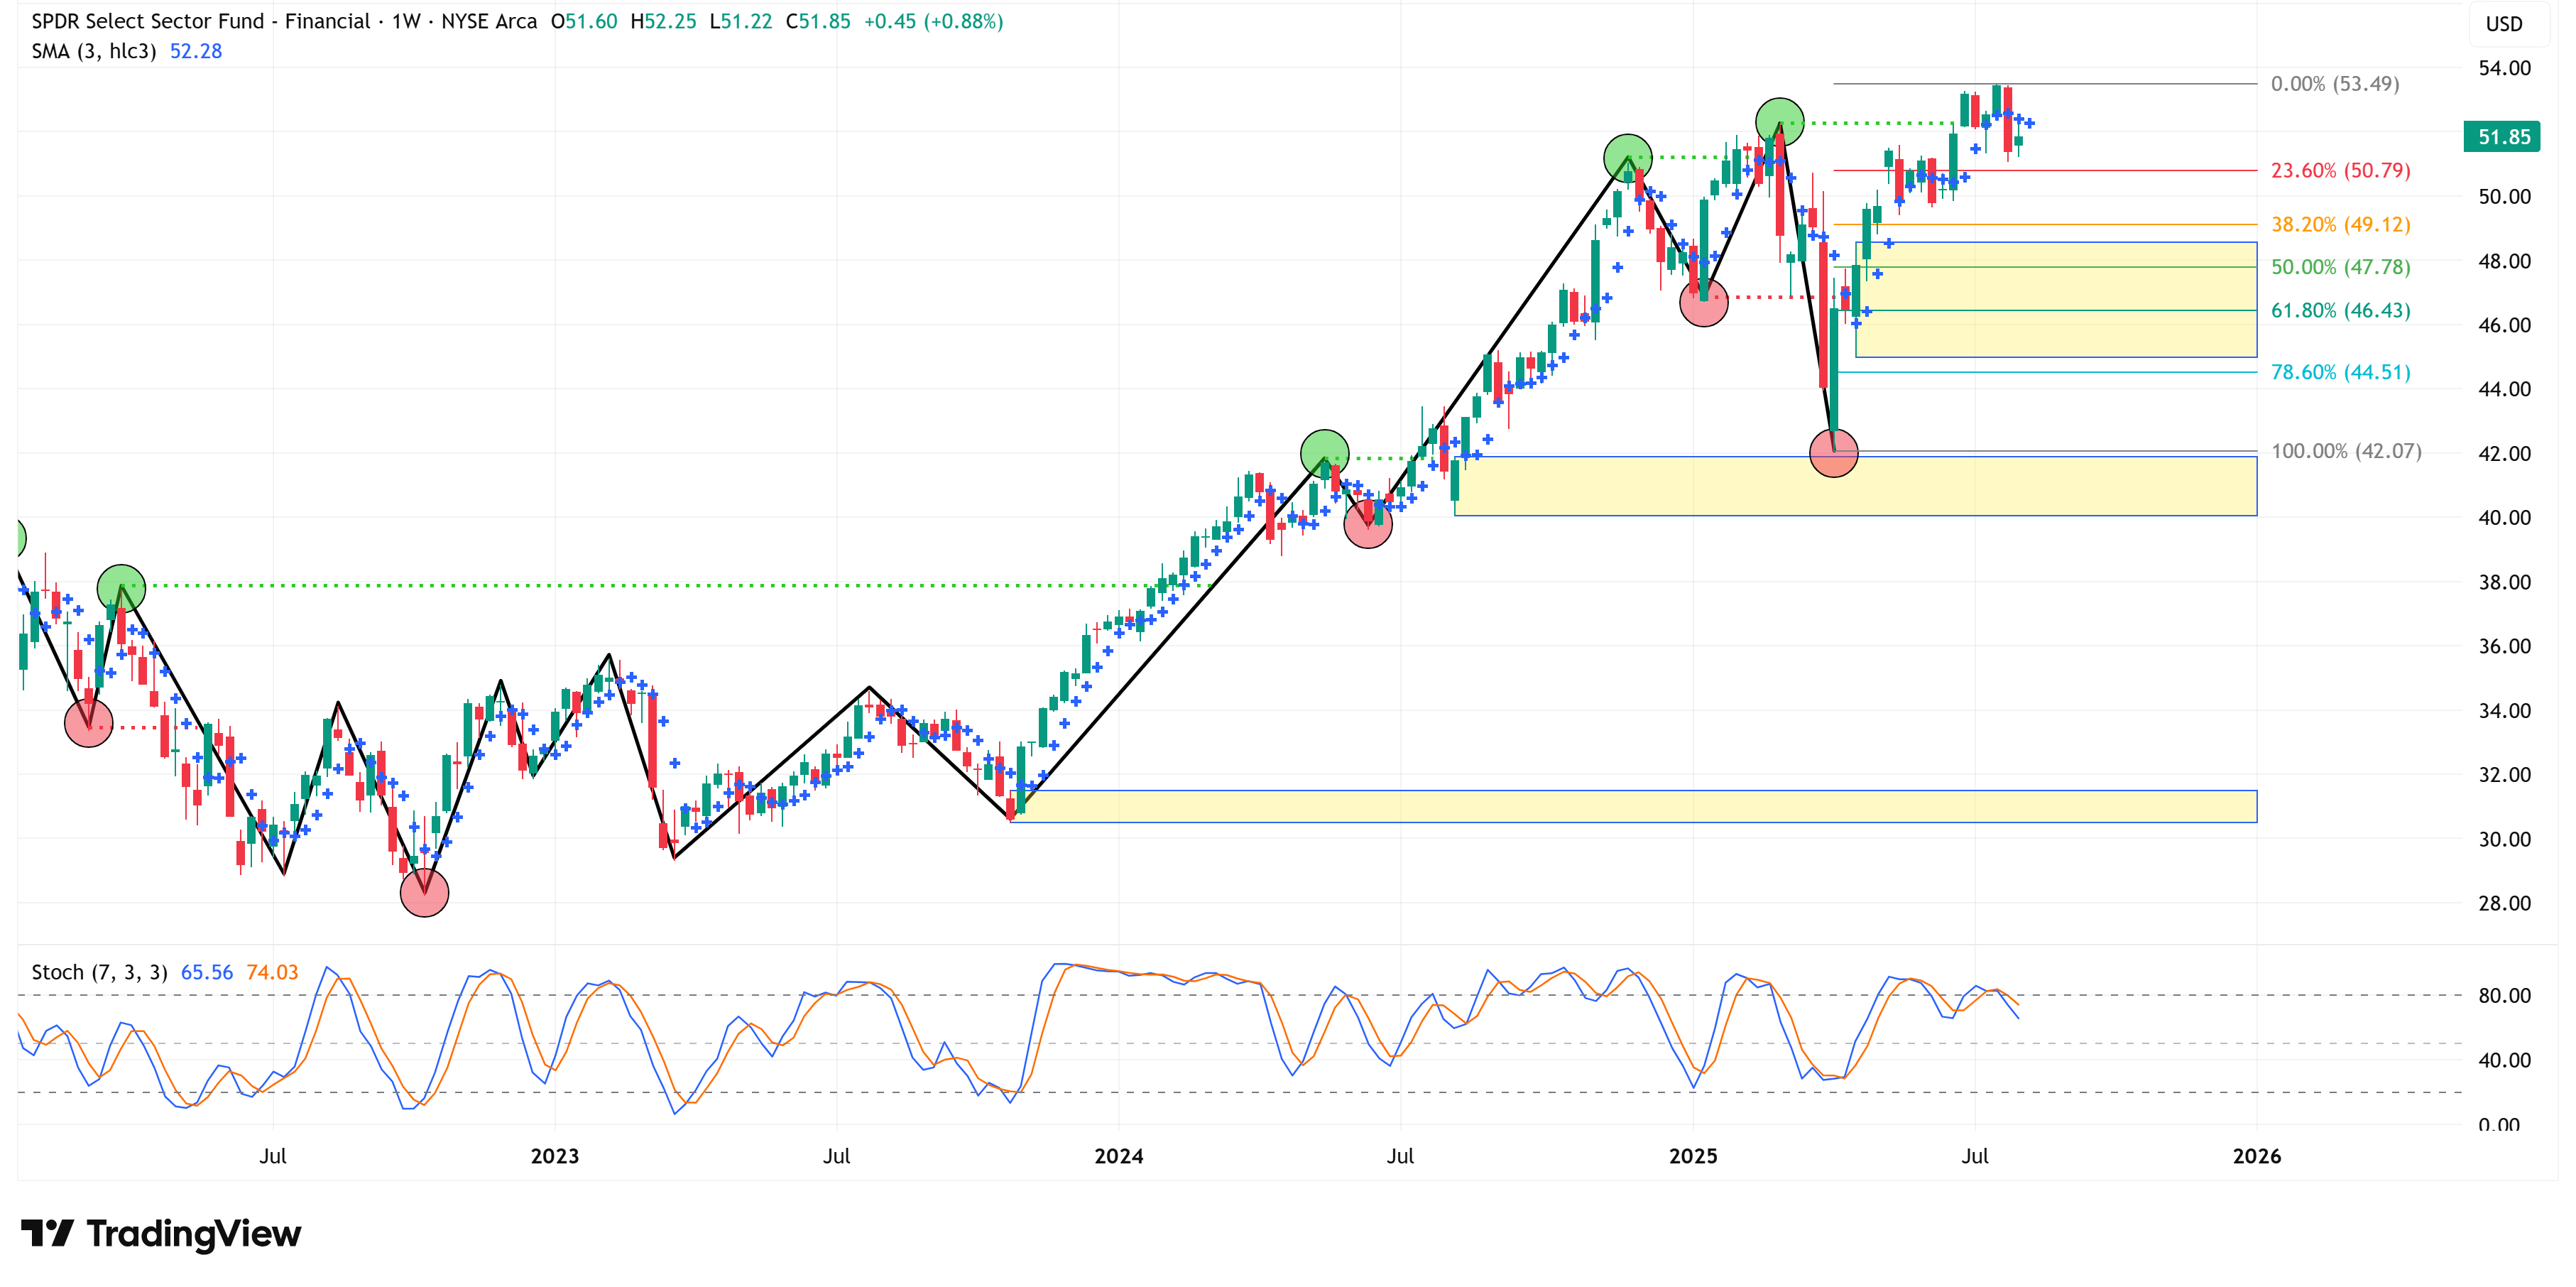
Financial
📈 Trend = ⬆️ / 🎯 Target = 53.49 / 🛑 Stop Loss = 42.07
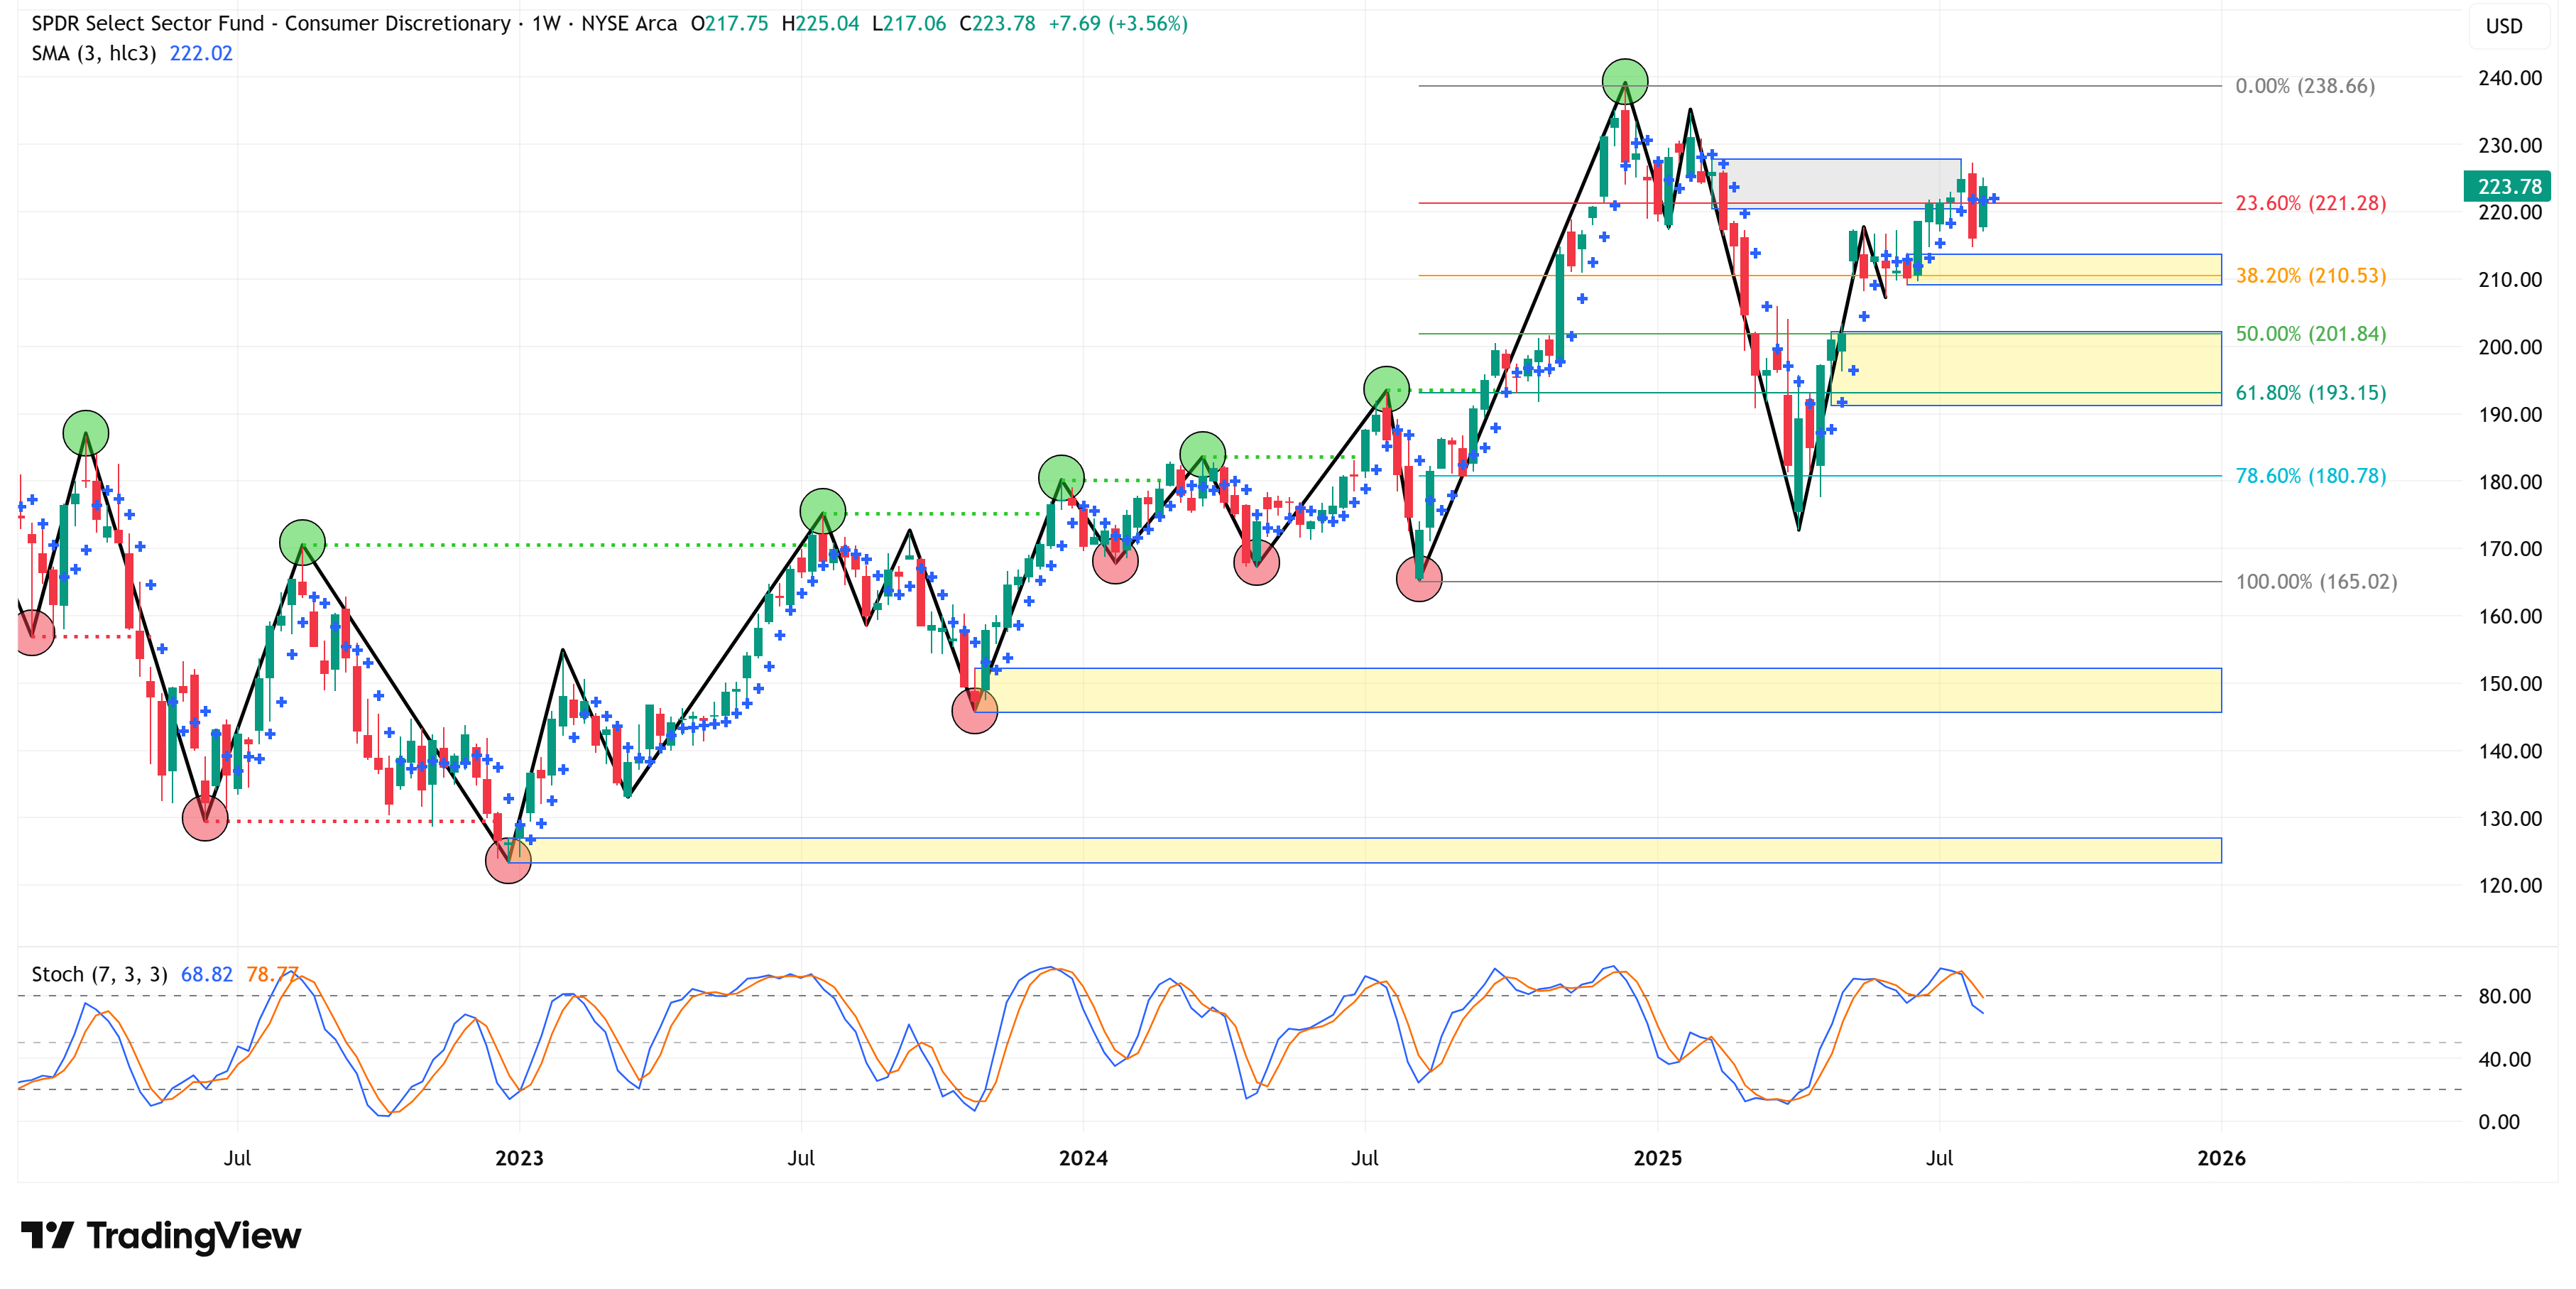
Consumer Discretionary
📈 Trend = ⬆️ / 🎯 Target = 238.66 / 🛑 Stop Loss = 165.02
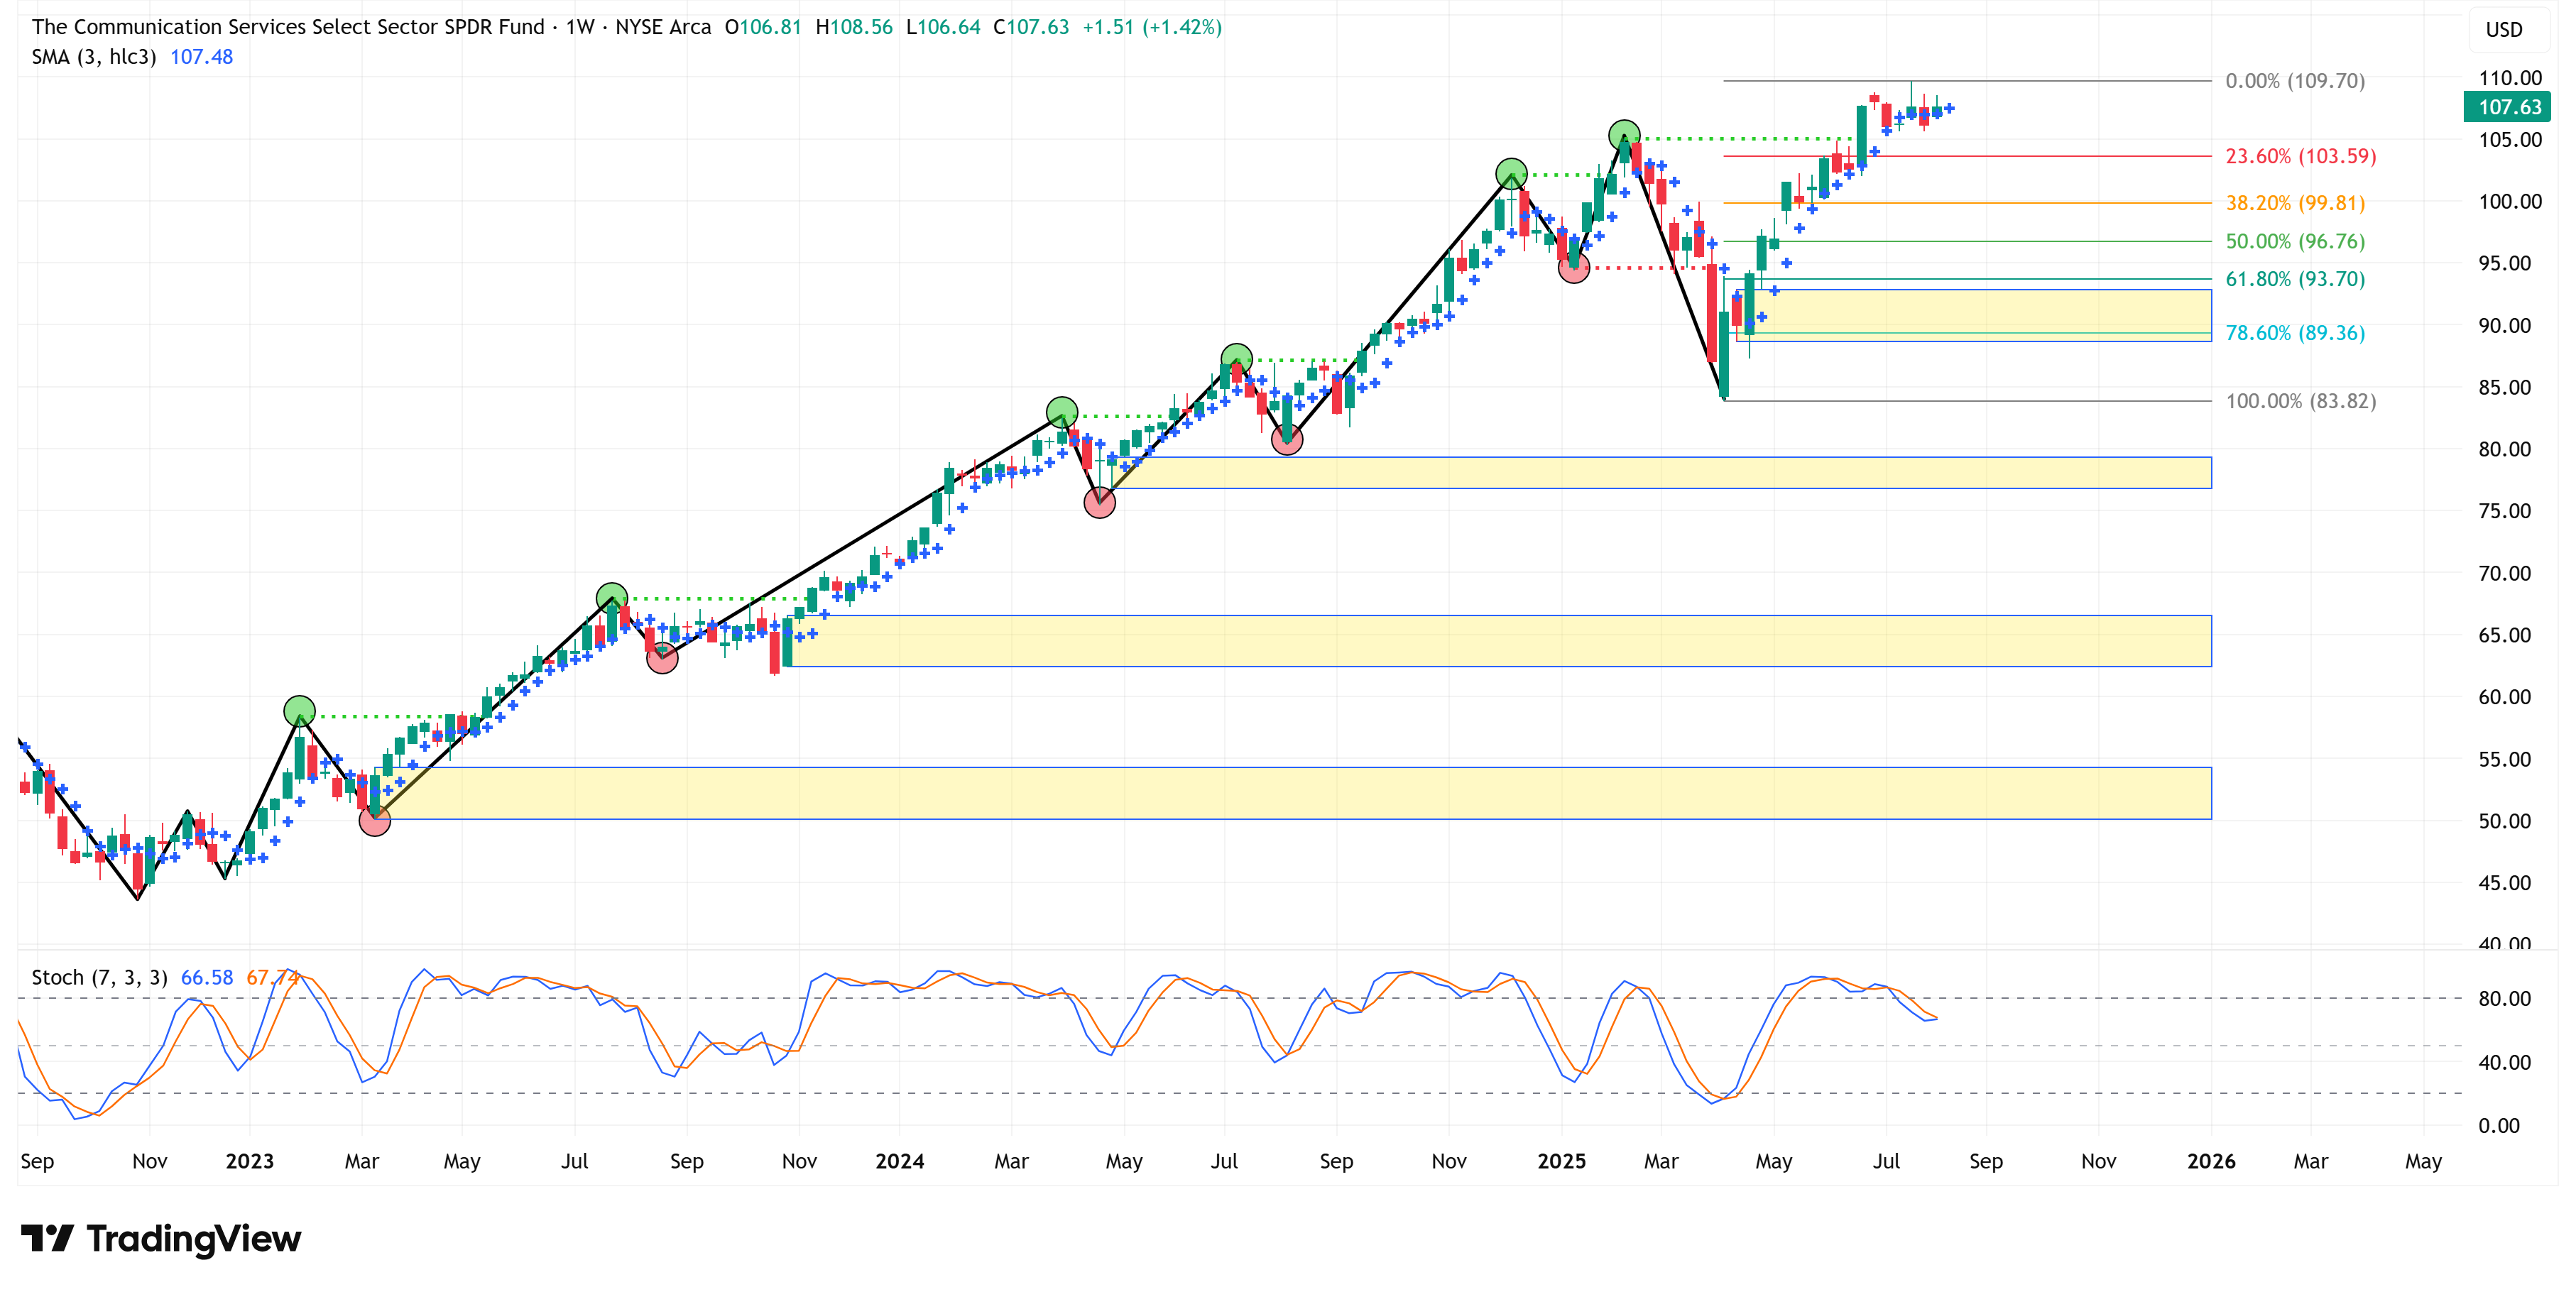
Communication Services
📈 Trend = ⬆️ / 🎯 Target = 109.70 / 🛑 Stop Loss = 83.82
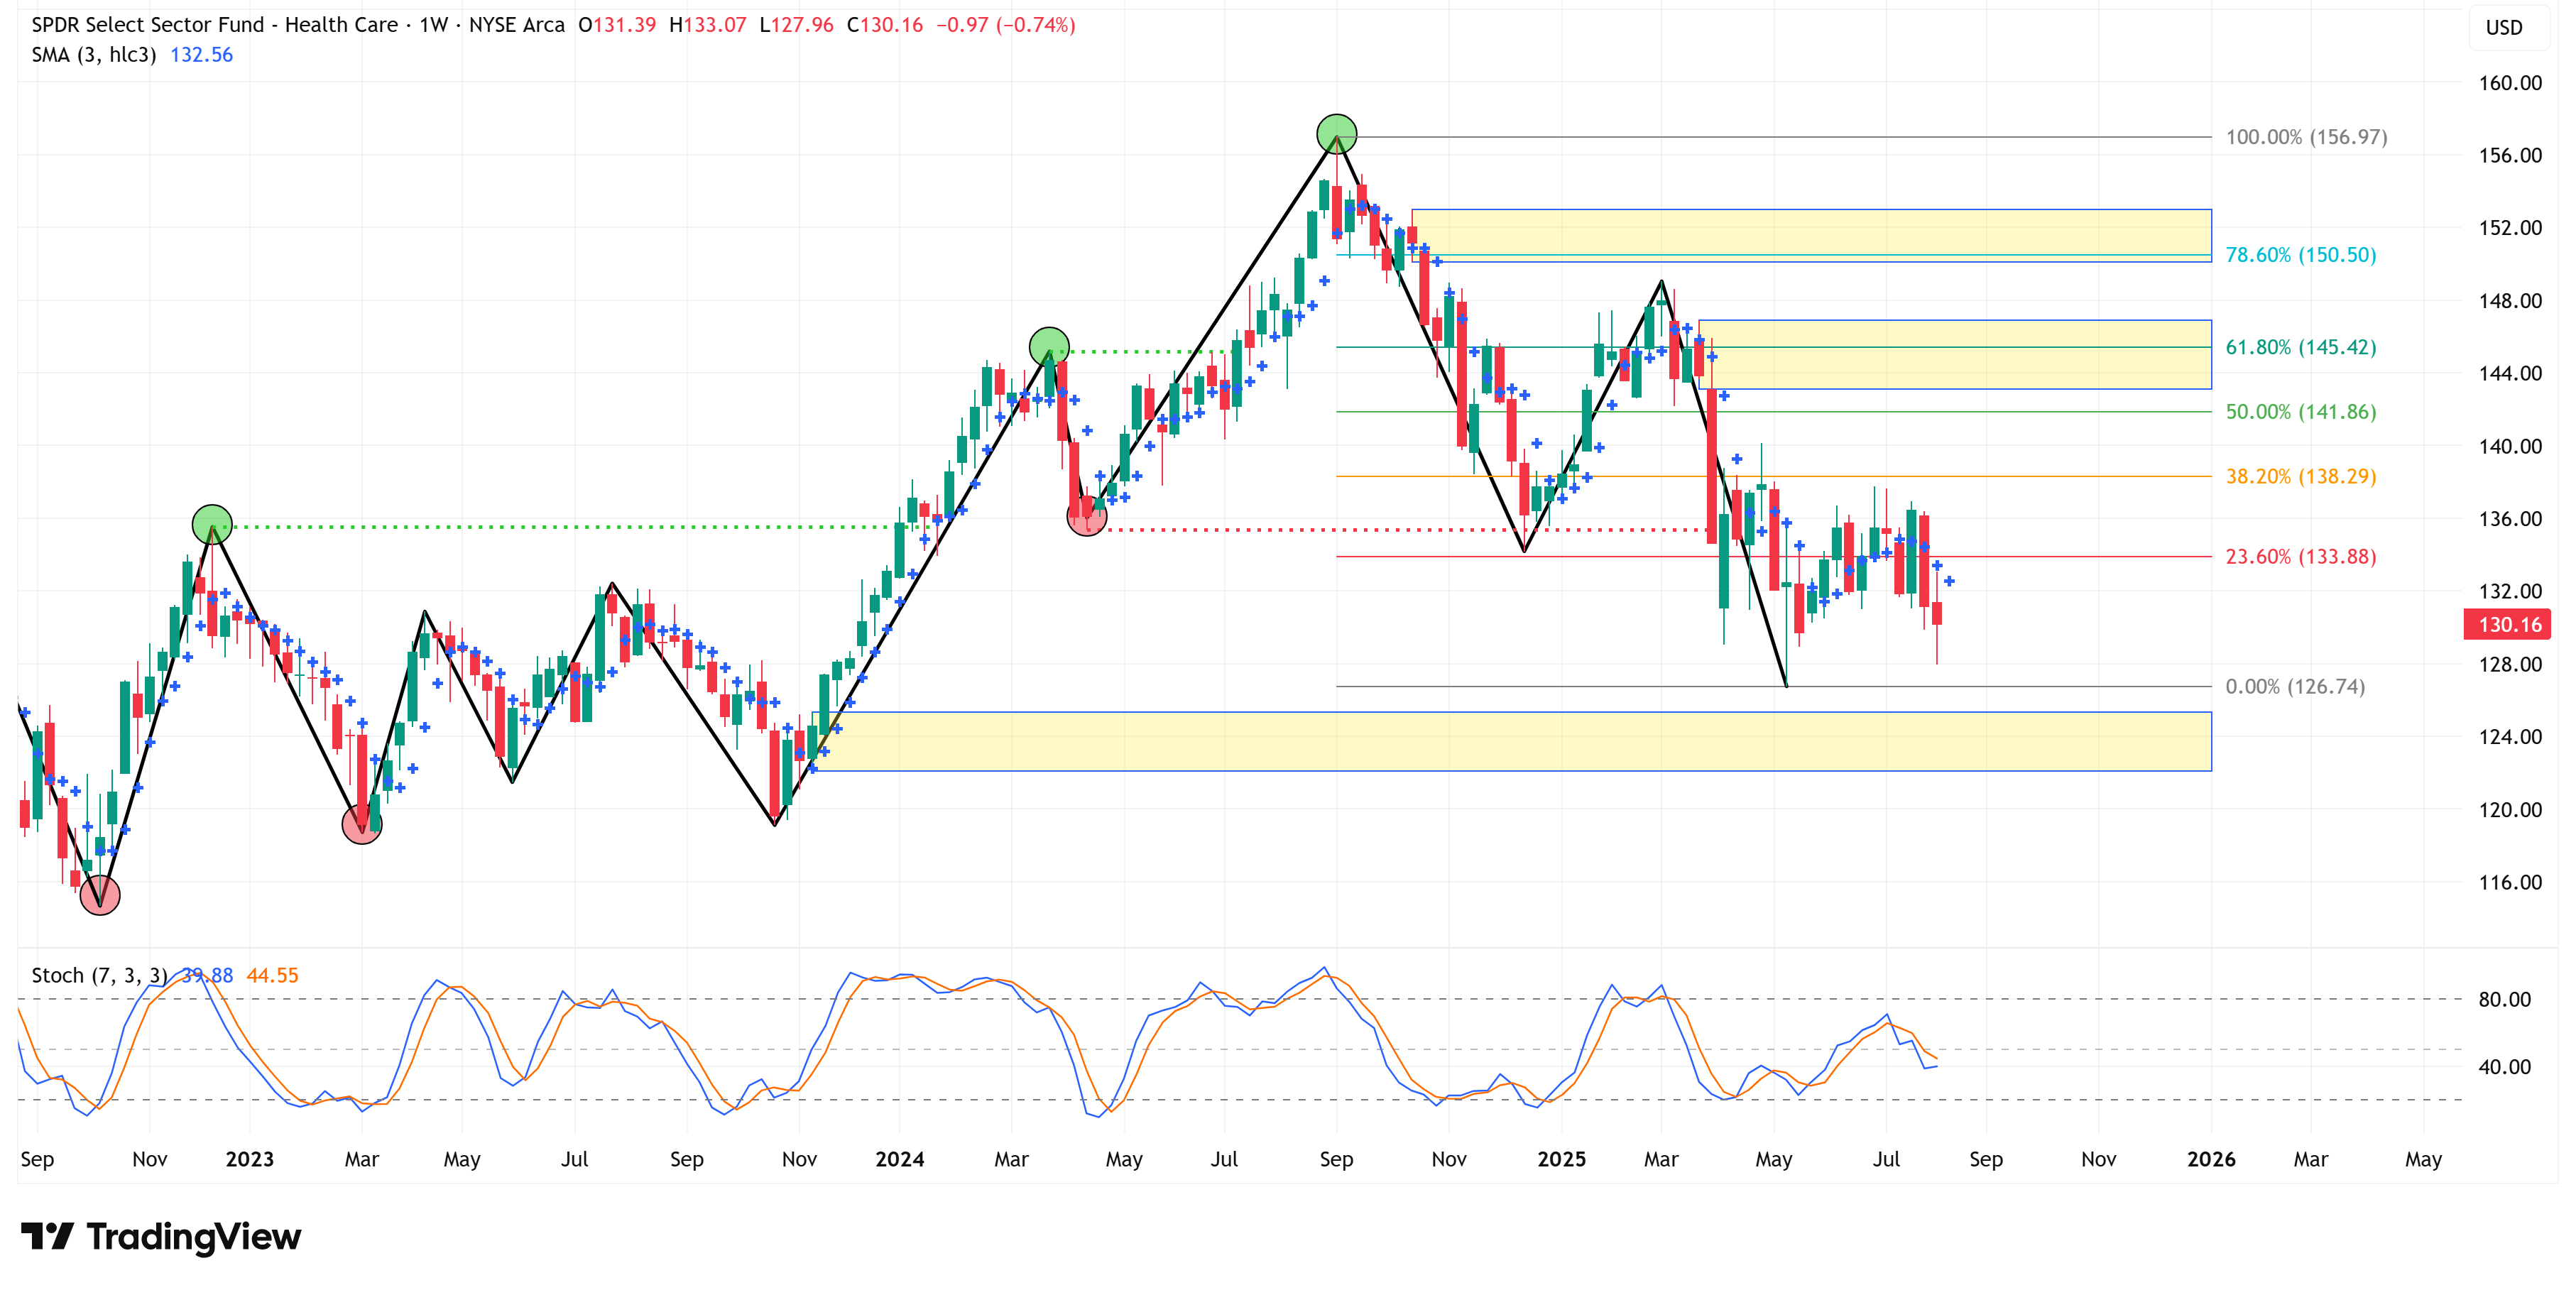
Health Care
📉 Trend = ⬇️ / 🎯 Target = 126.74 / 🛑 Stop Loss = 156.97
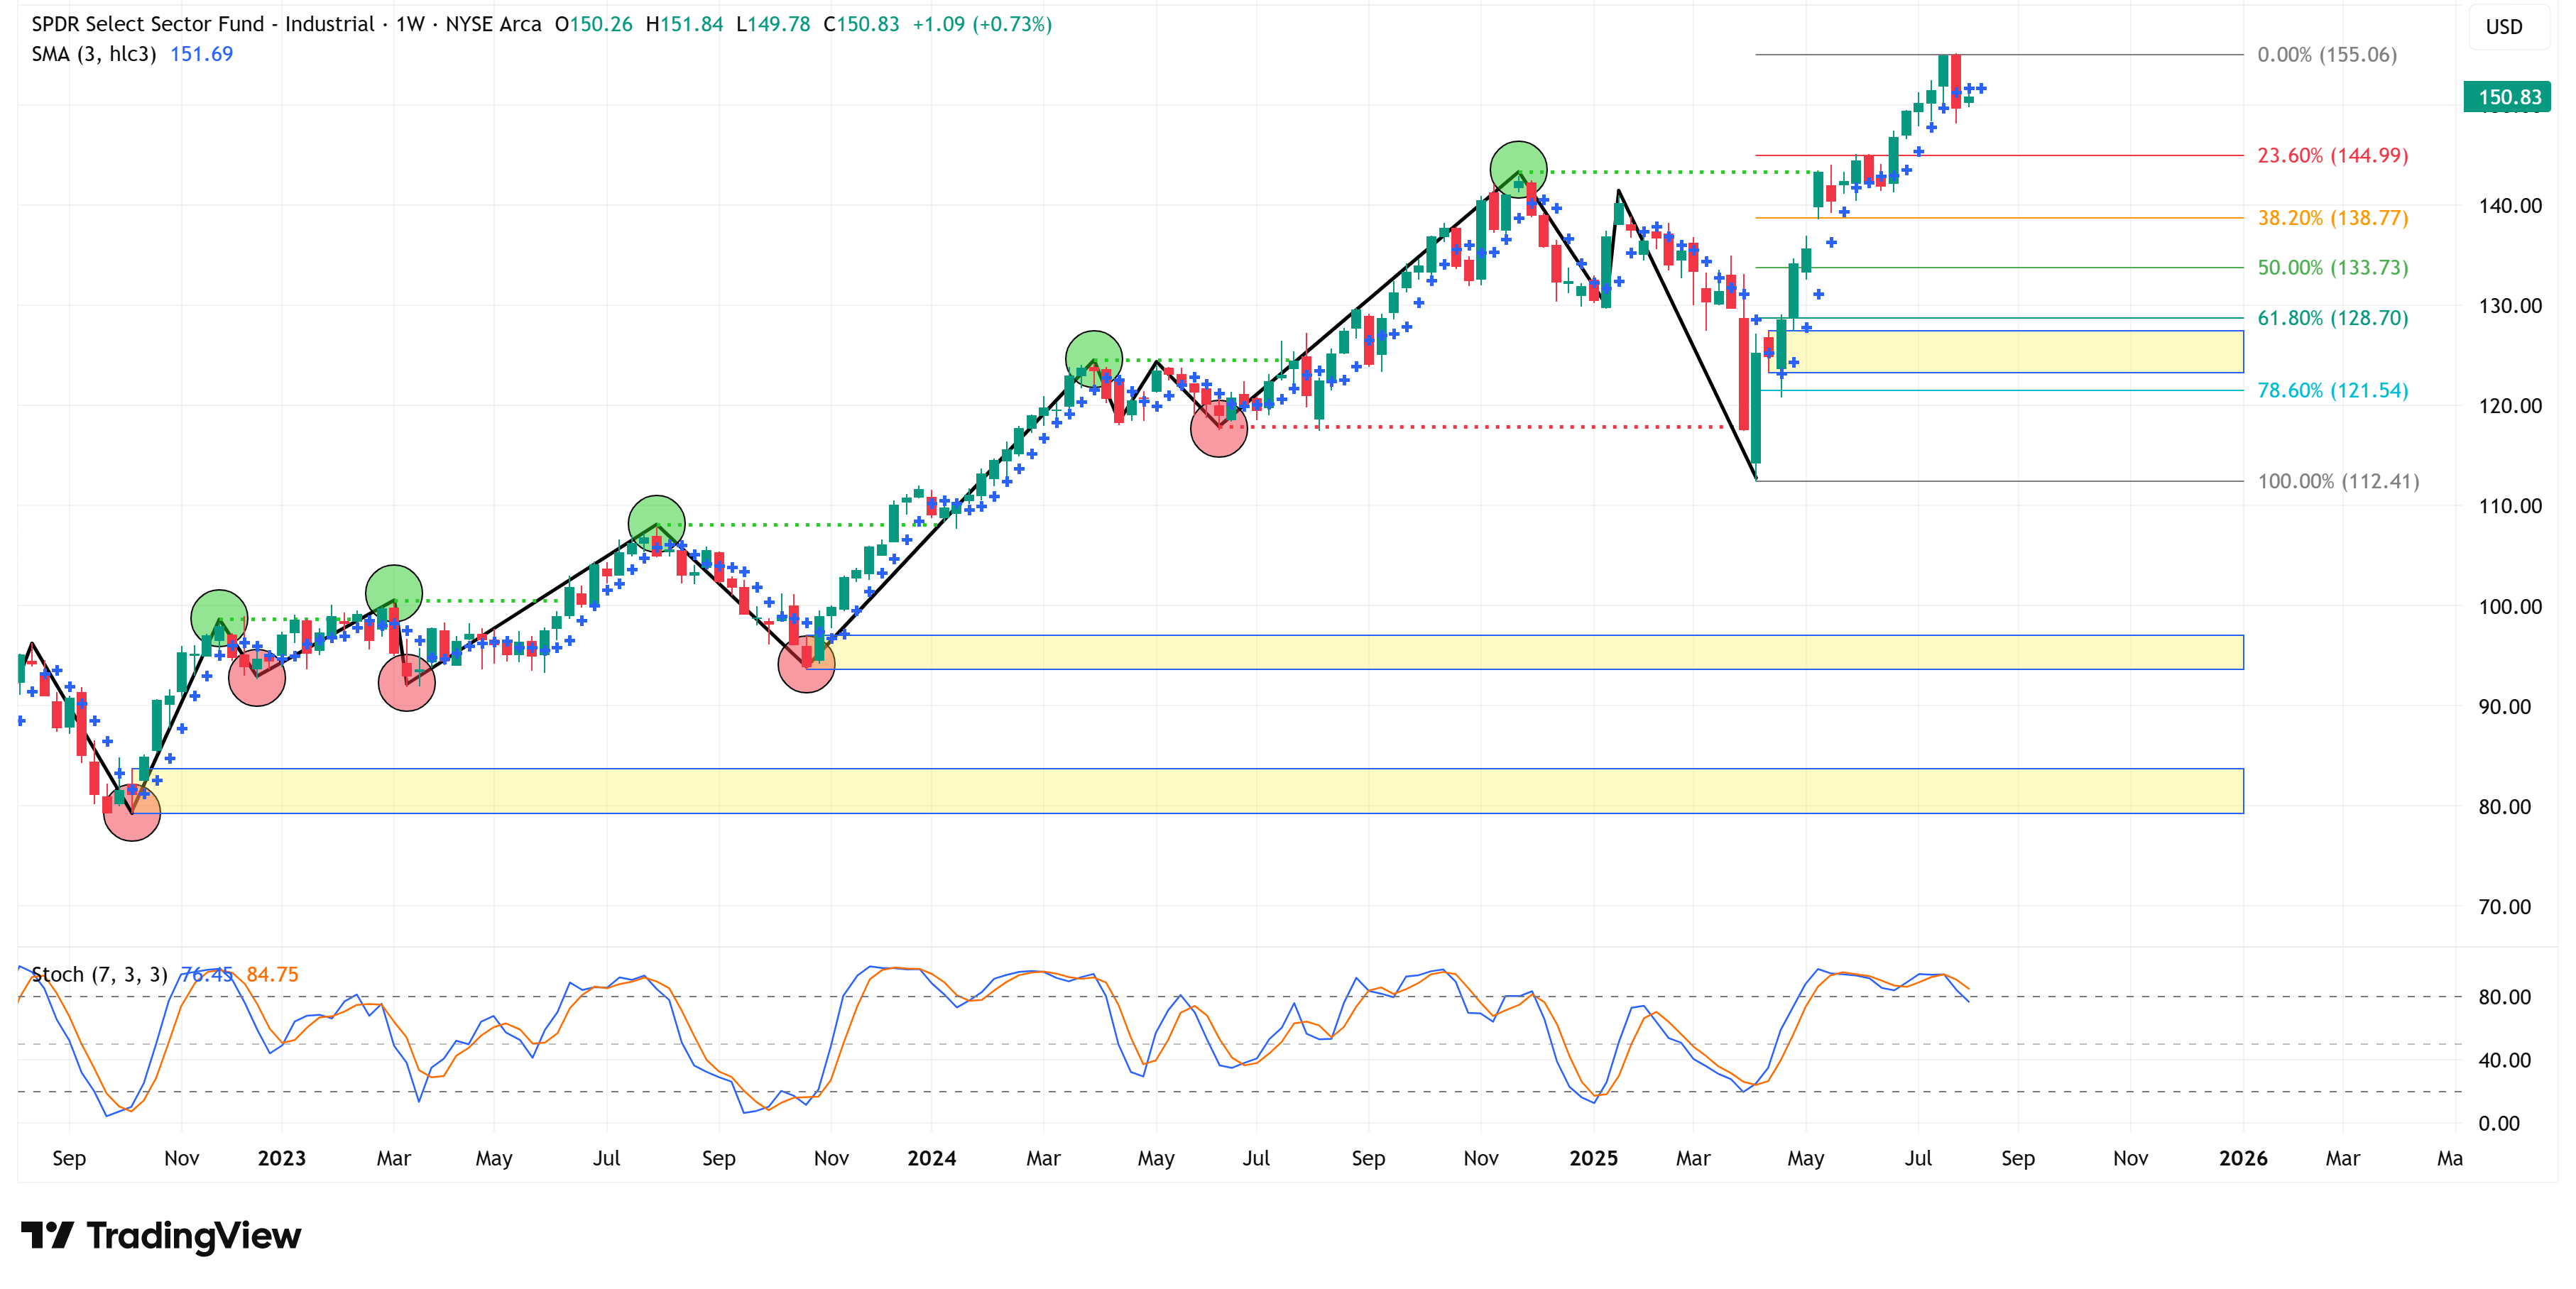
Industrials
📈 Trend = ⬆️ / 🎯 Target = 155.06 / 🛑 Stop Loss = 112.41
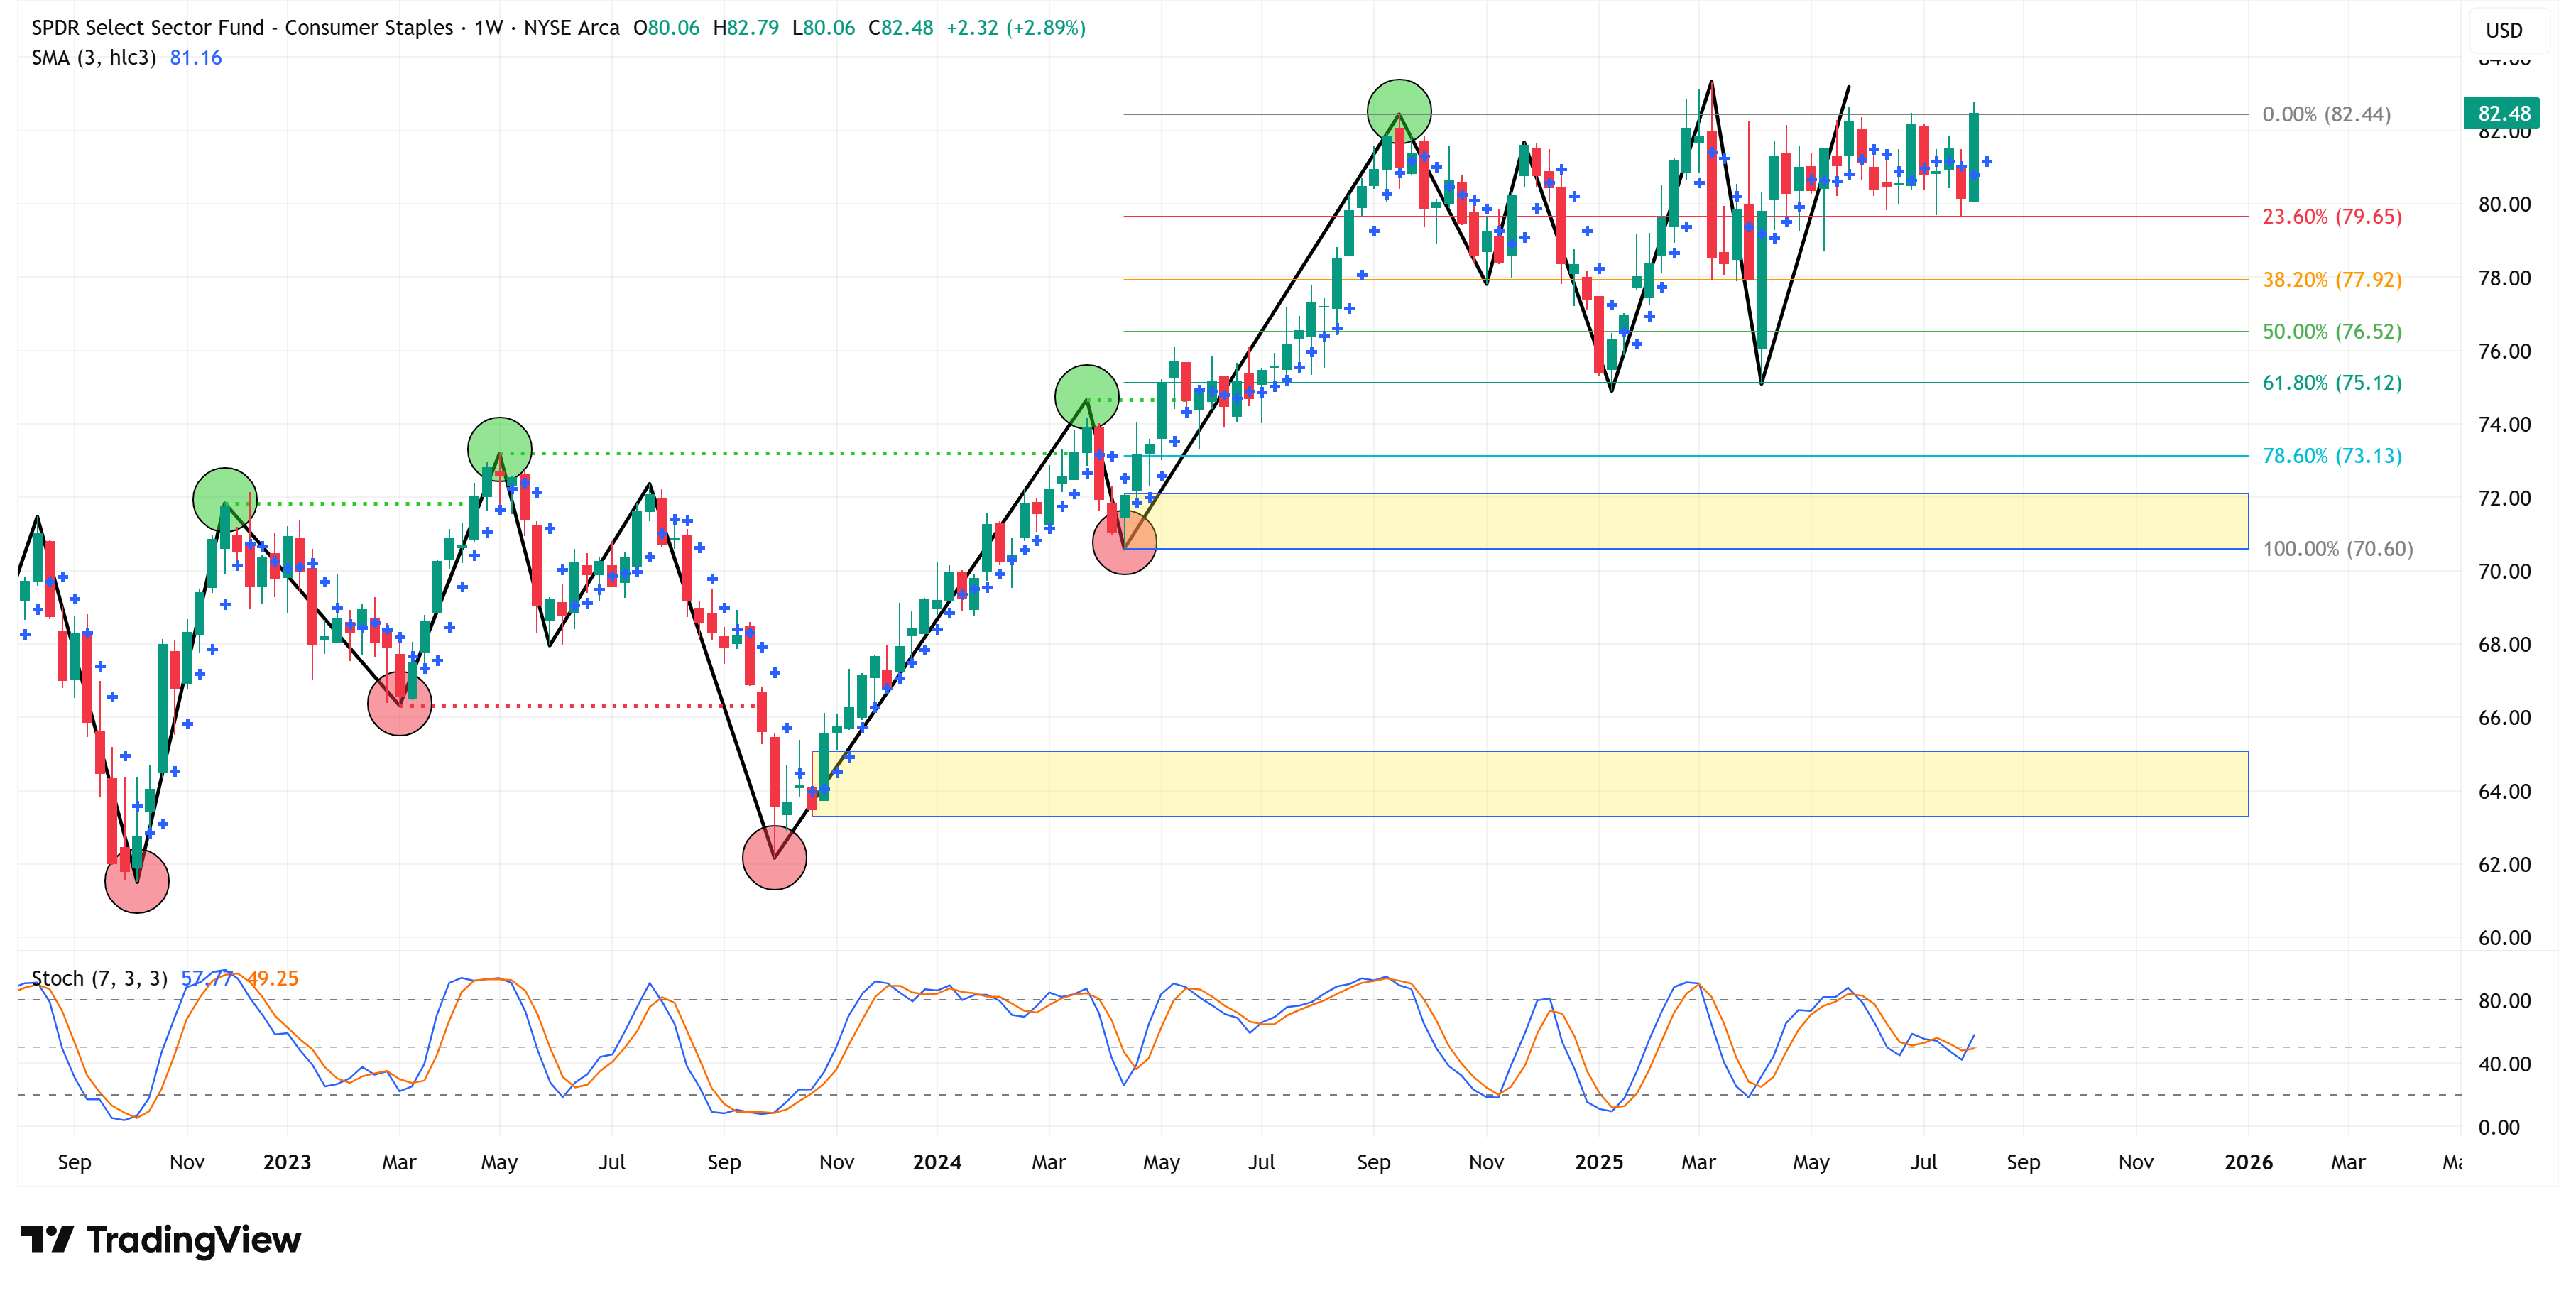
Consumer Staples
📈 Trend = ⬆️ / 🎯 Target = 82.44 / 🛑 Stop Loss = 70.60
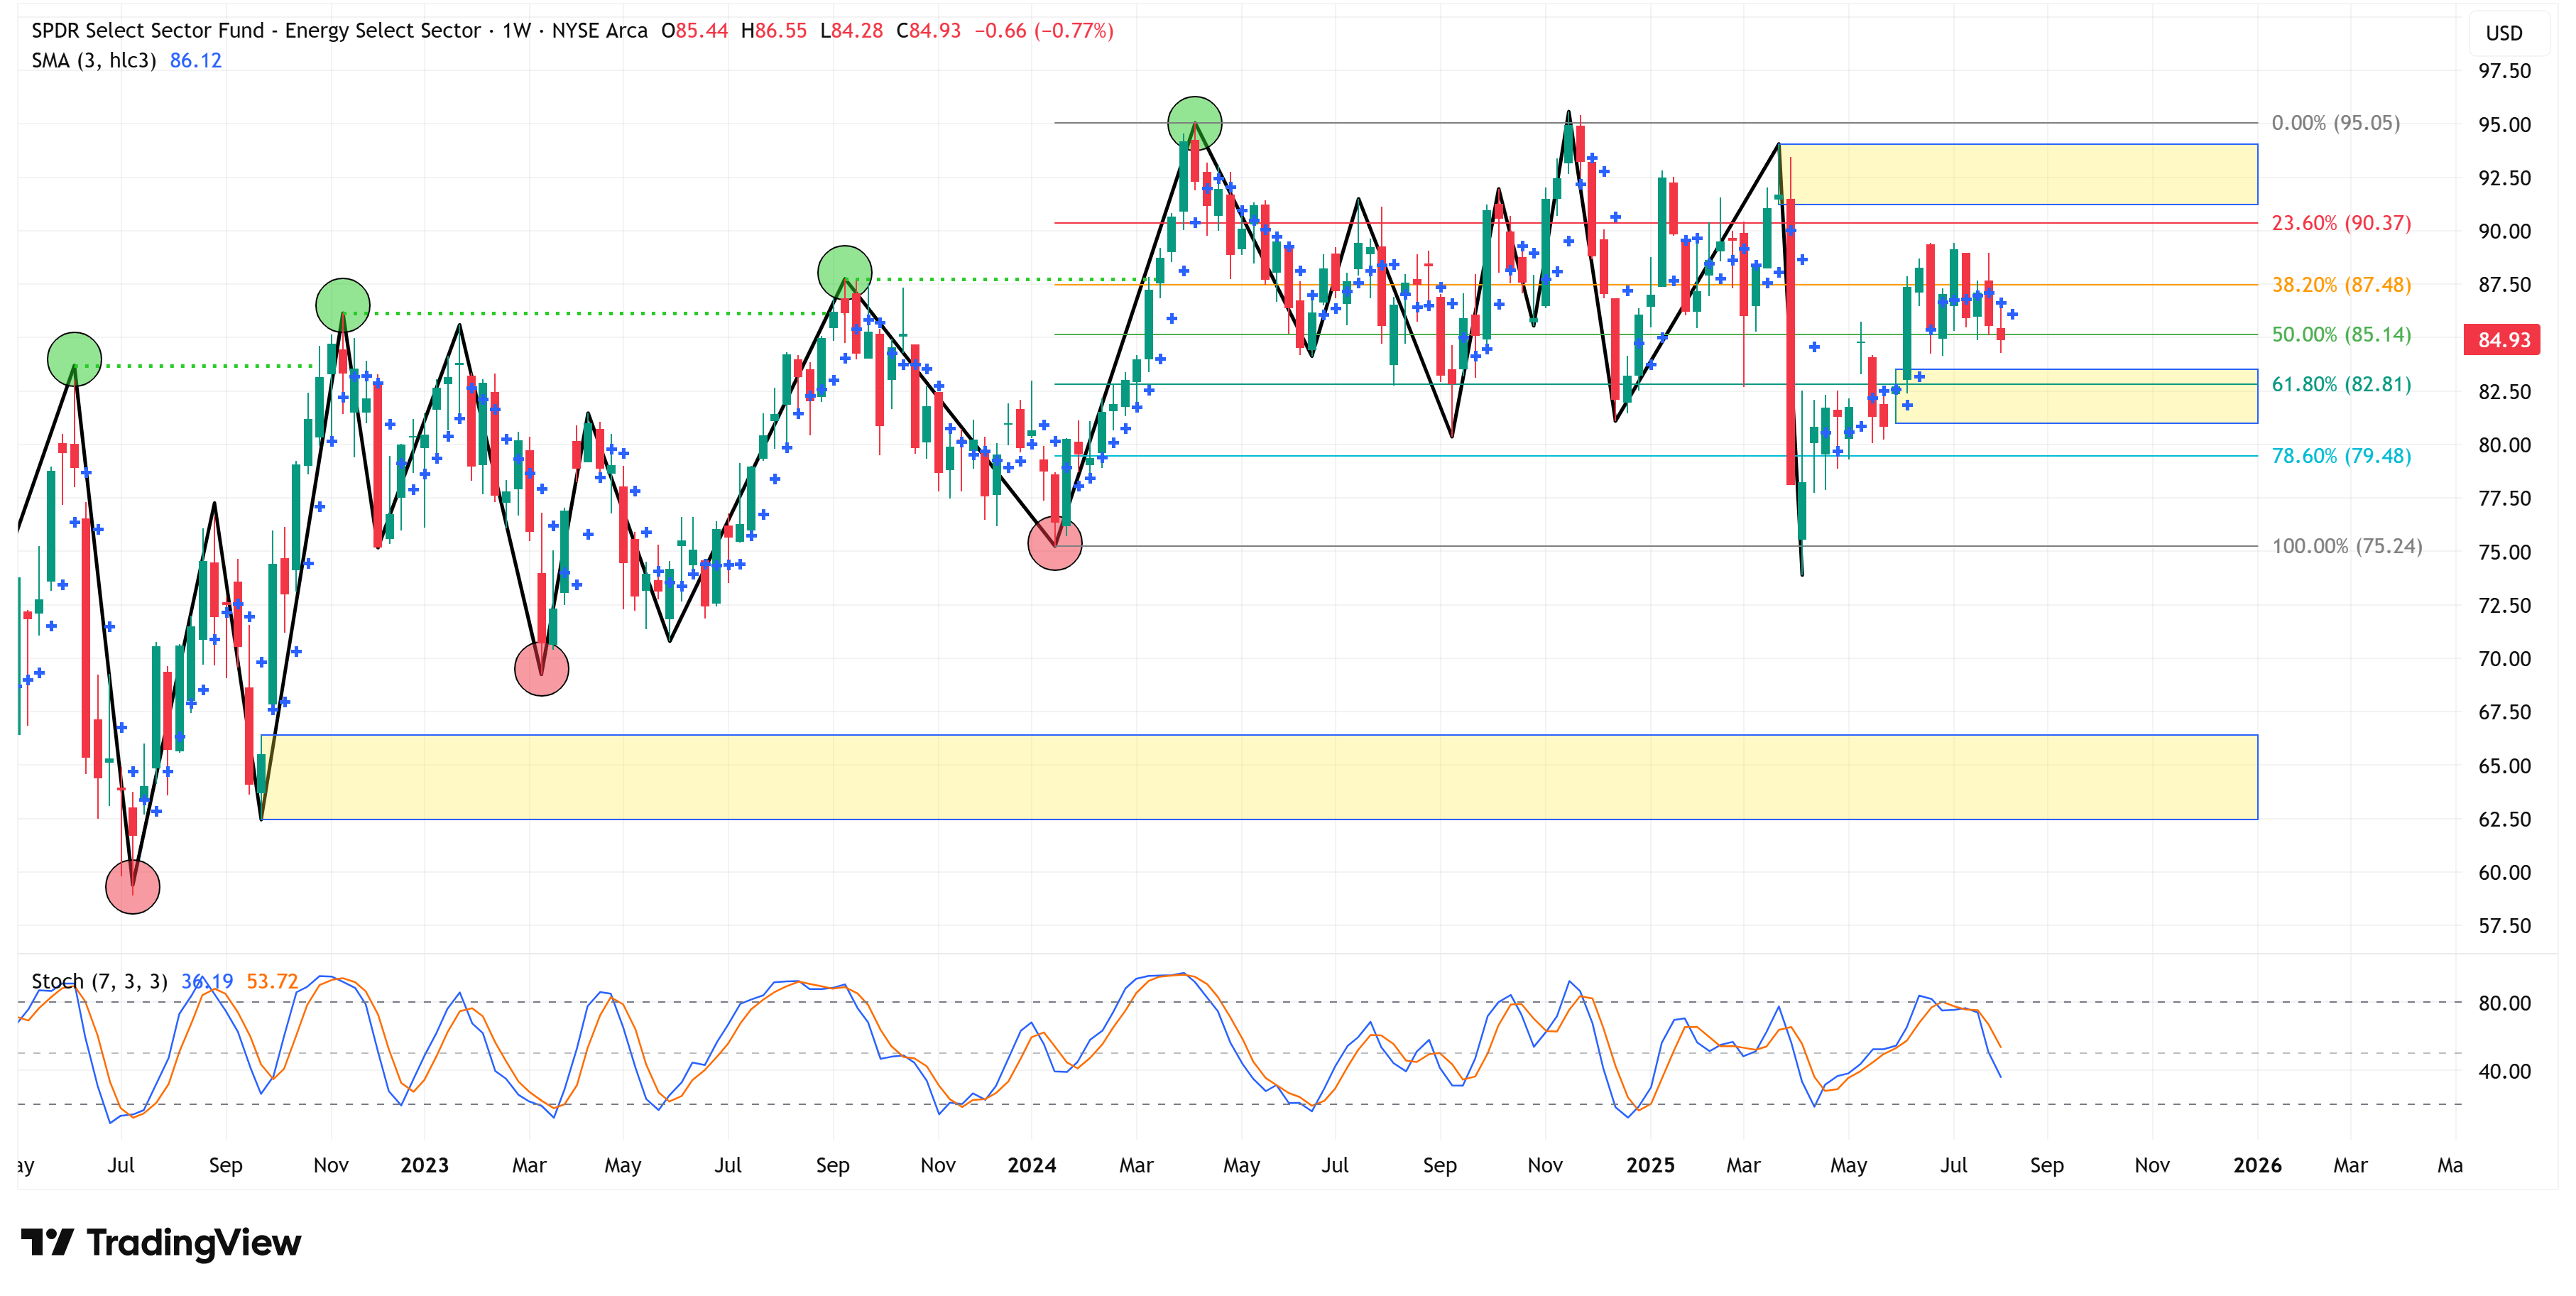
Energy
📈 Trend = ⬆️ / 🎯 Target = 95.05 / 🛑 Stop Loss = 75.24
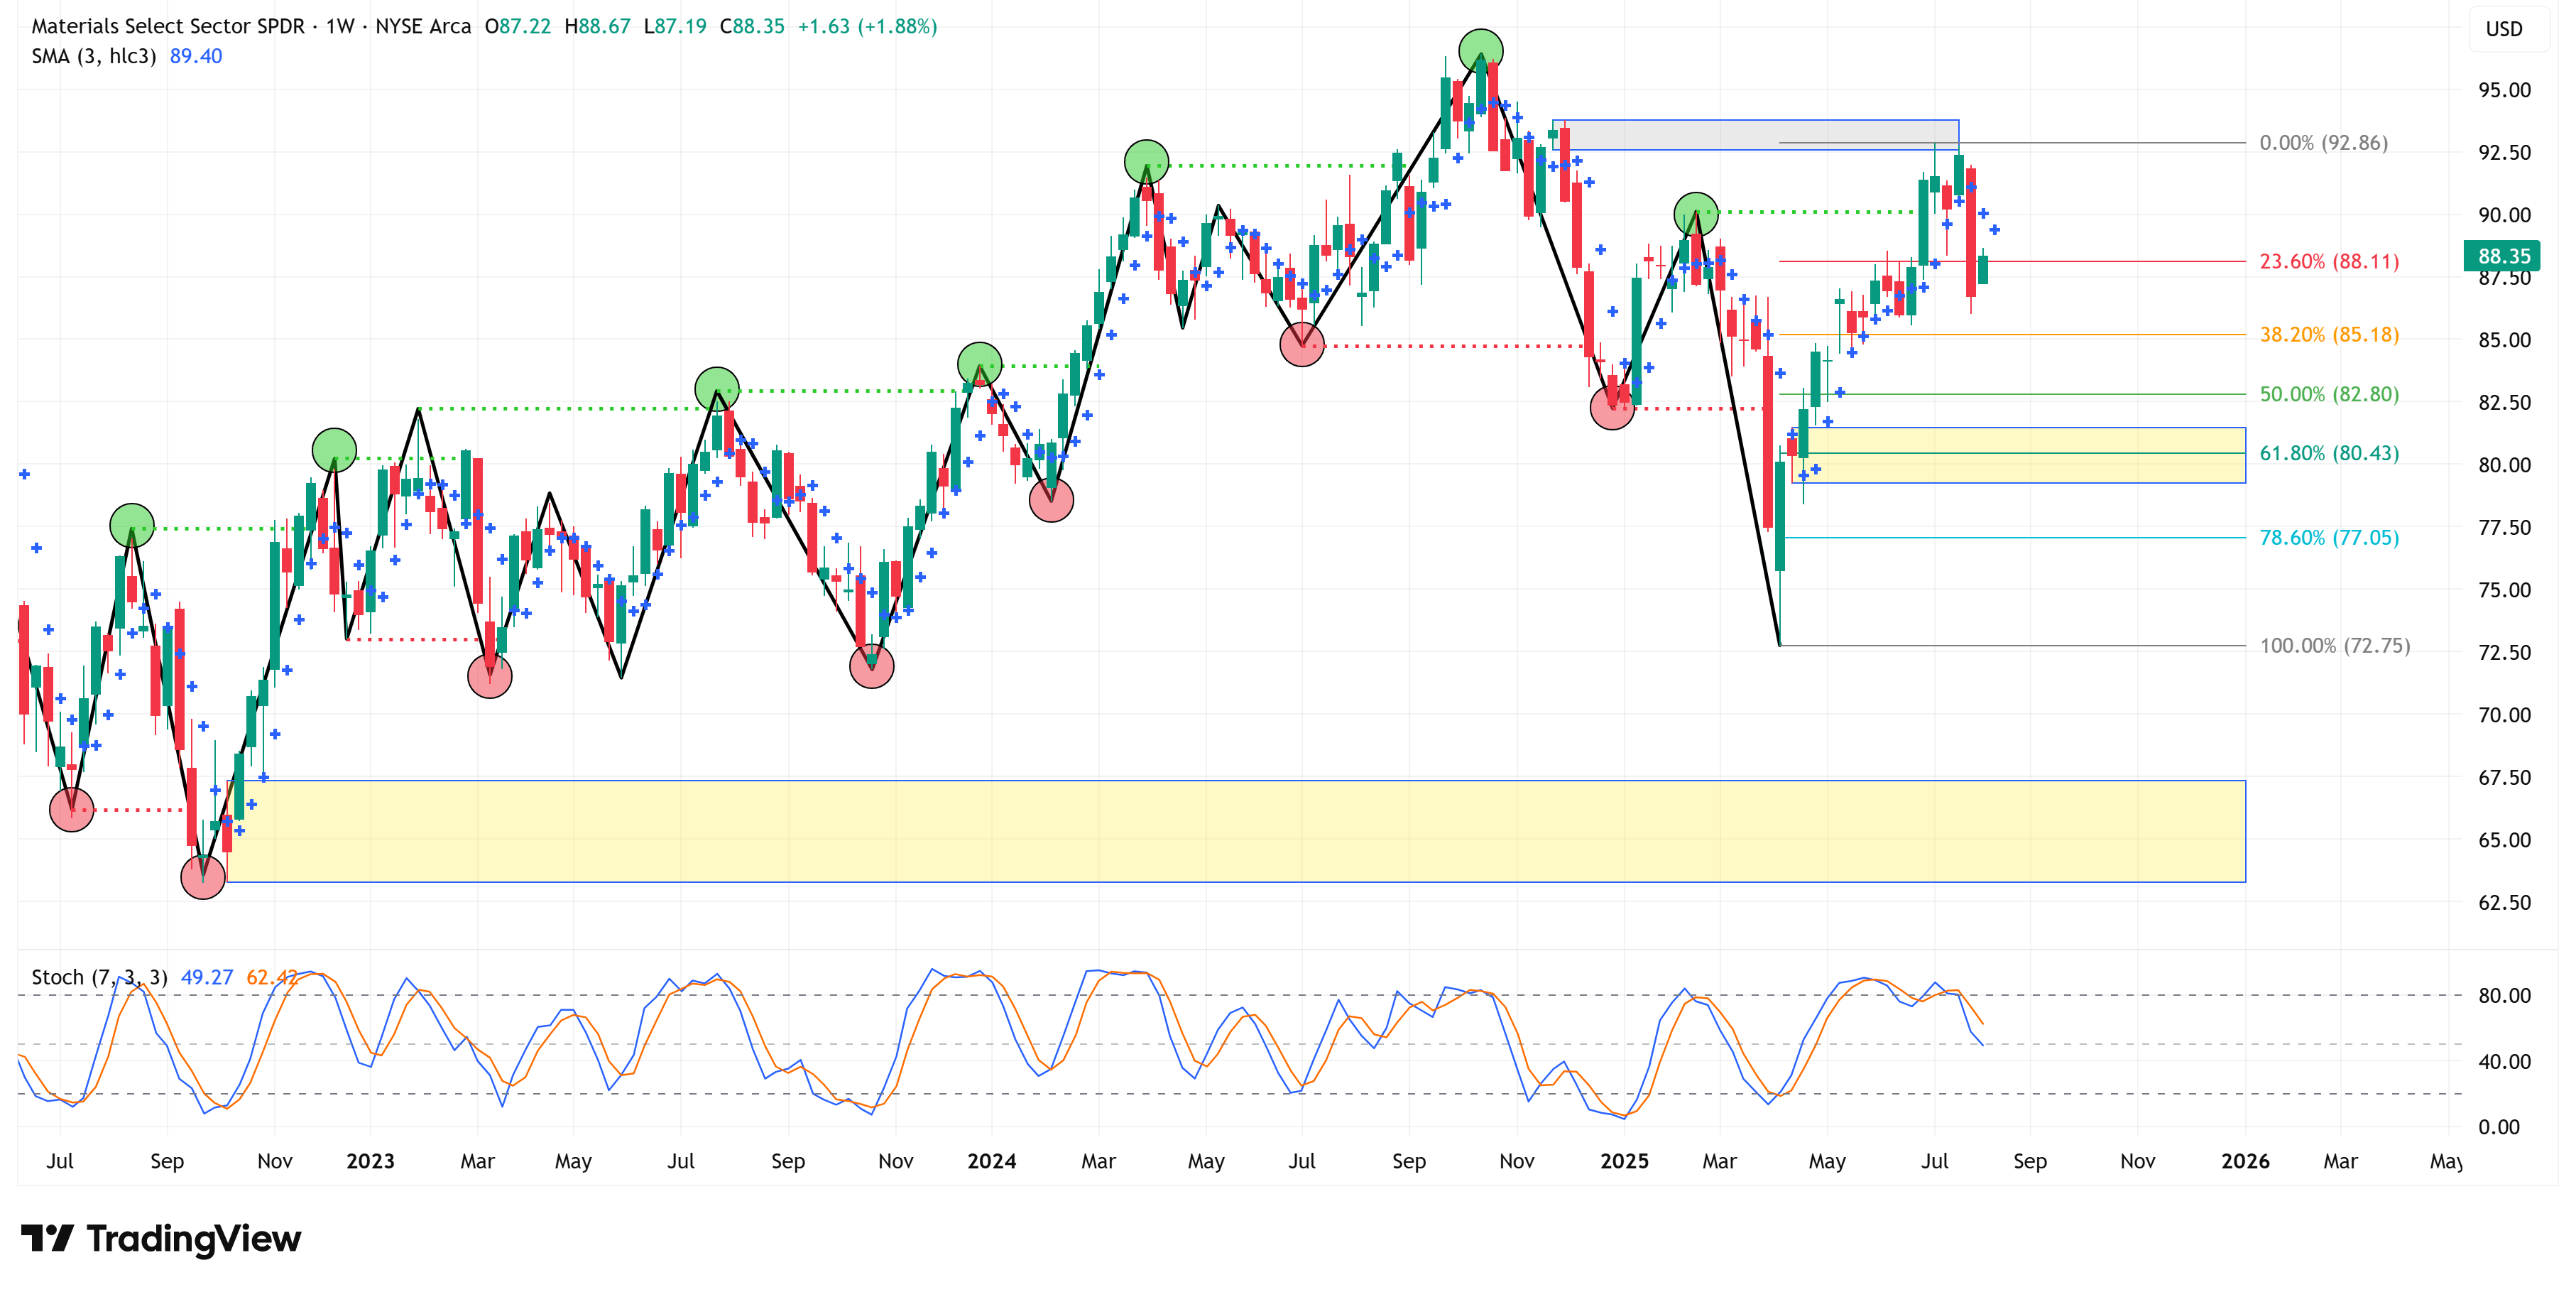
Materials
📈 Trend = ⬆️ / 🎯 Target = 92.86 / 🛑 Stop Loss = 72.75
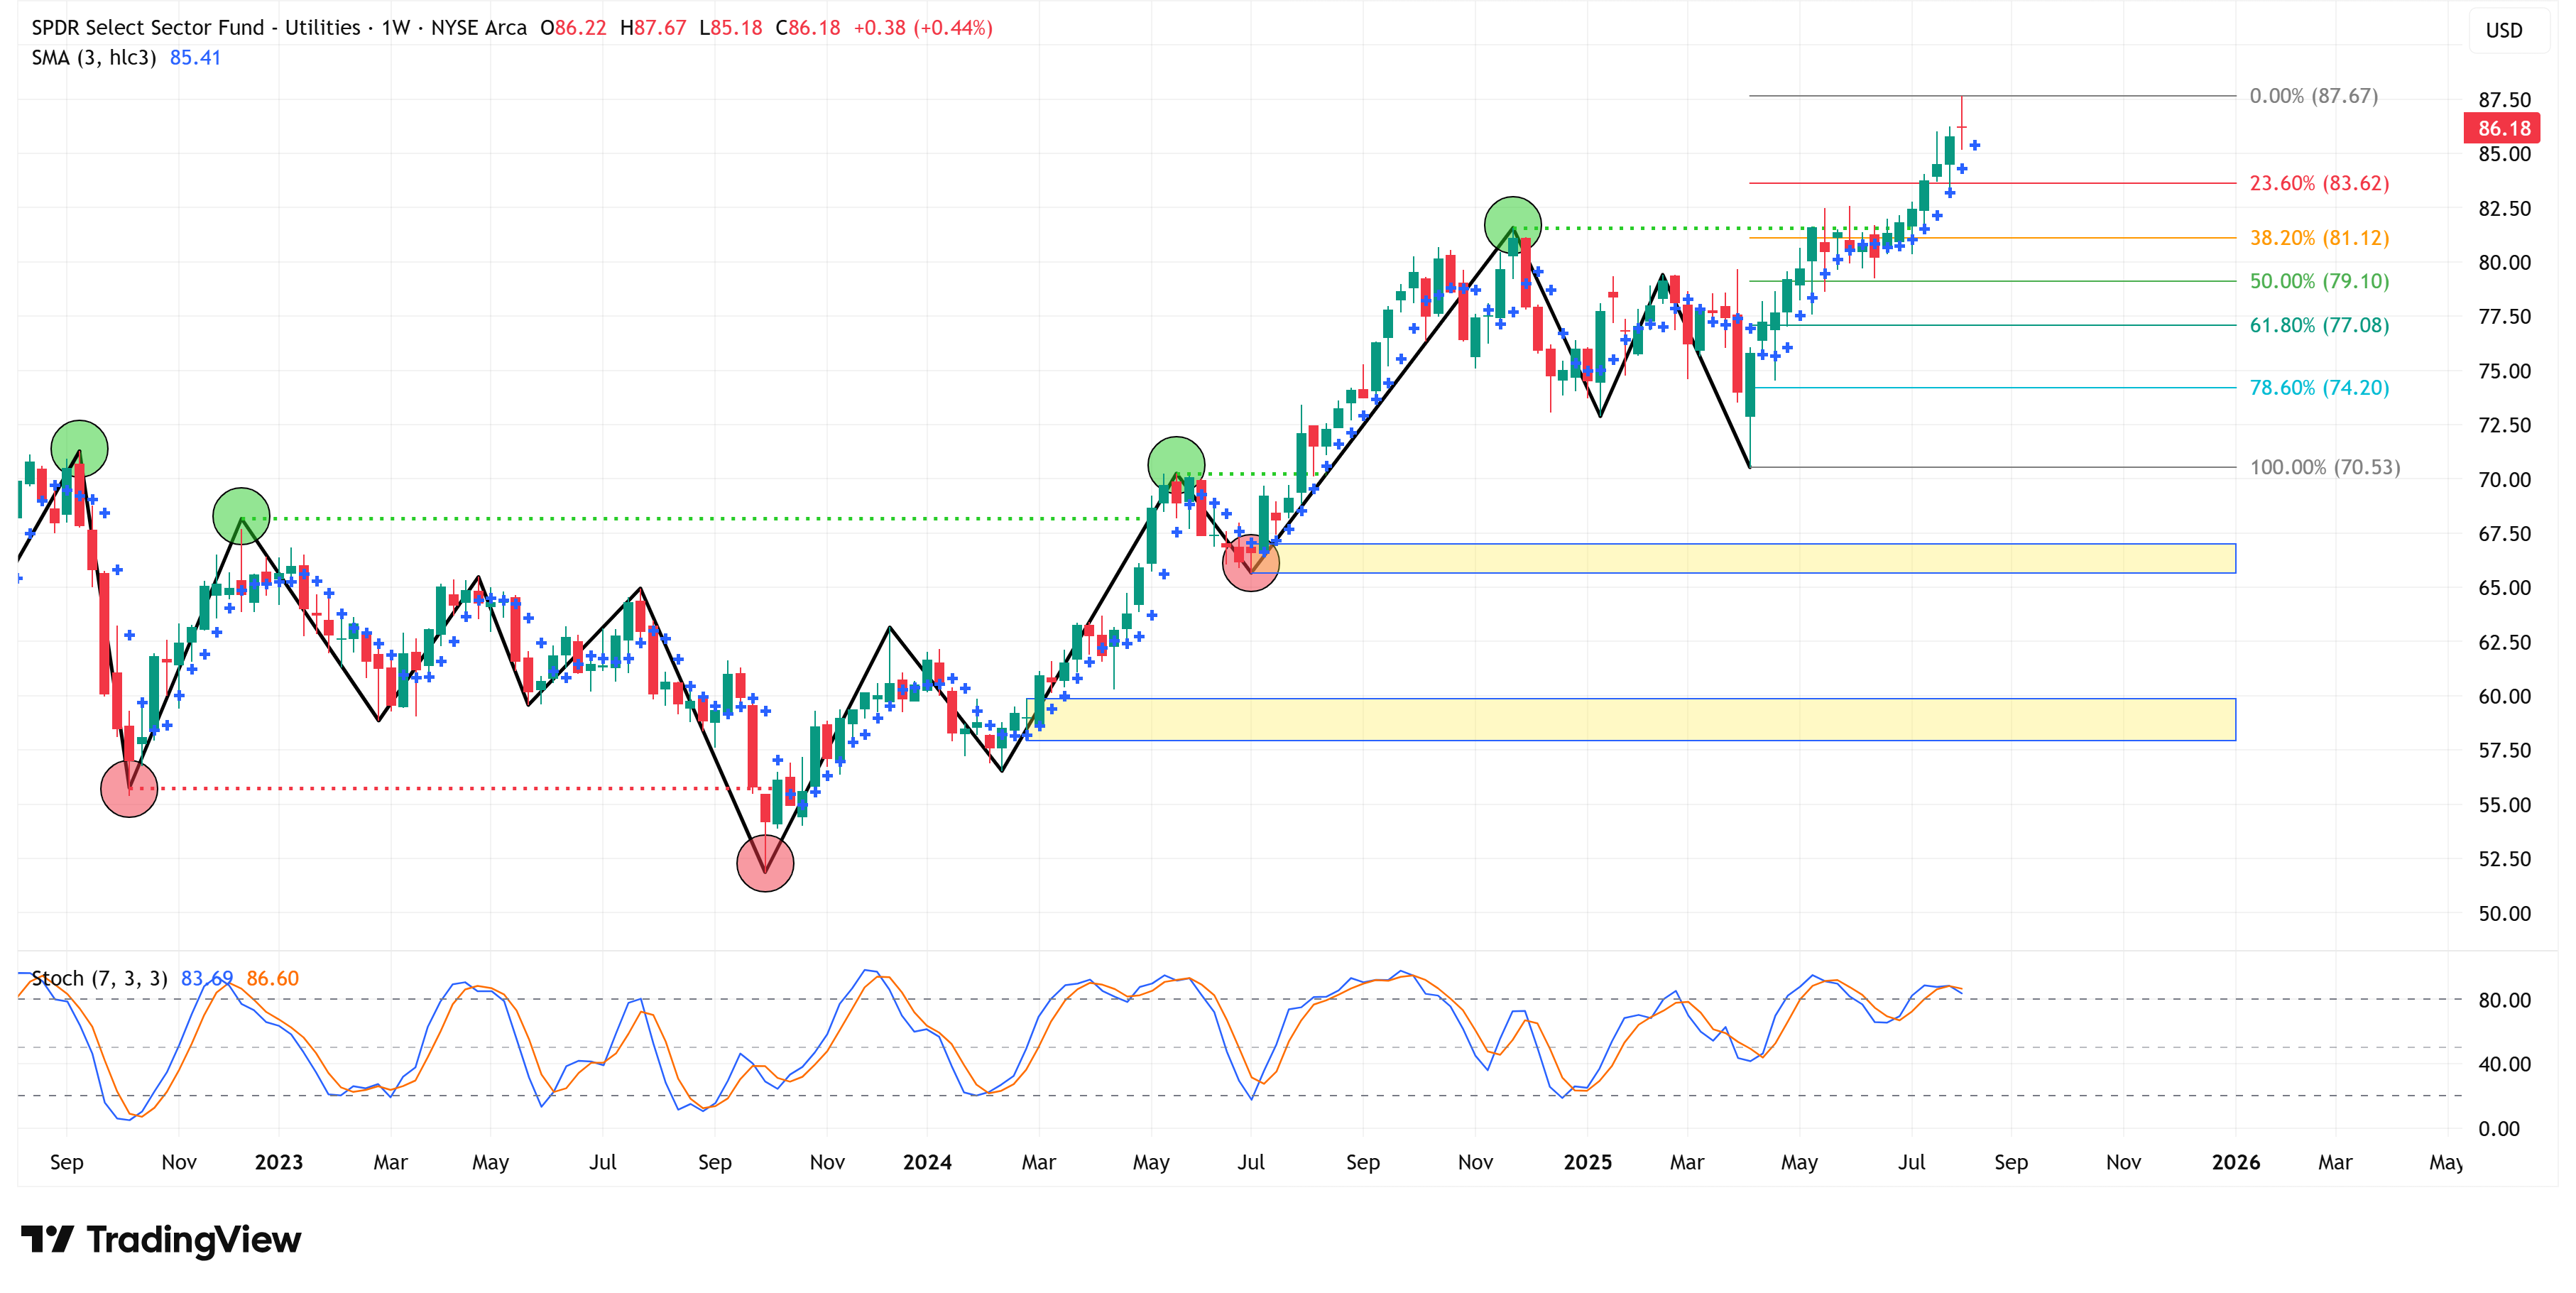
Utilities
📈 Trend = ⬆️ / 🎯 Target = 87.67 / 🛑 Stop Loss = 70.53
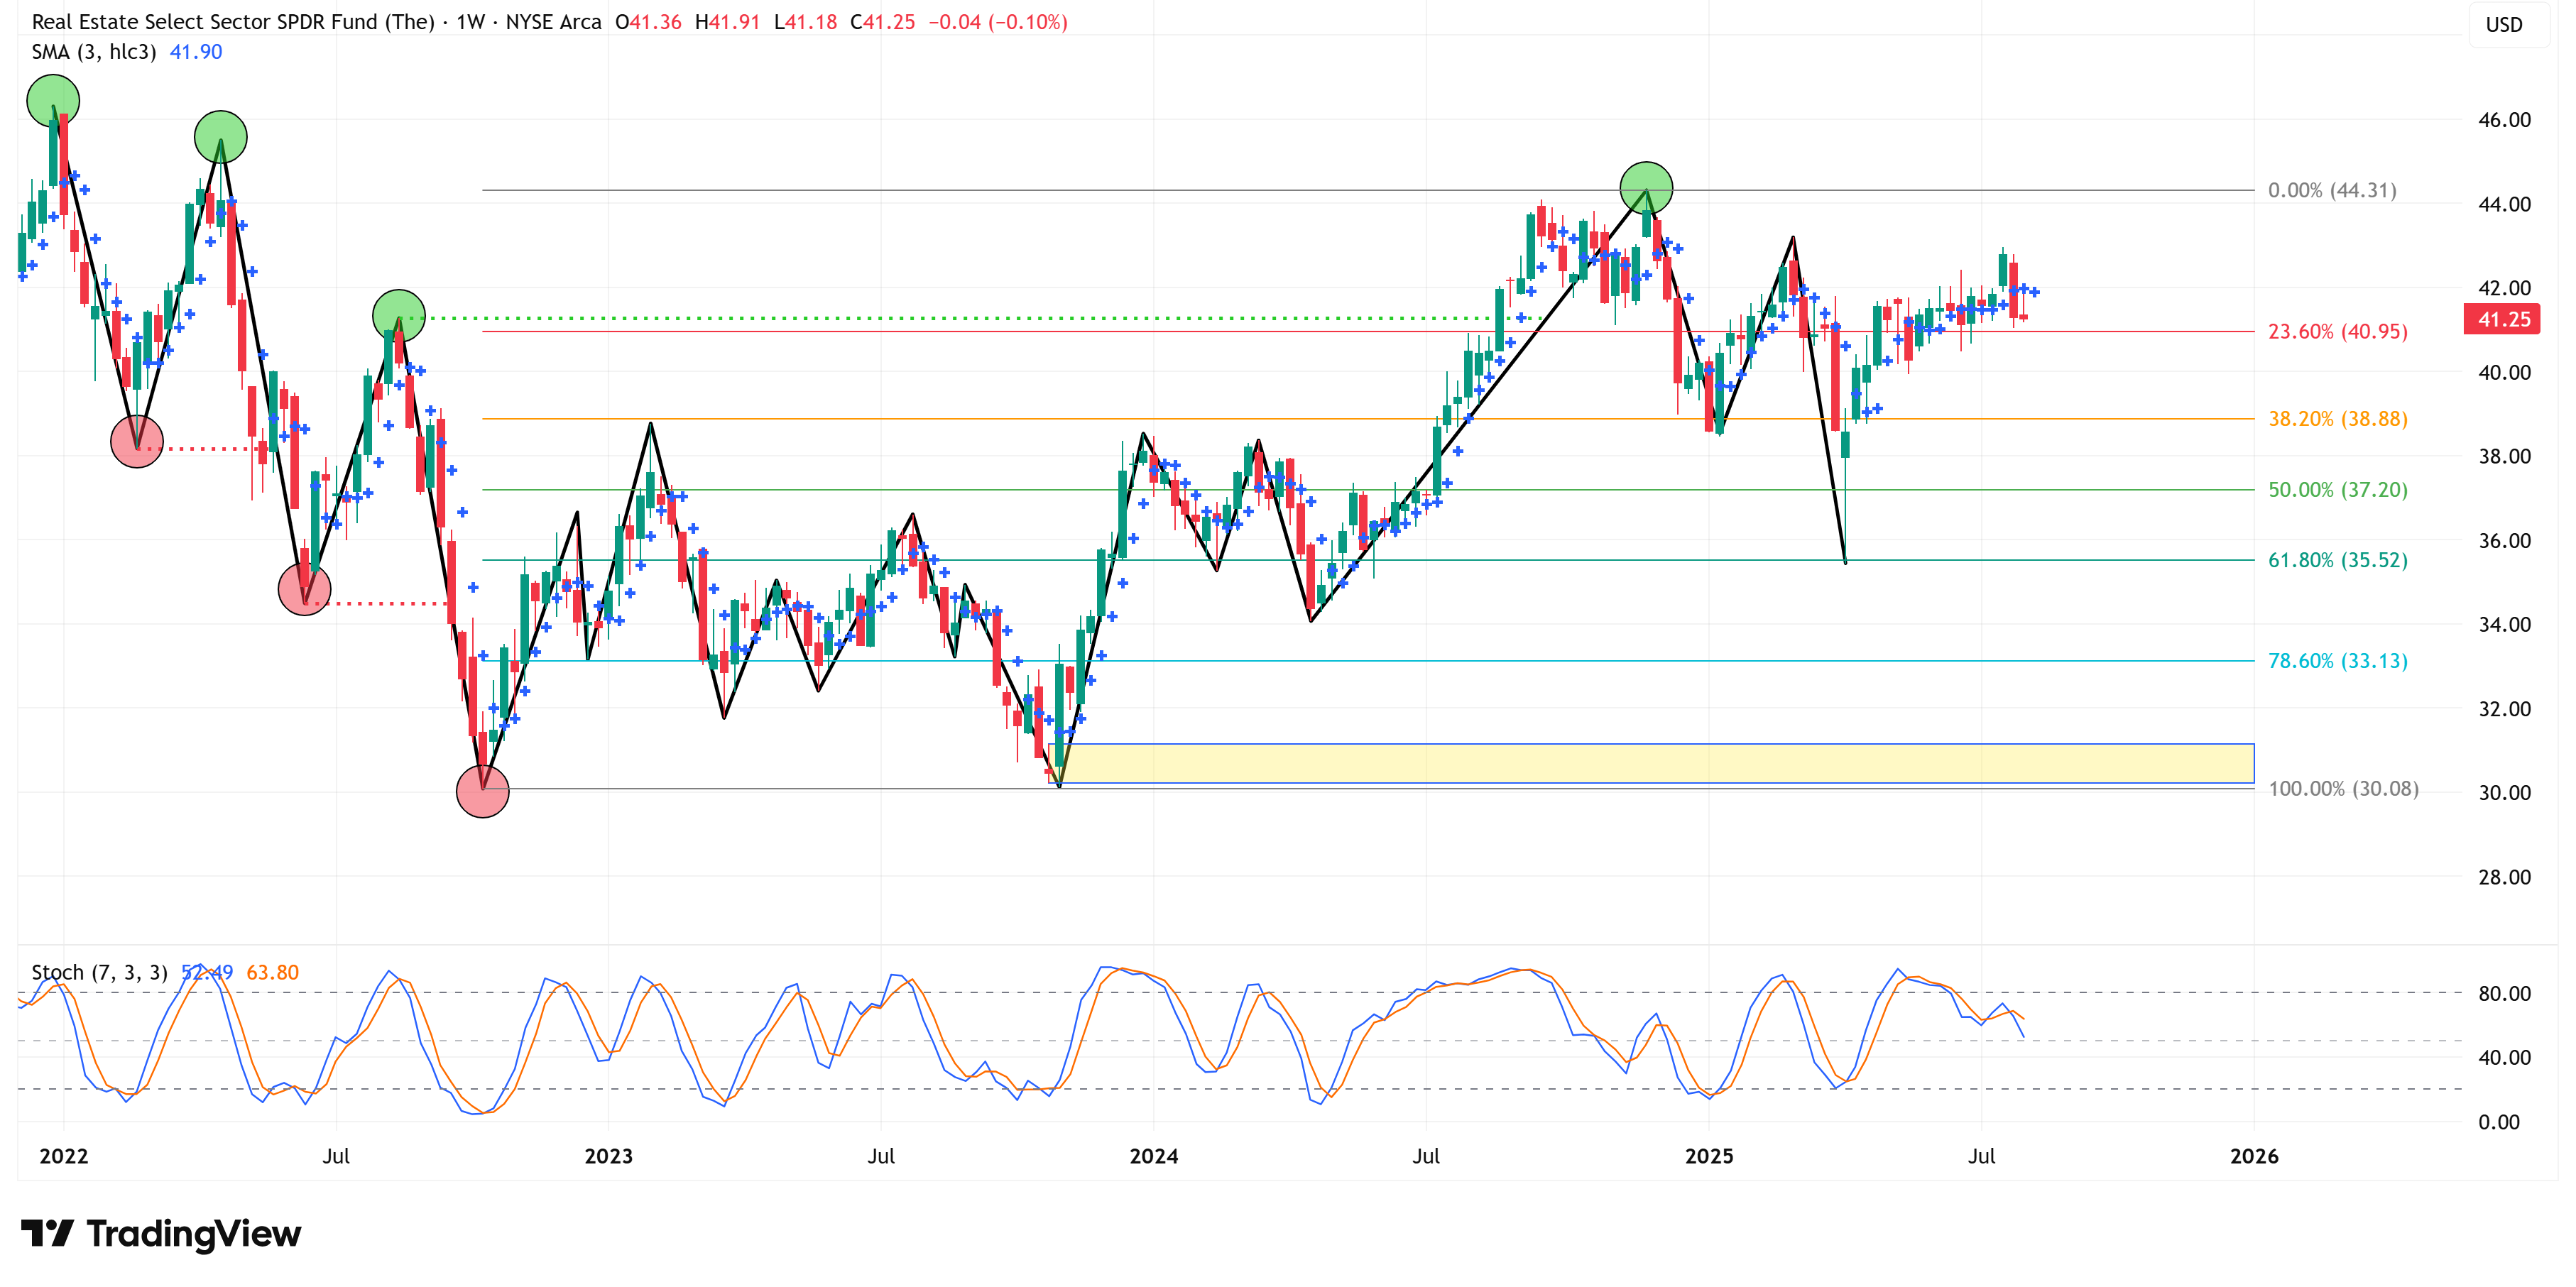
Real Estate
📈 Trend = ⬆️ / 🎯 Target = 44.31 / 🛑 Stop Loss = 30.08
US Treasuries:
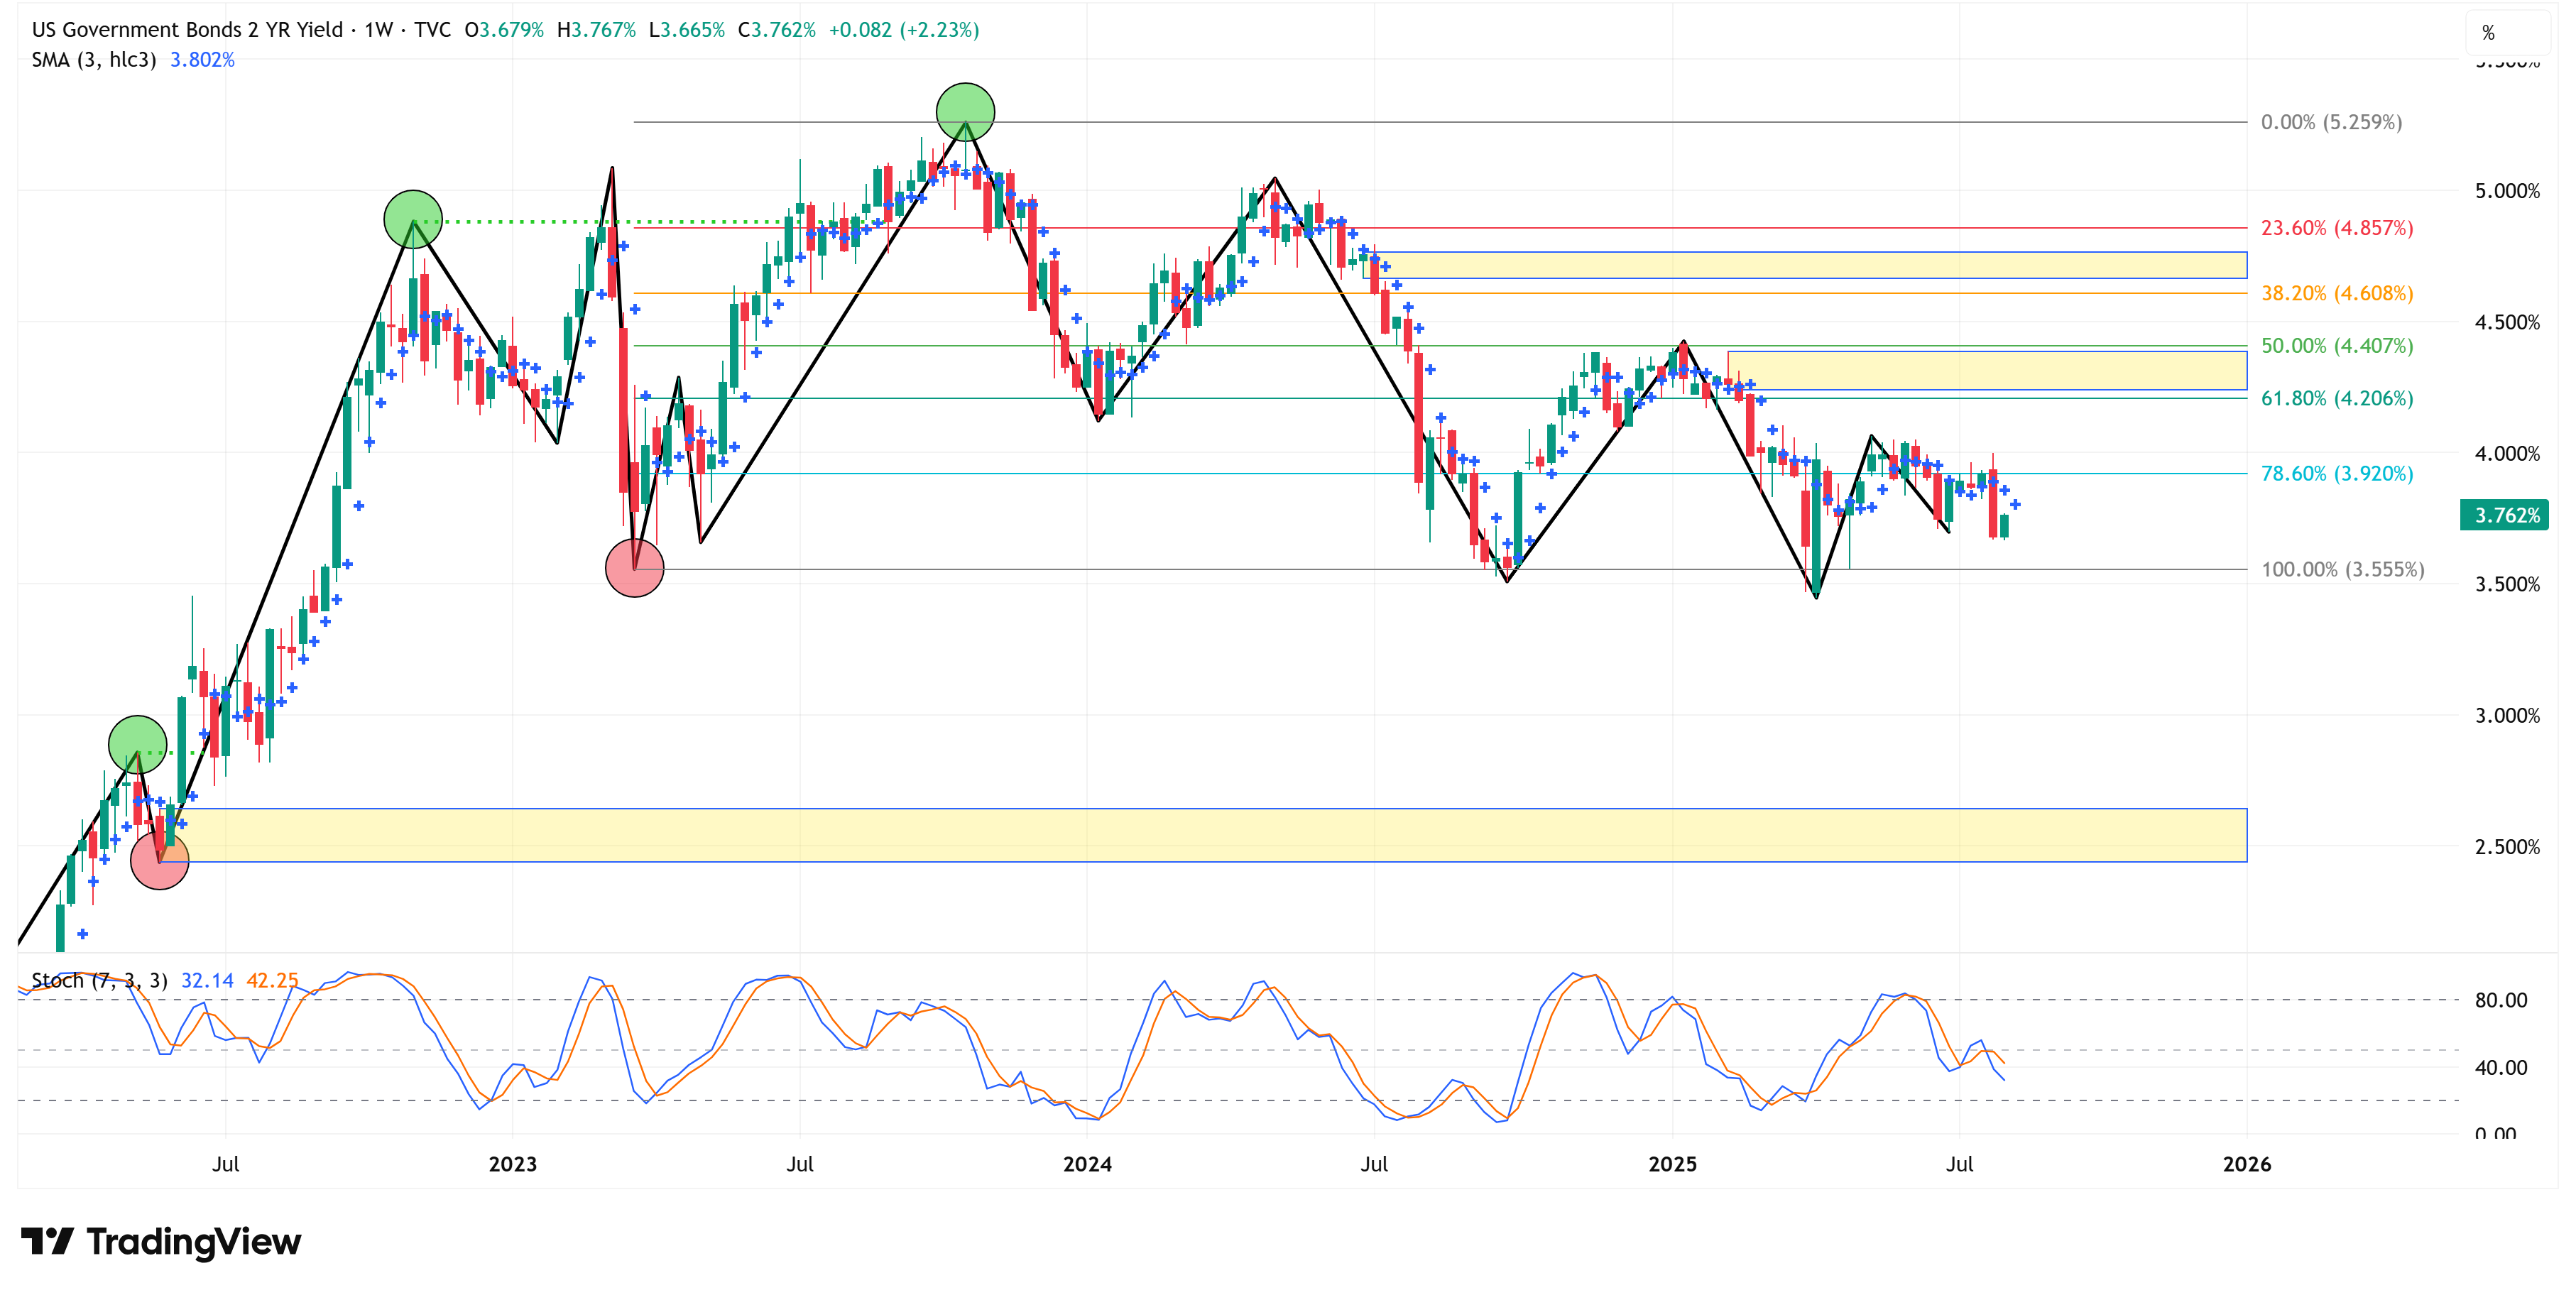
UST 2Y Yield
📈 Trend = ⬆️ / 🎯 Target = 5.259% / 🛑 Stop Loss = 3.555%
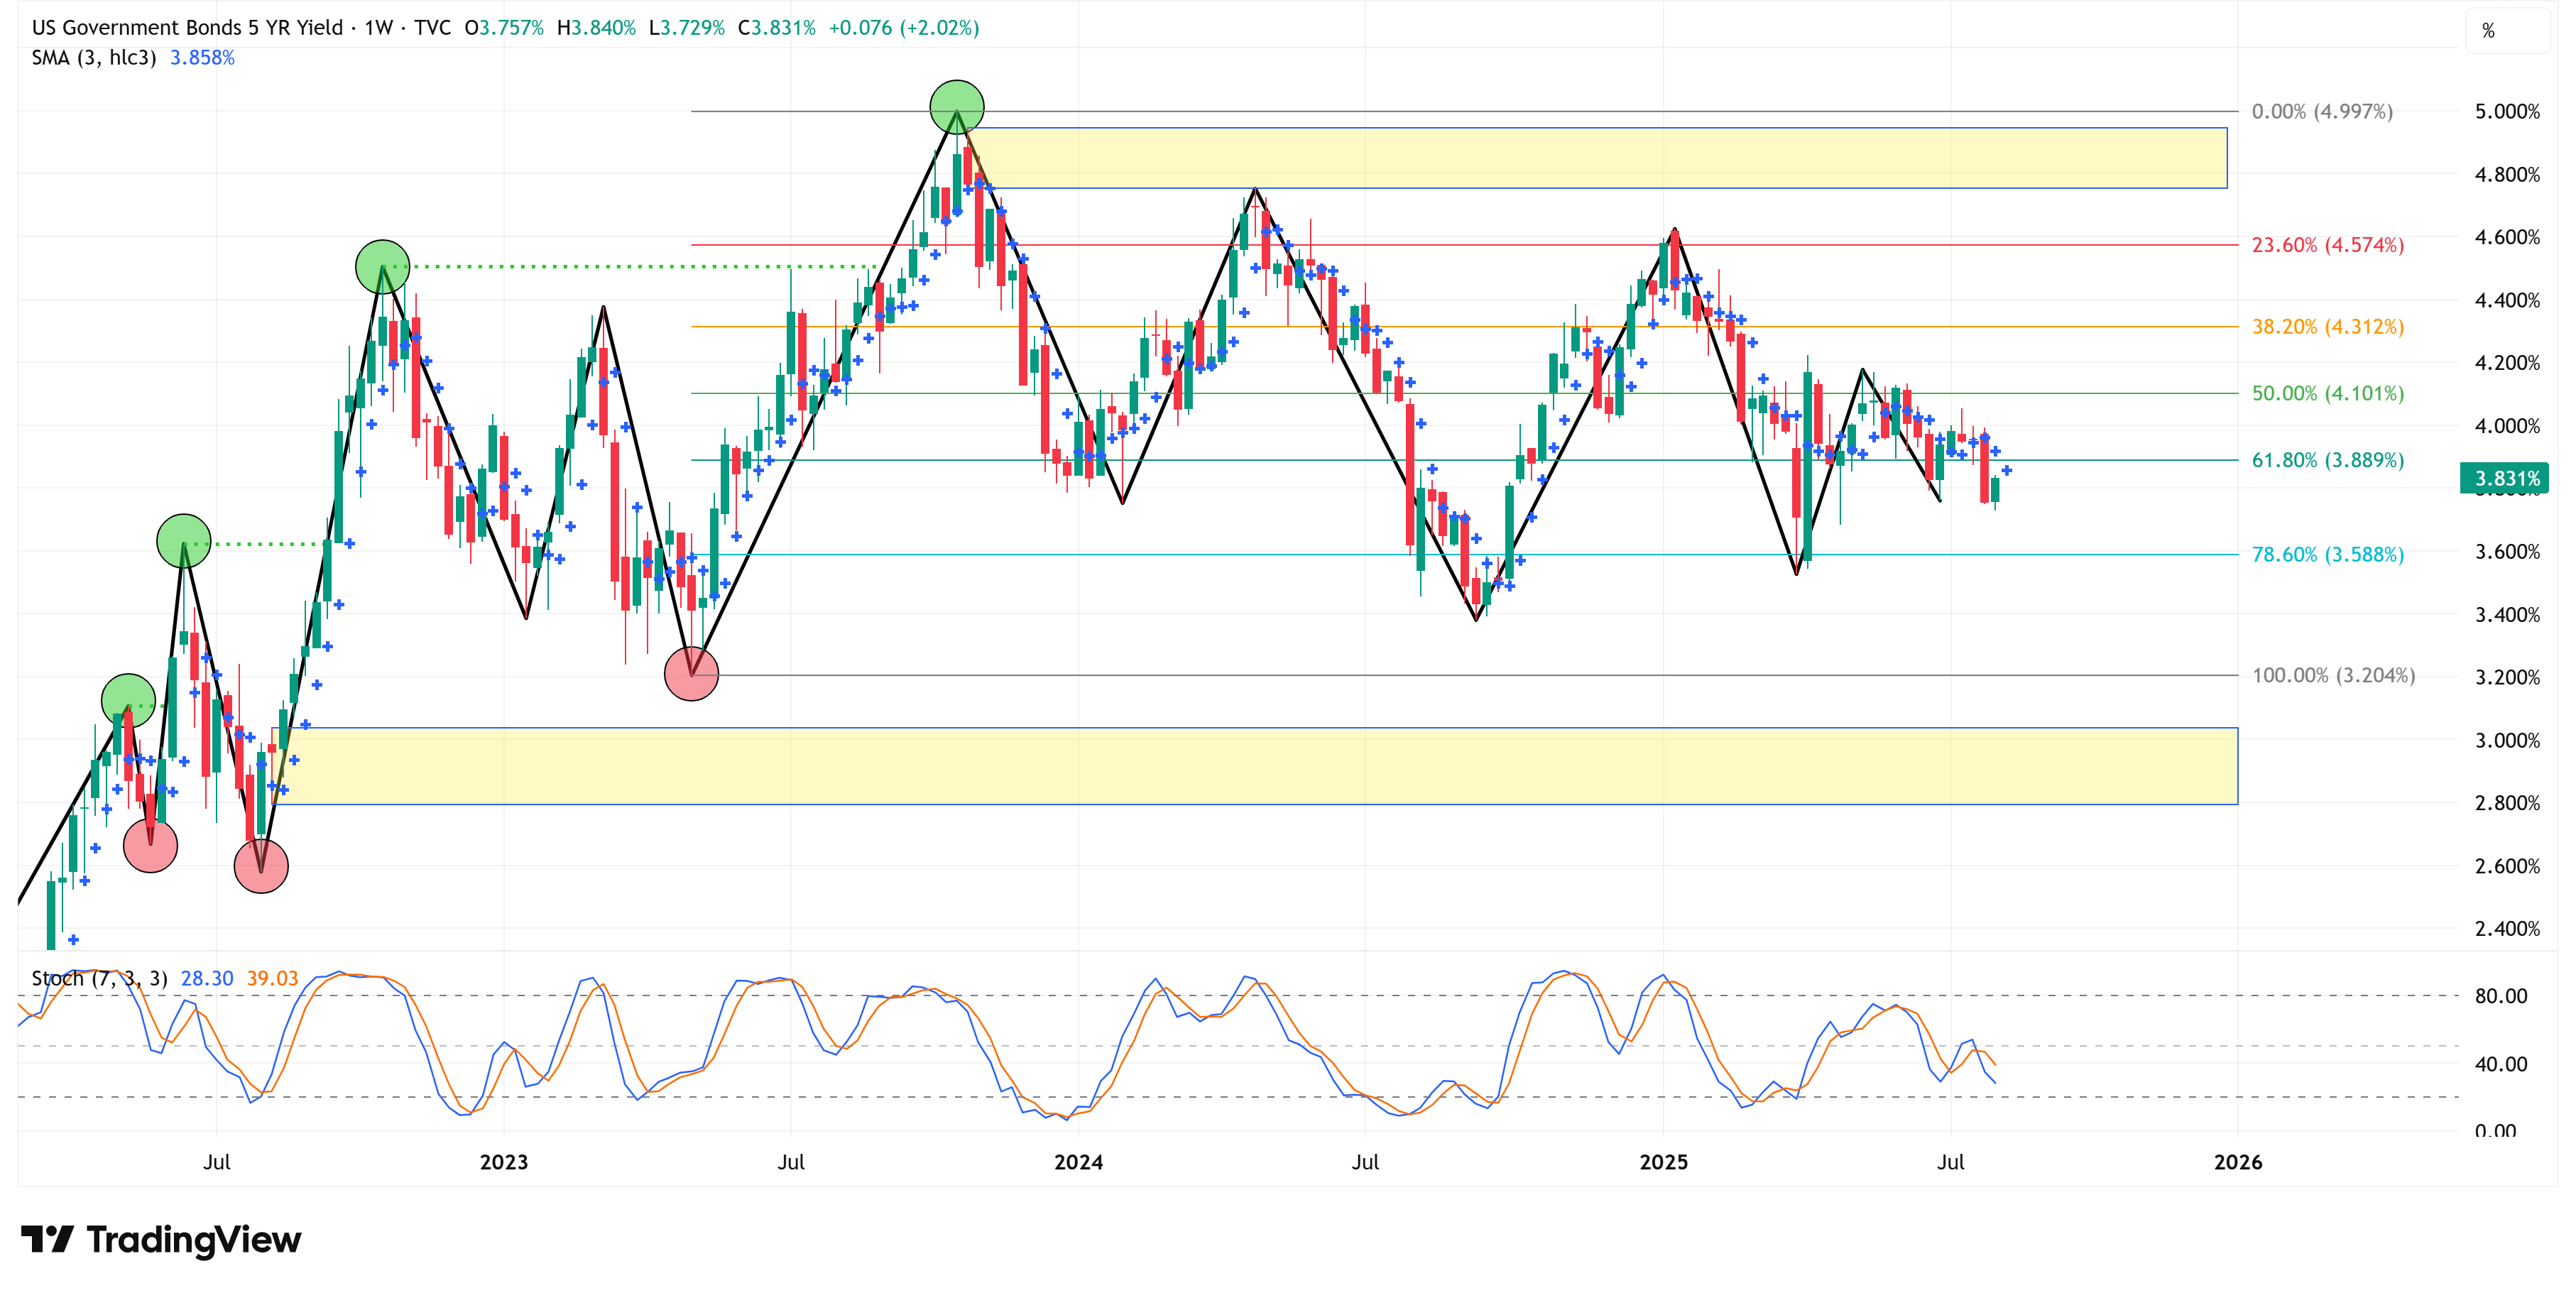
UST 5Y Yield
📈 Trend = ⬆️ / 🎯 Target = 4.997% / 🛑 Stop Loss = 3.204%
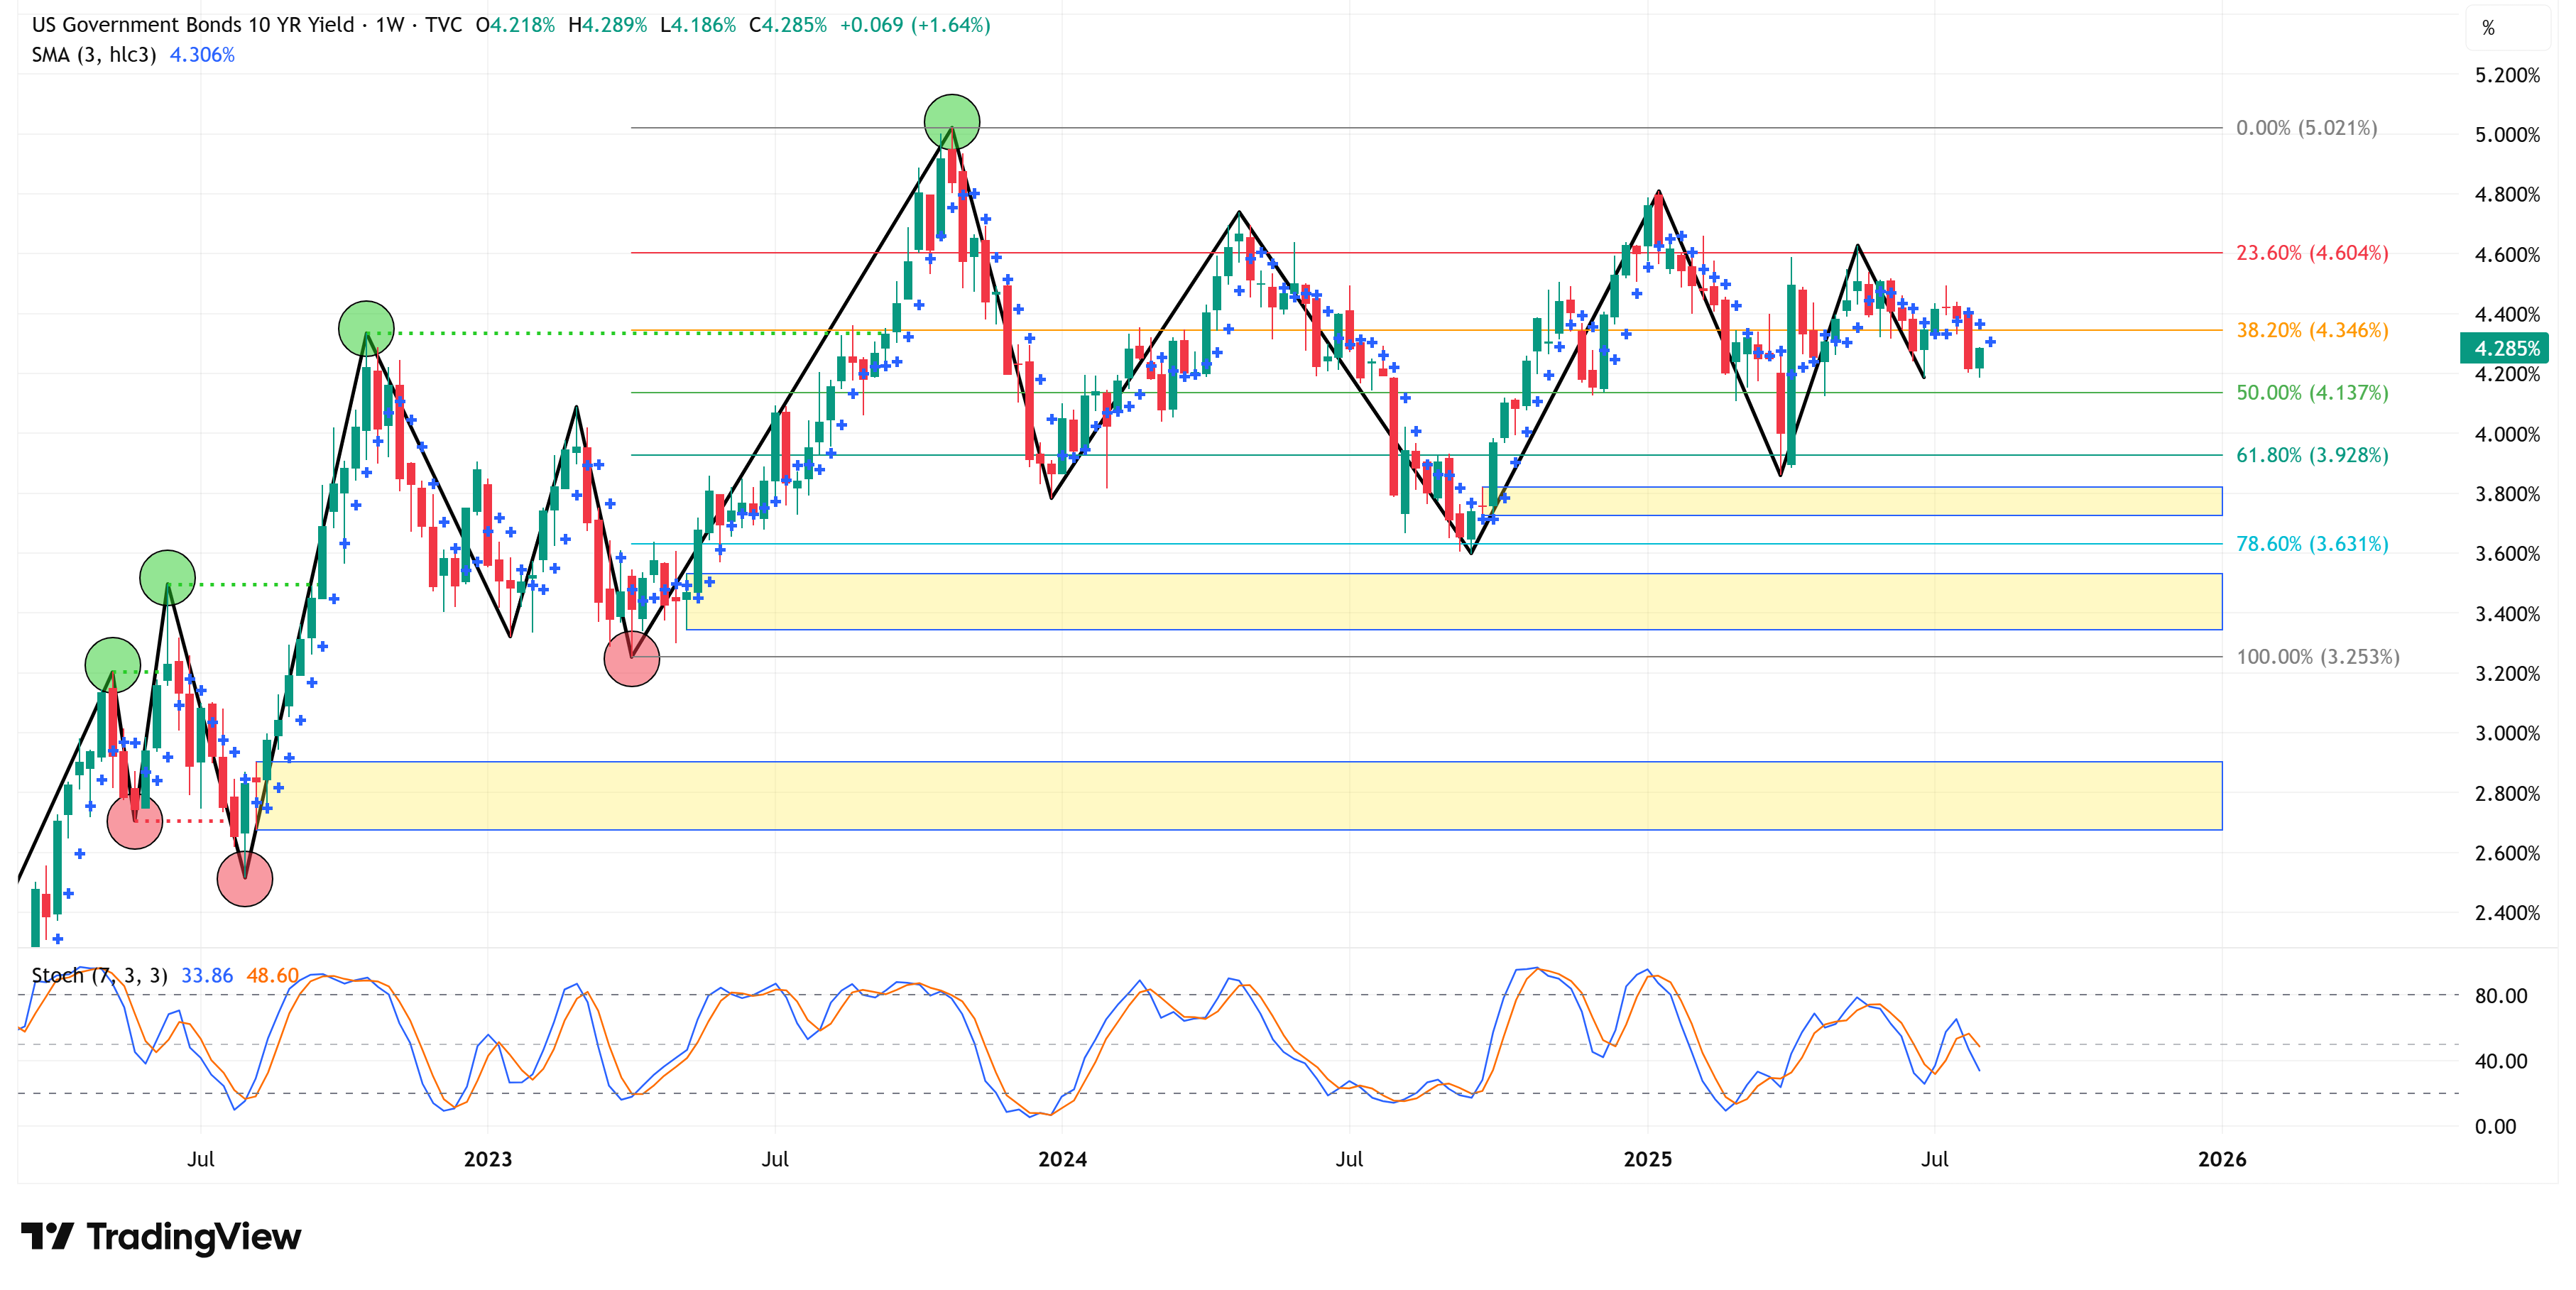
UST 10Y Yield
📈 Trend = ⬆️ / 🎯 Target = 5.021% / 🛑 Stop Loss = 3.253%
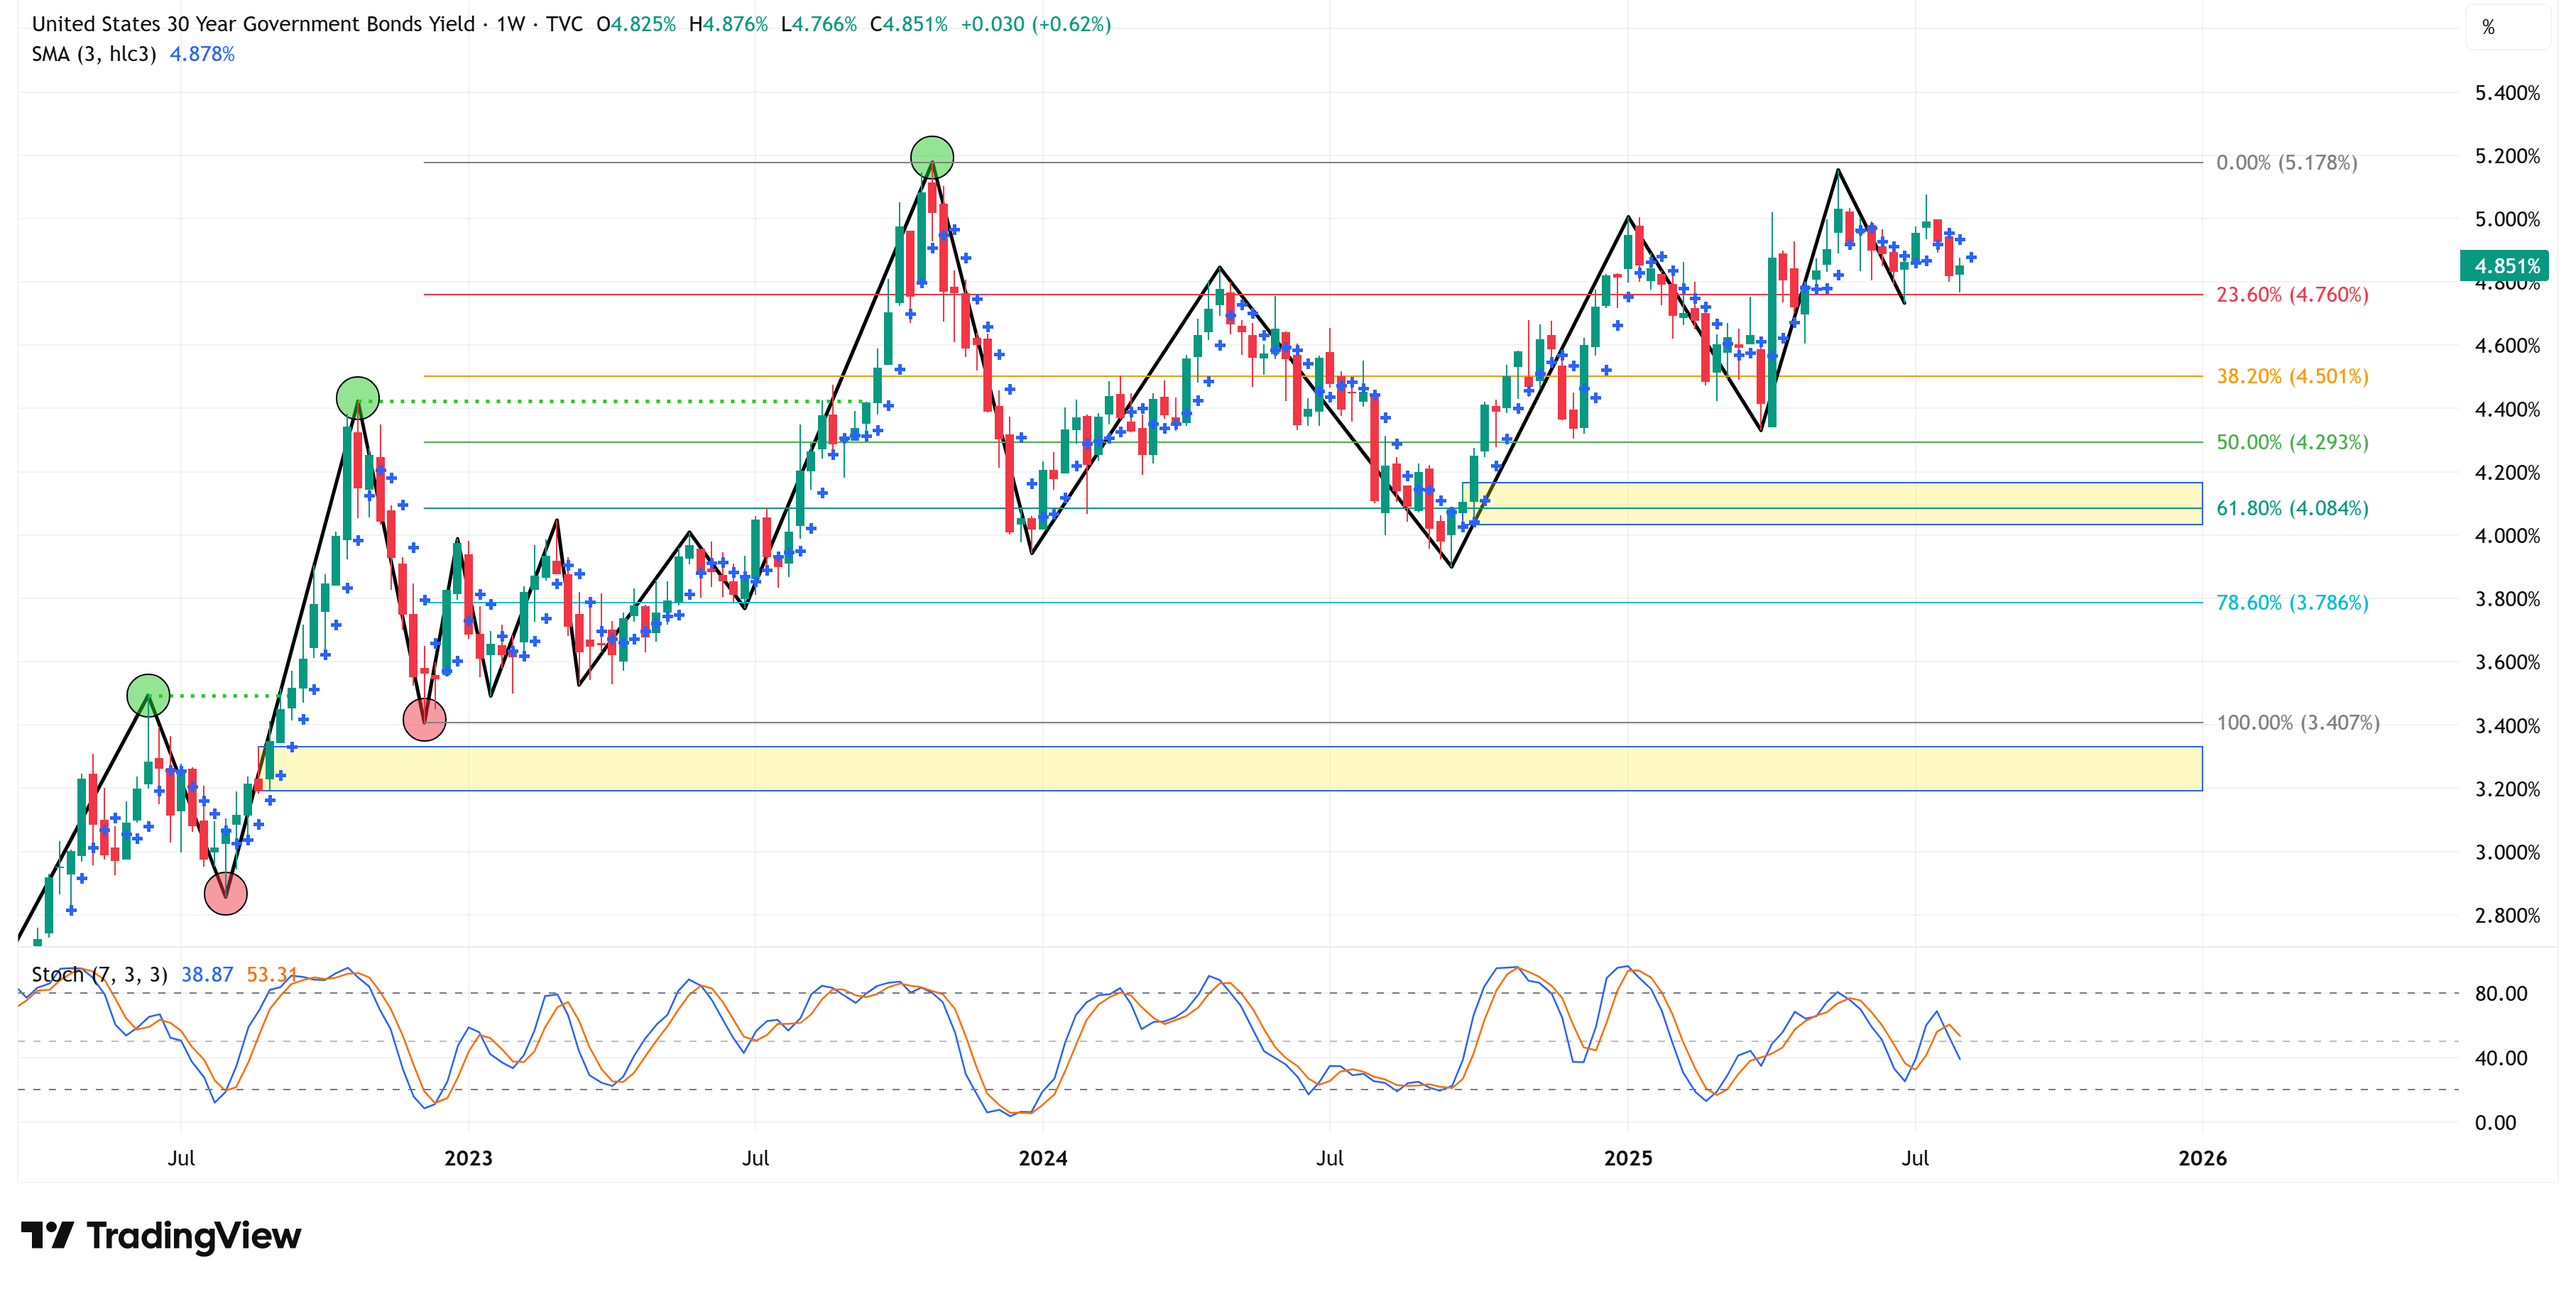
UST 30Y Yield
📈 Trend = ⬆️ / 🎯 Target = 5.178% / 🛑 Stop Loss = 3.407%
Currencies:
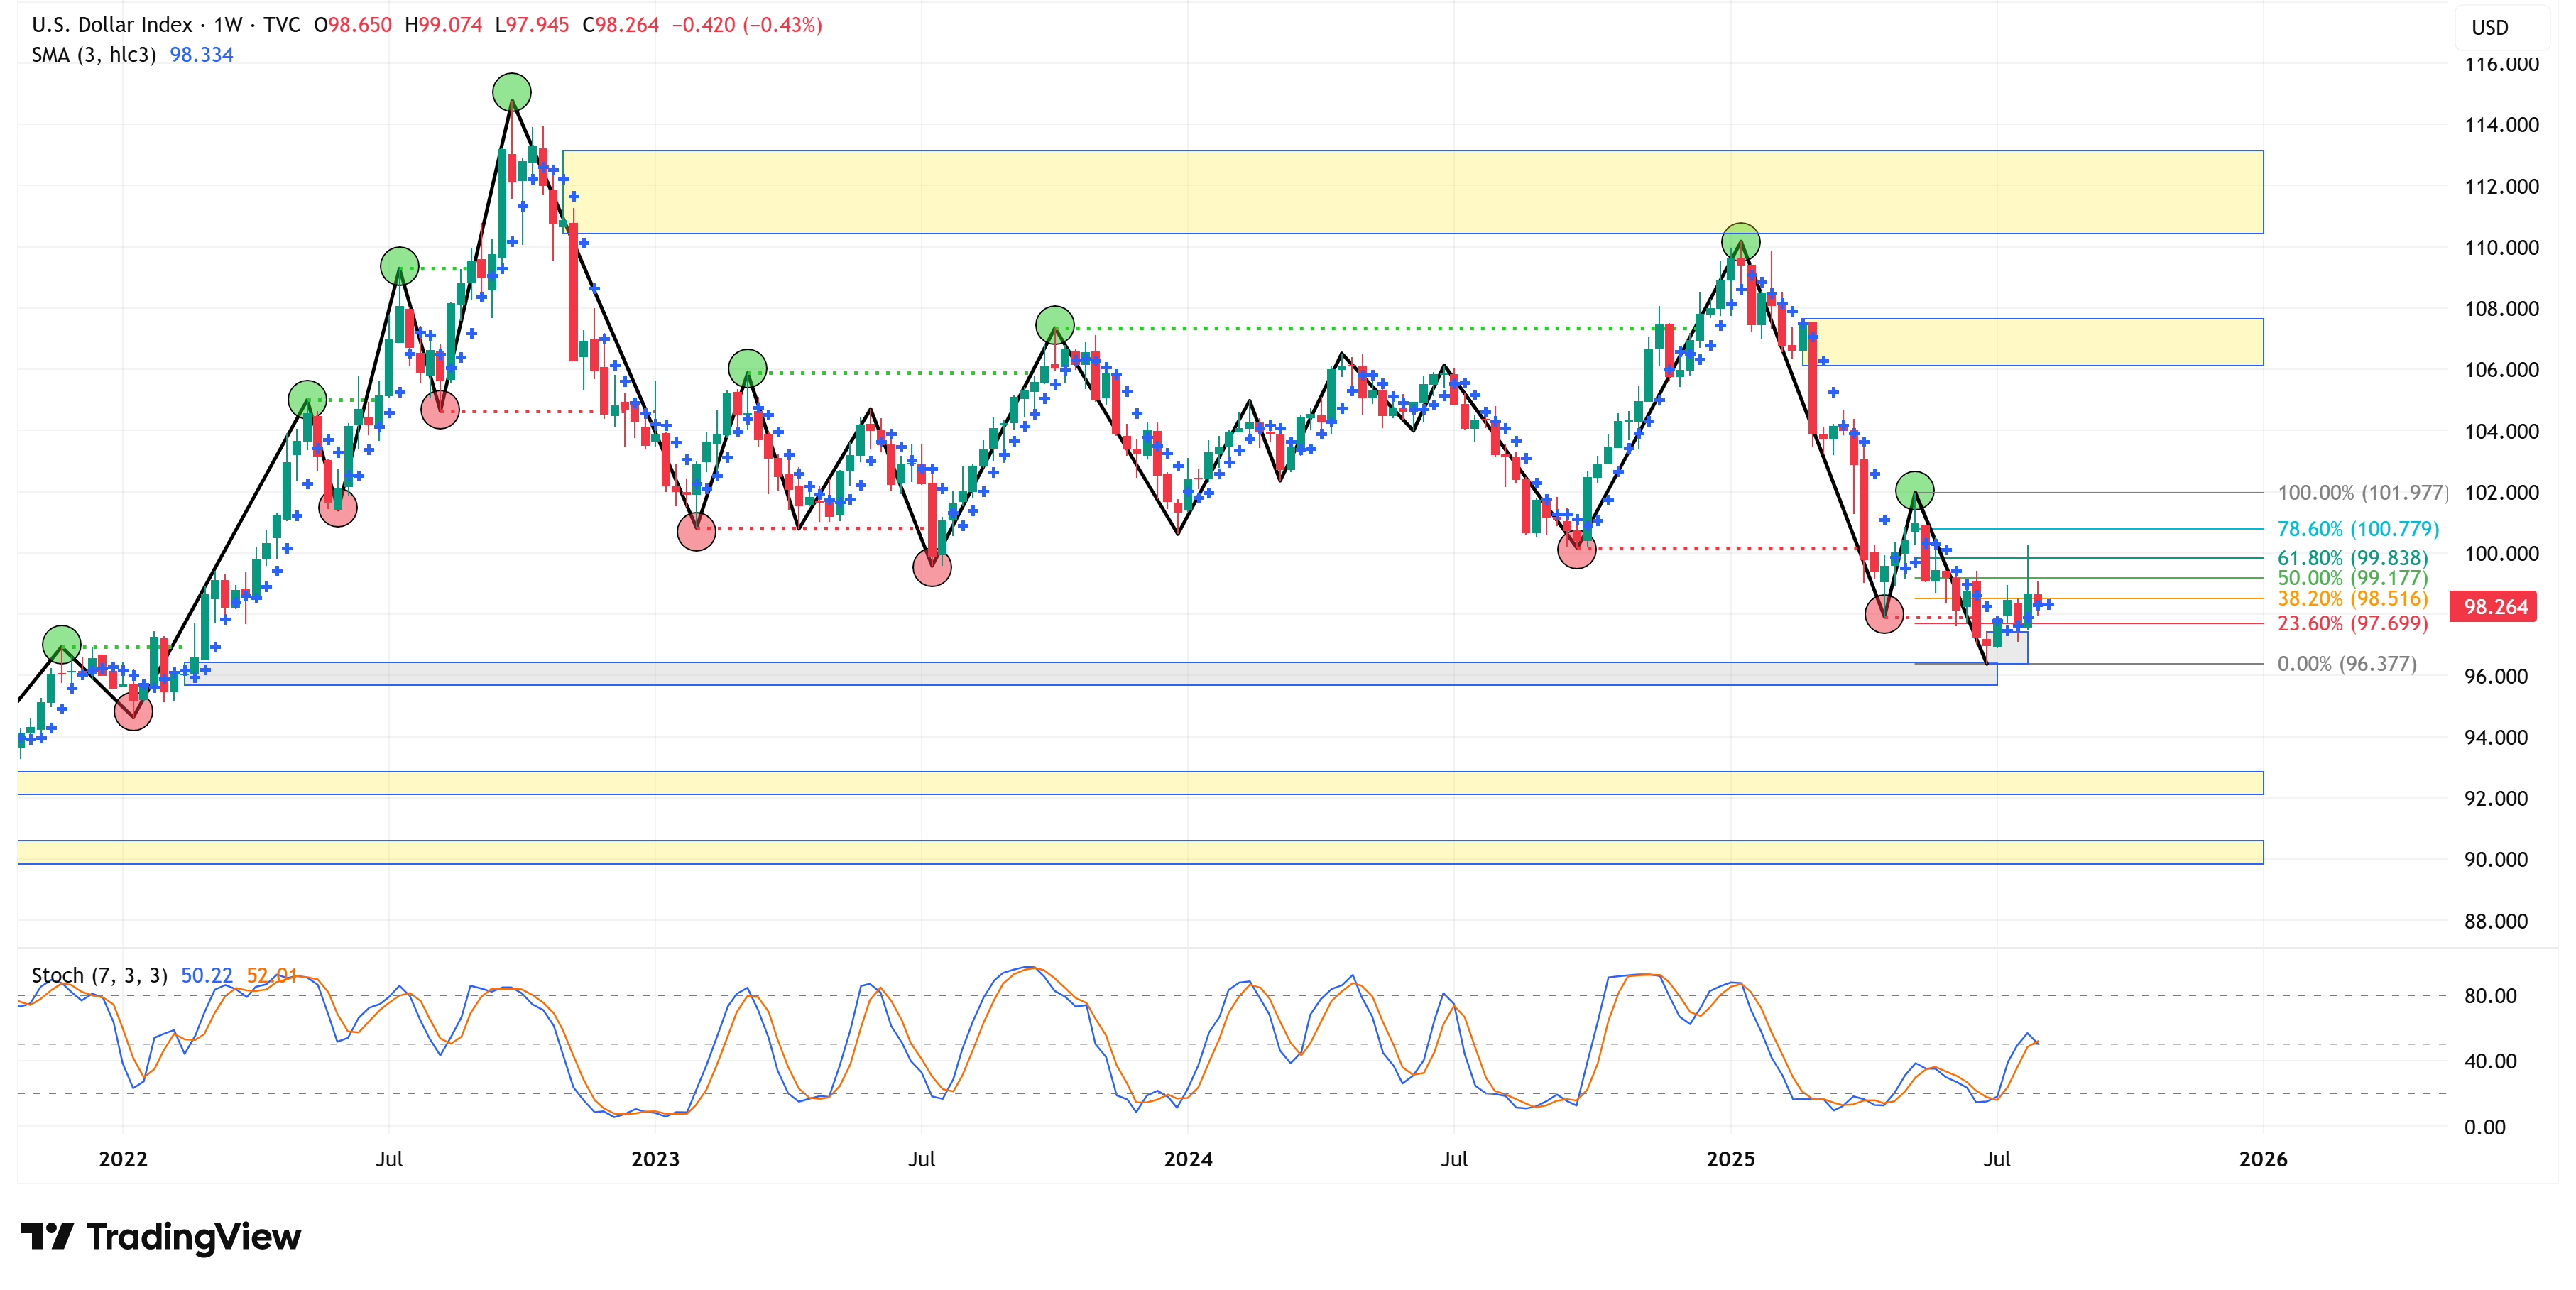
US Dollar (DXY)
📉 Trend = ⬇️ / 🎯 Target = 96.377 / 🛑 Stop Loss = 101.977
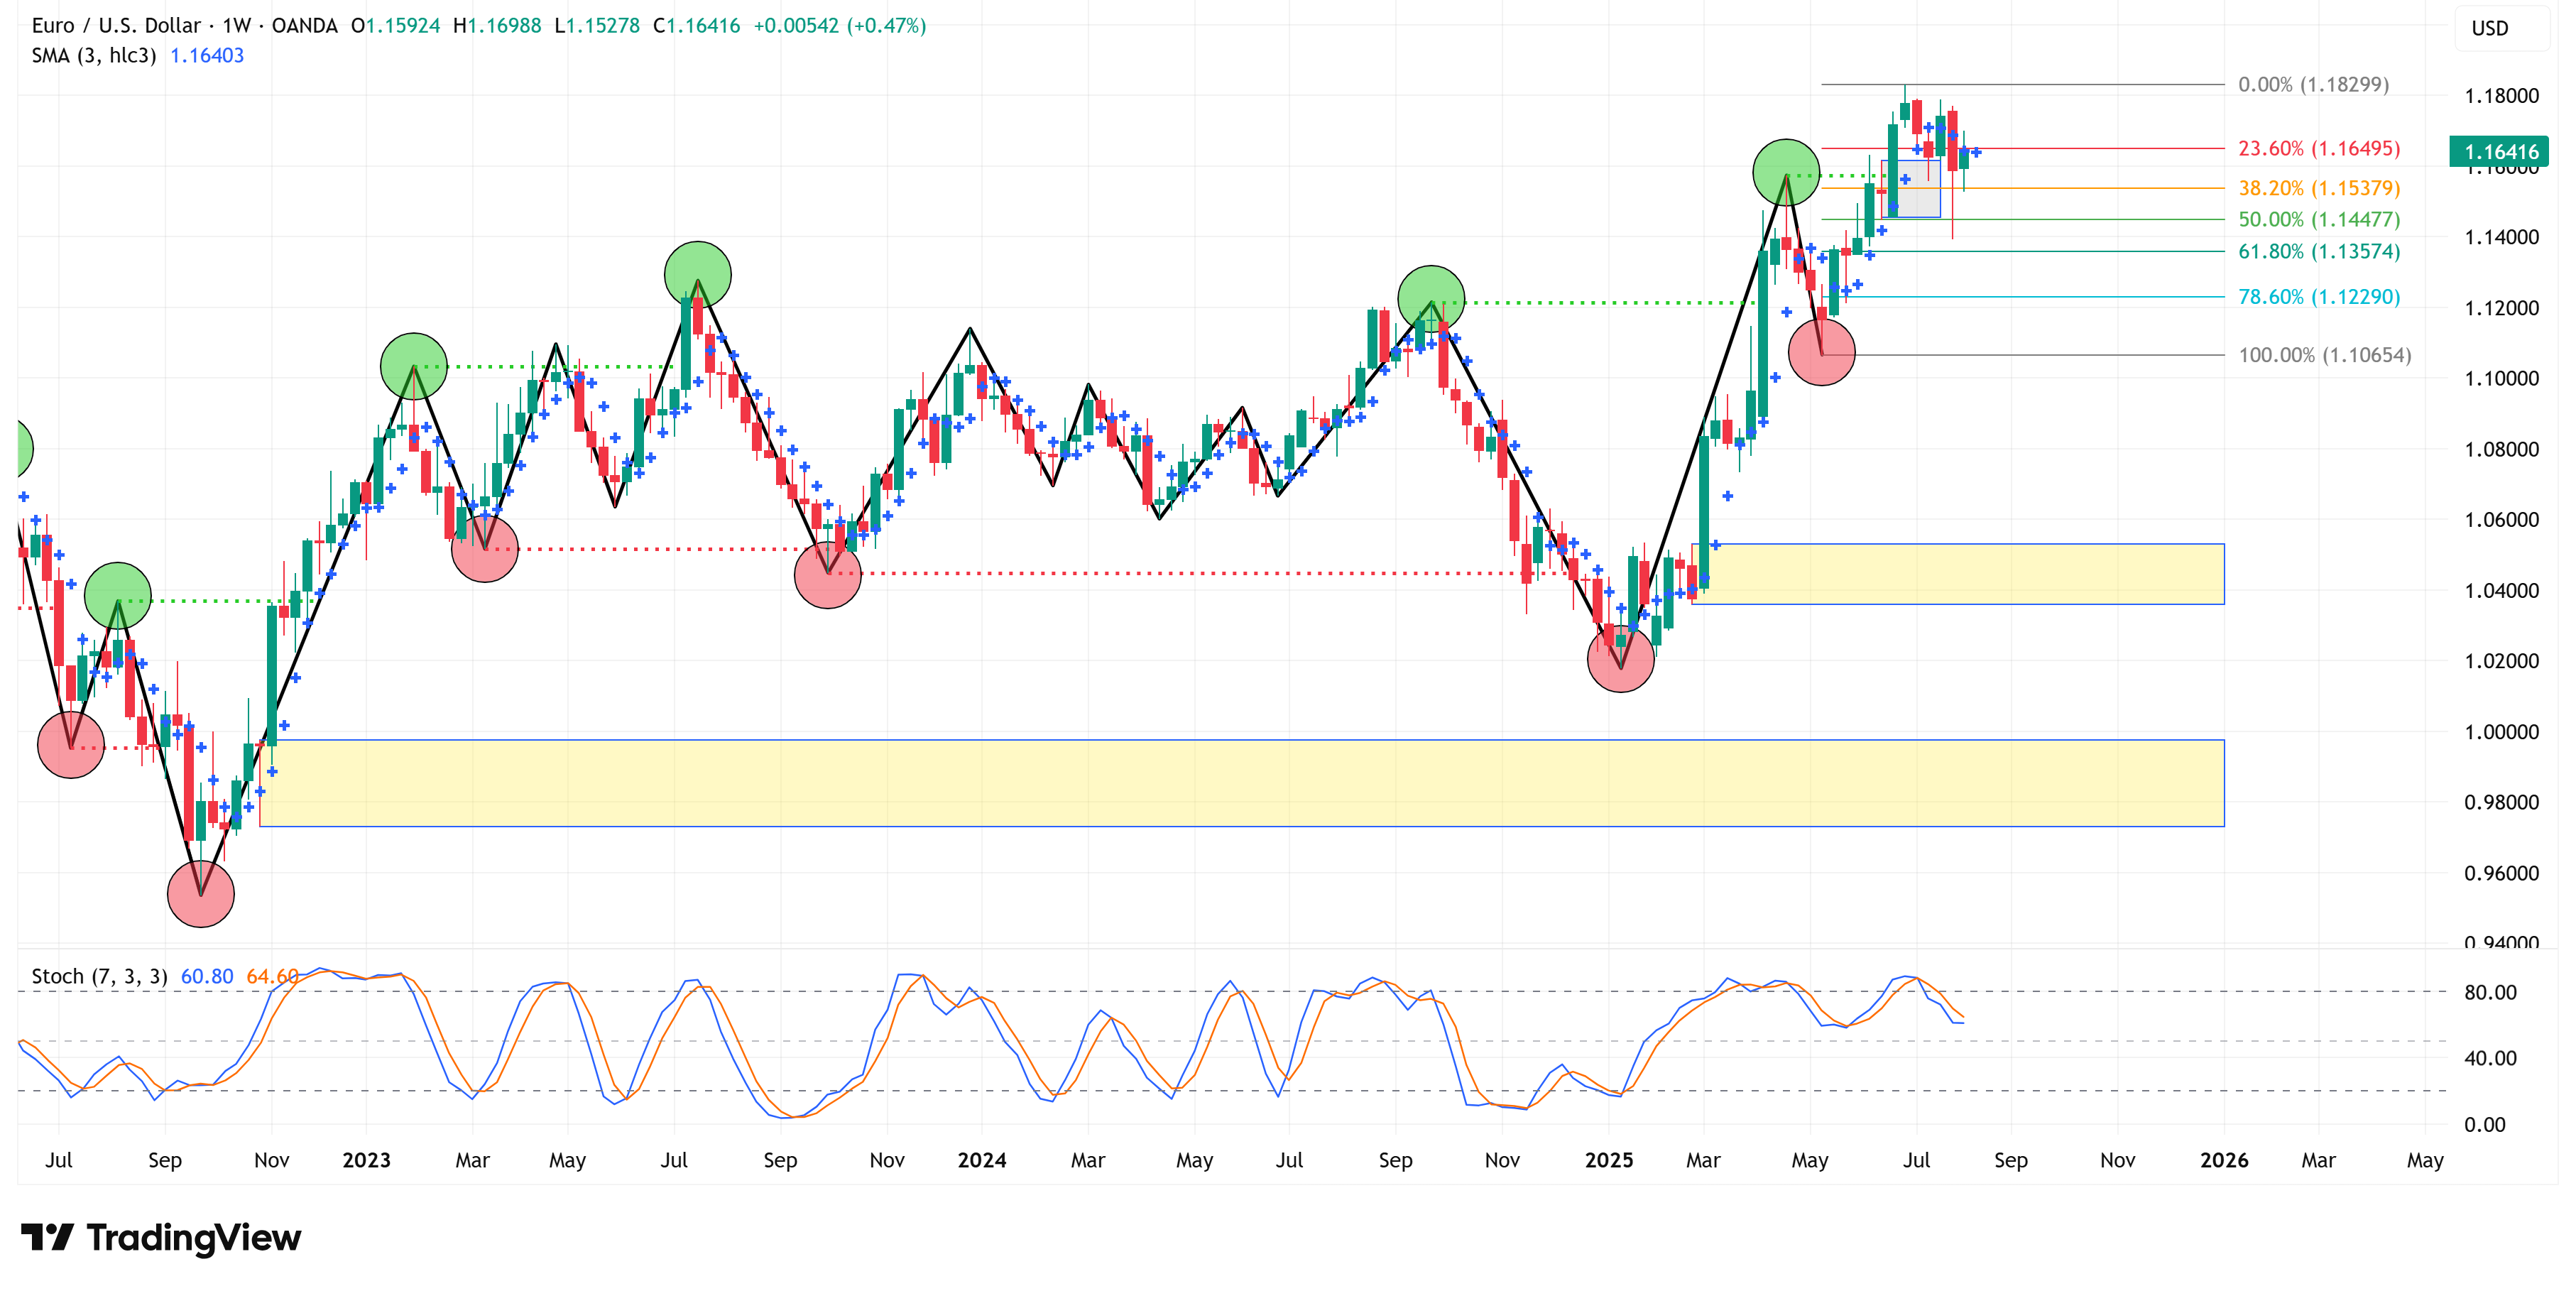
Euro (EUR/USD)
📈 Trend = ⬆️ / 🎯 Target = 1.18299 / 🛑 Stop Loss = 1.10654
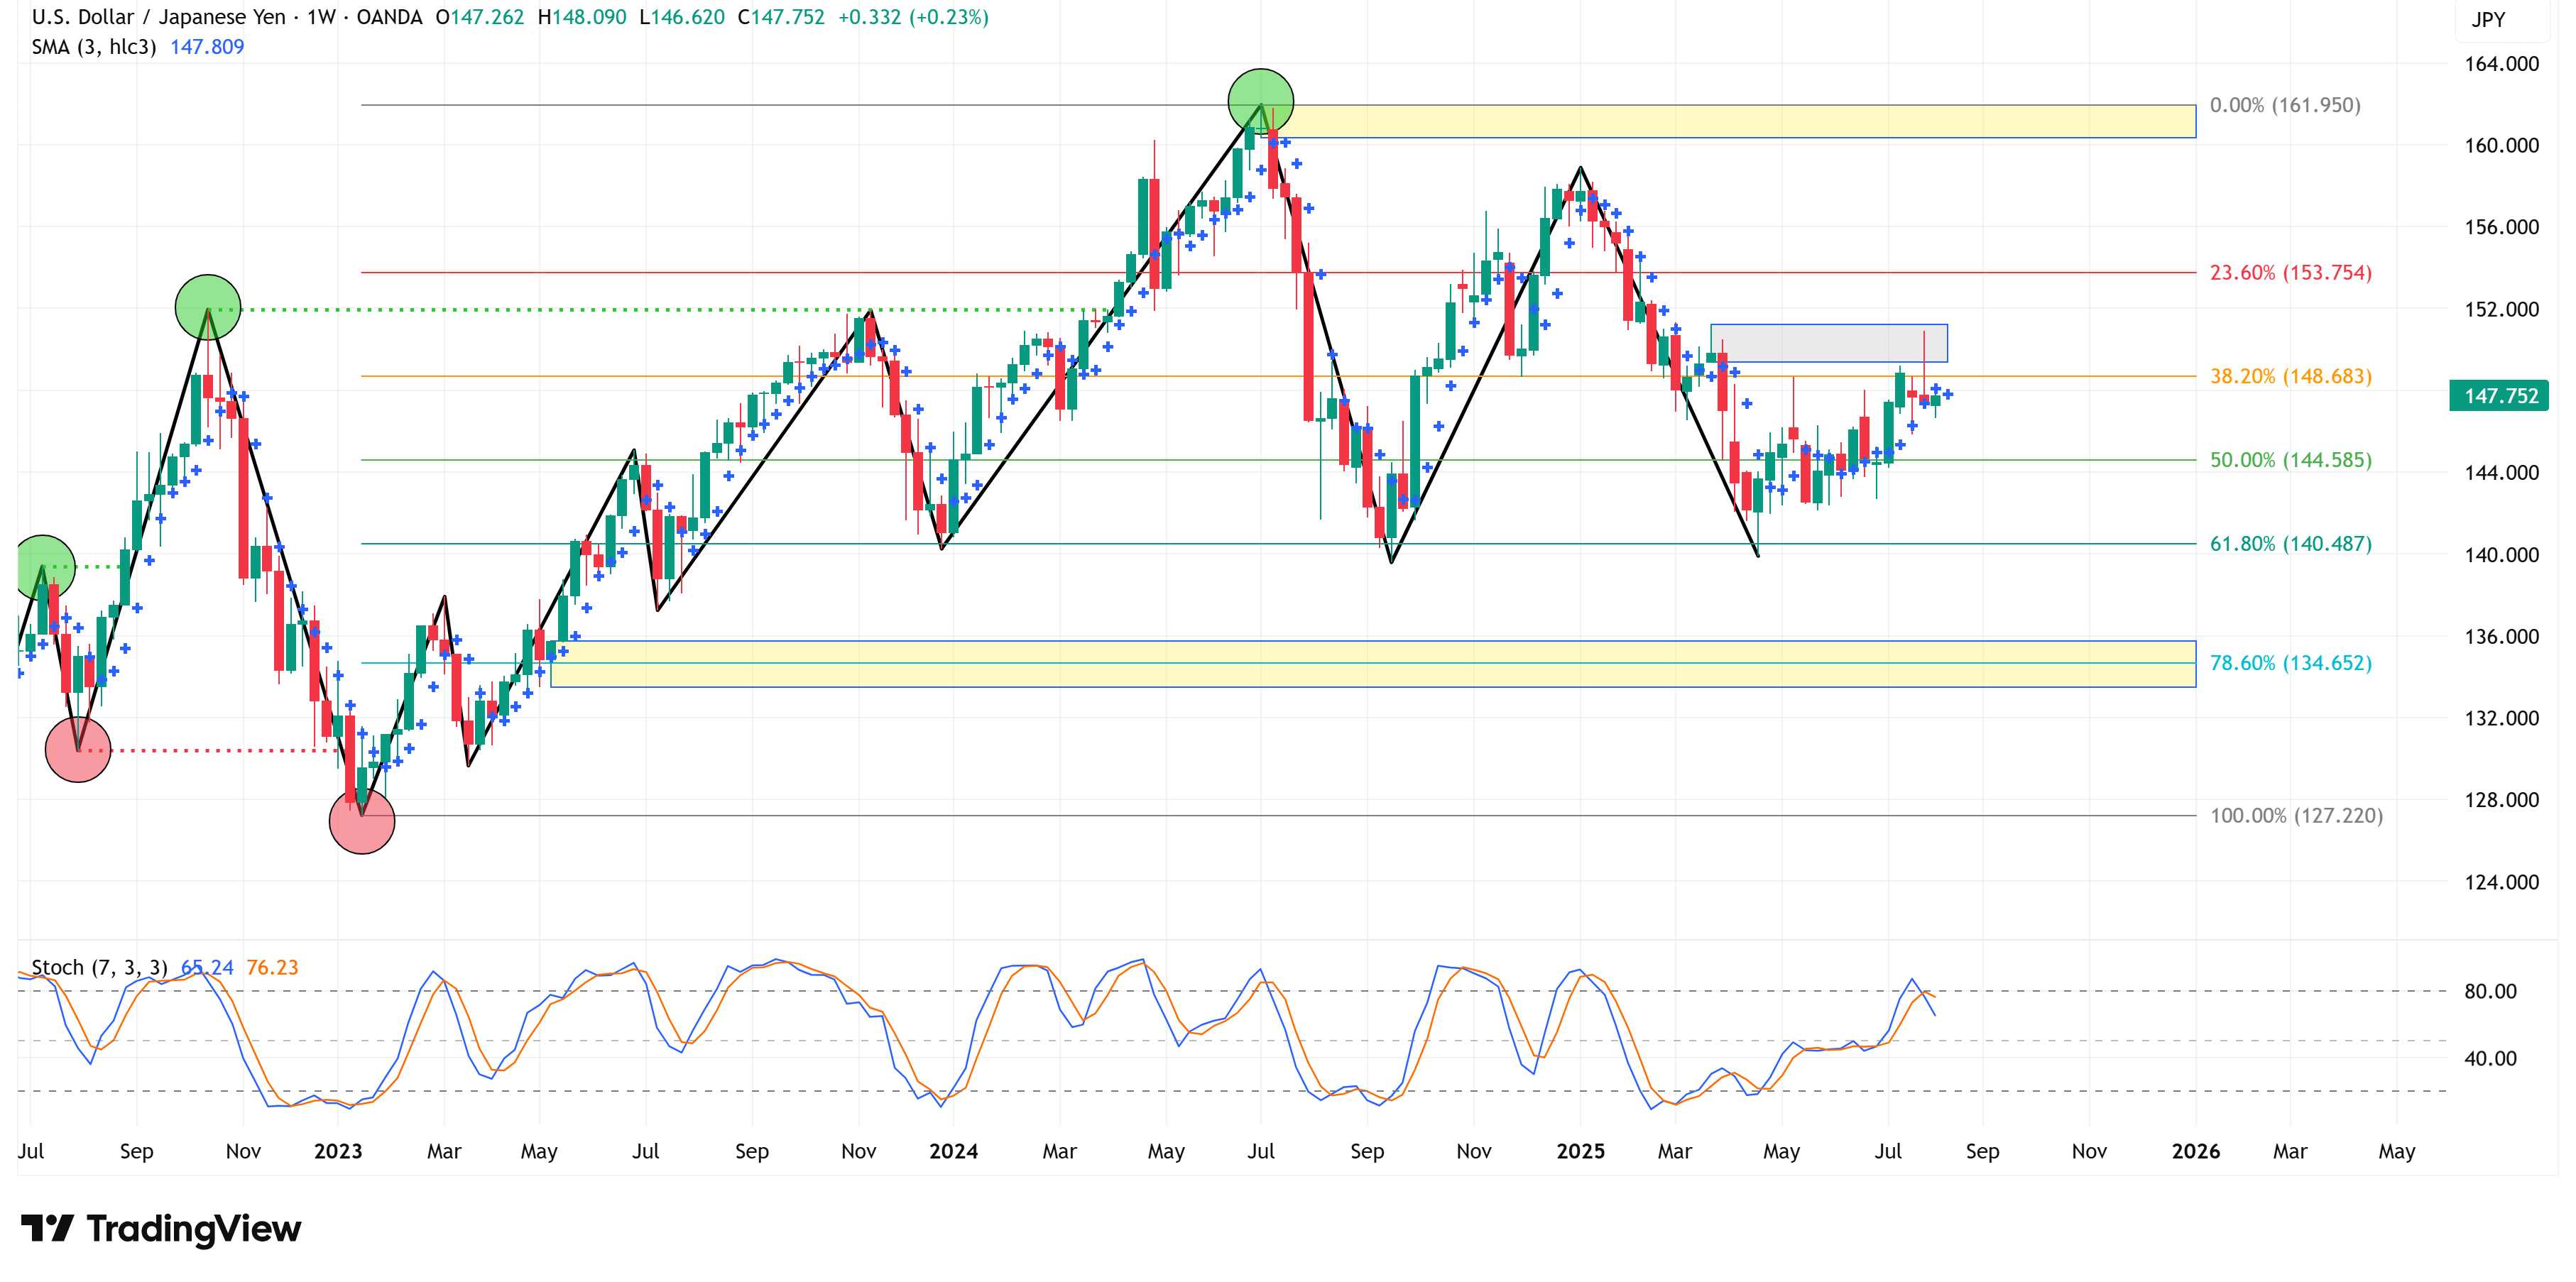
Japanese Yen (USD/JPY)
📈 Trend = ⬆️ / 🎯 Target = 161.950 / 🛑 Stop Loss = 127.220
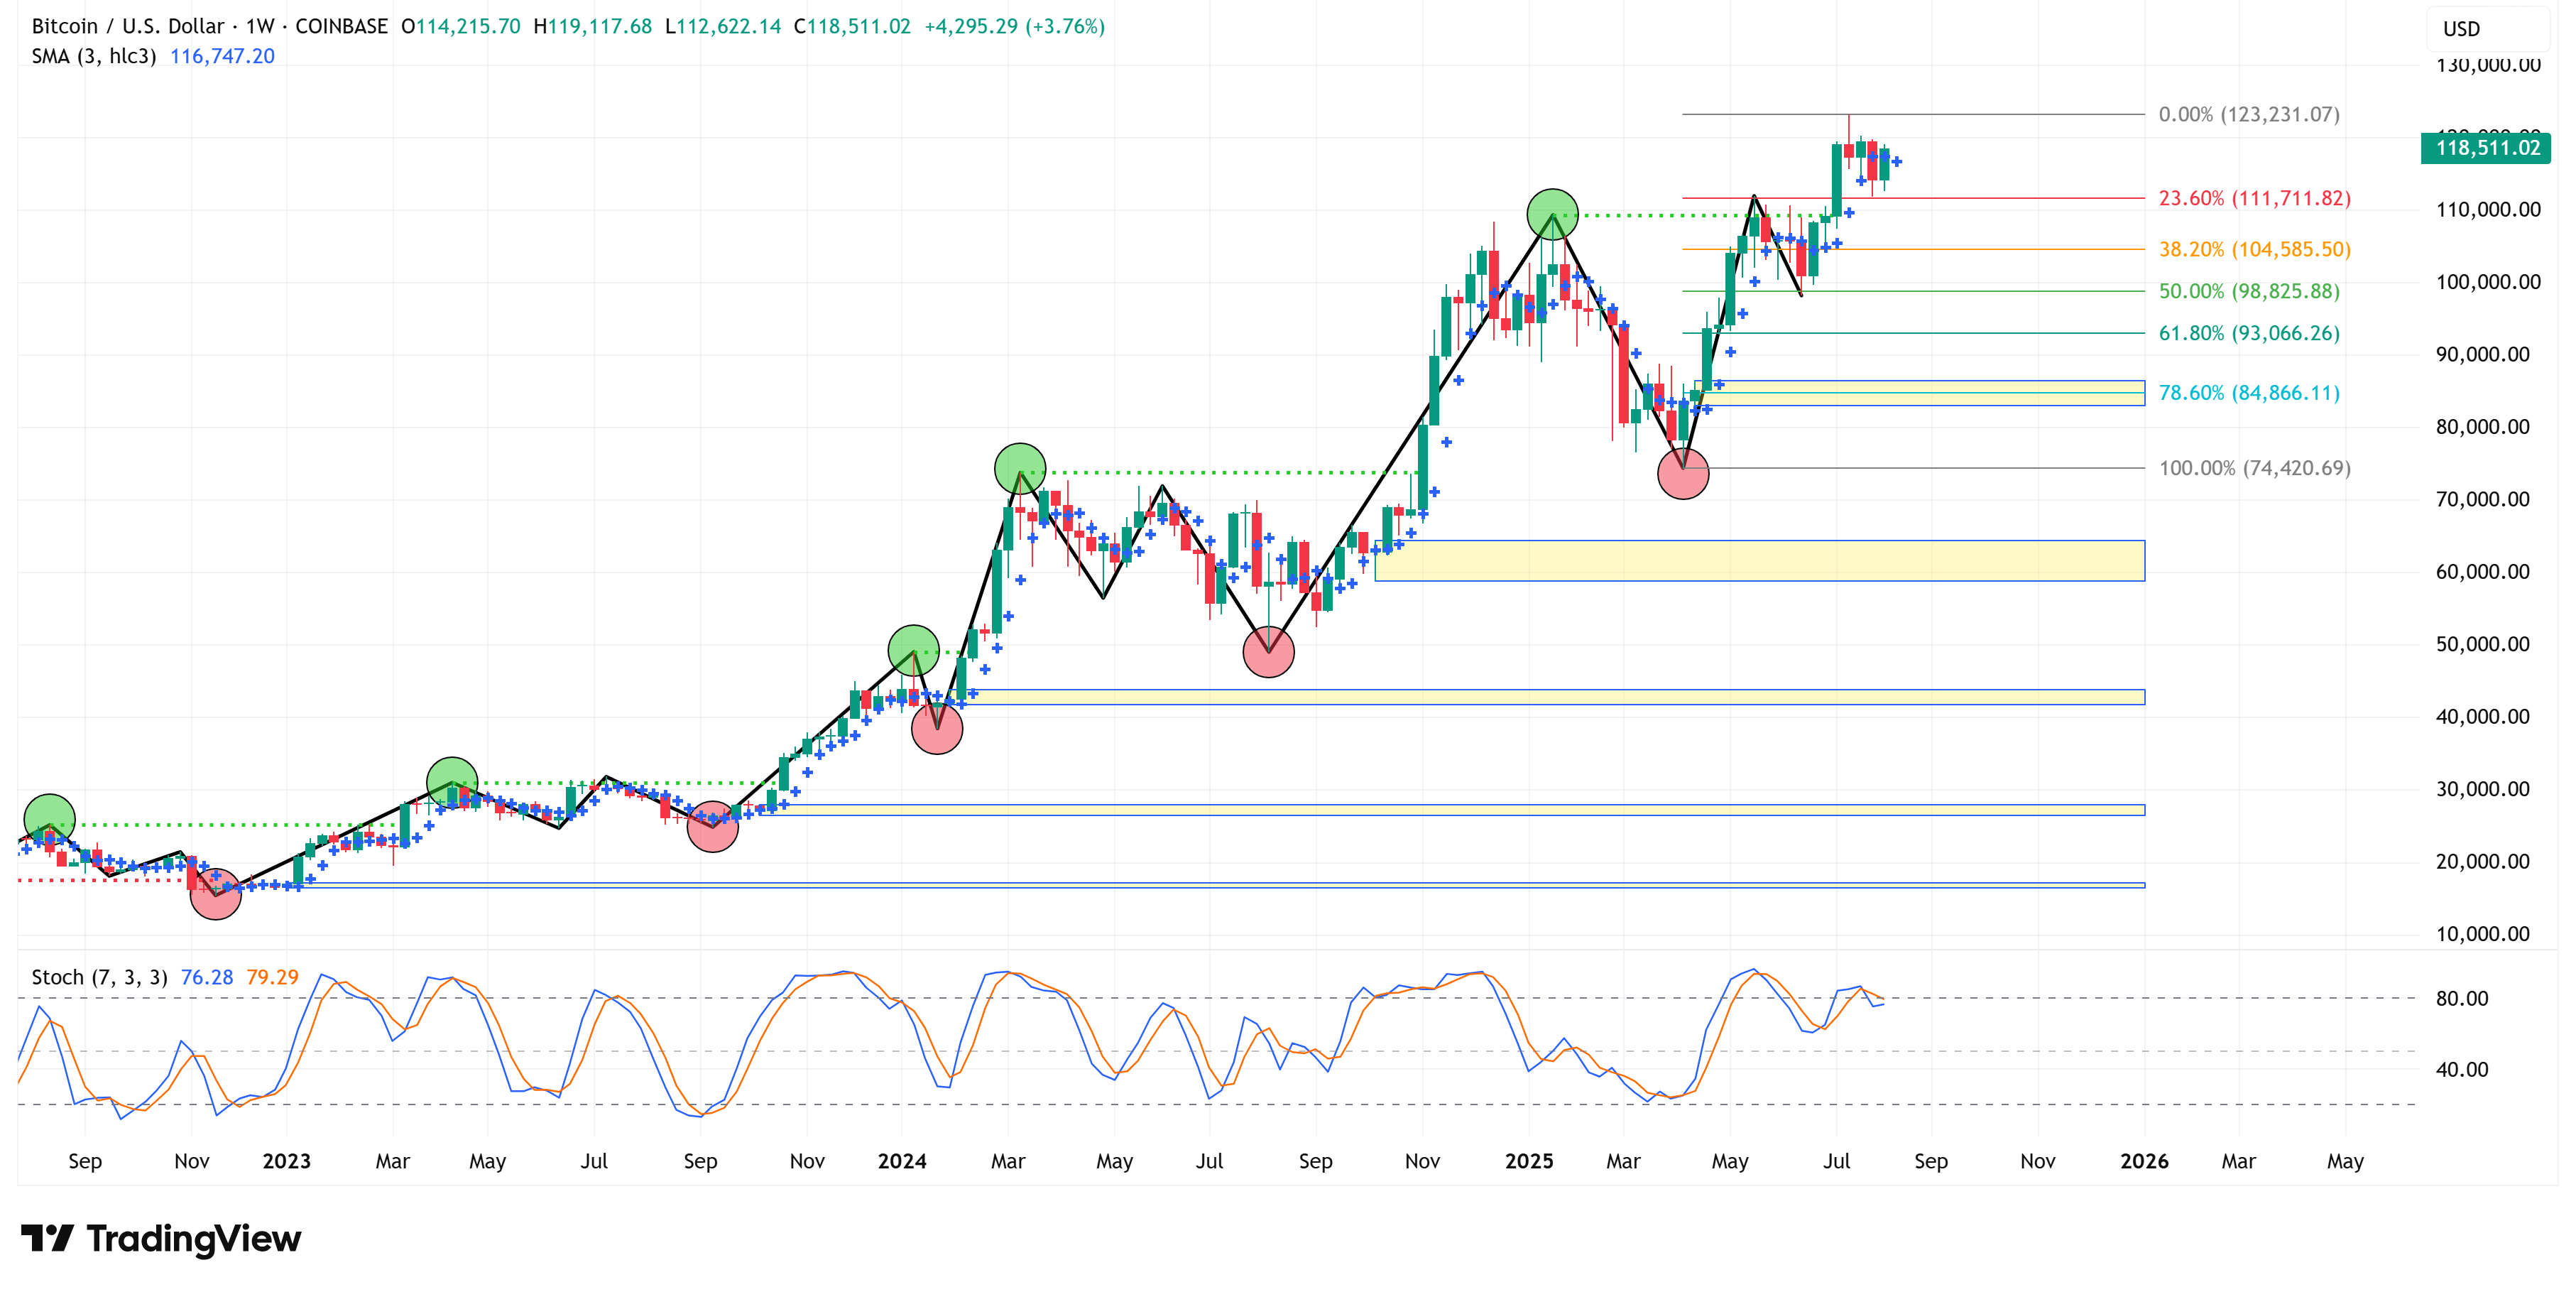
Bitcoin
📈 Trend = ⬆️ / 🎯 Target = 123,231 / 🛑 Stop Loss = 74,421
Commodities:
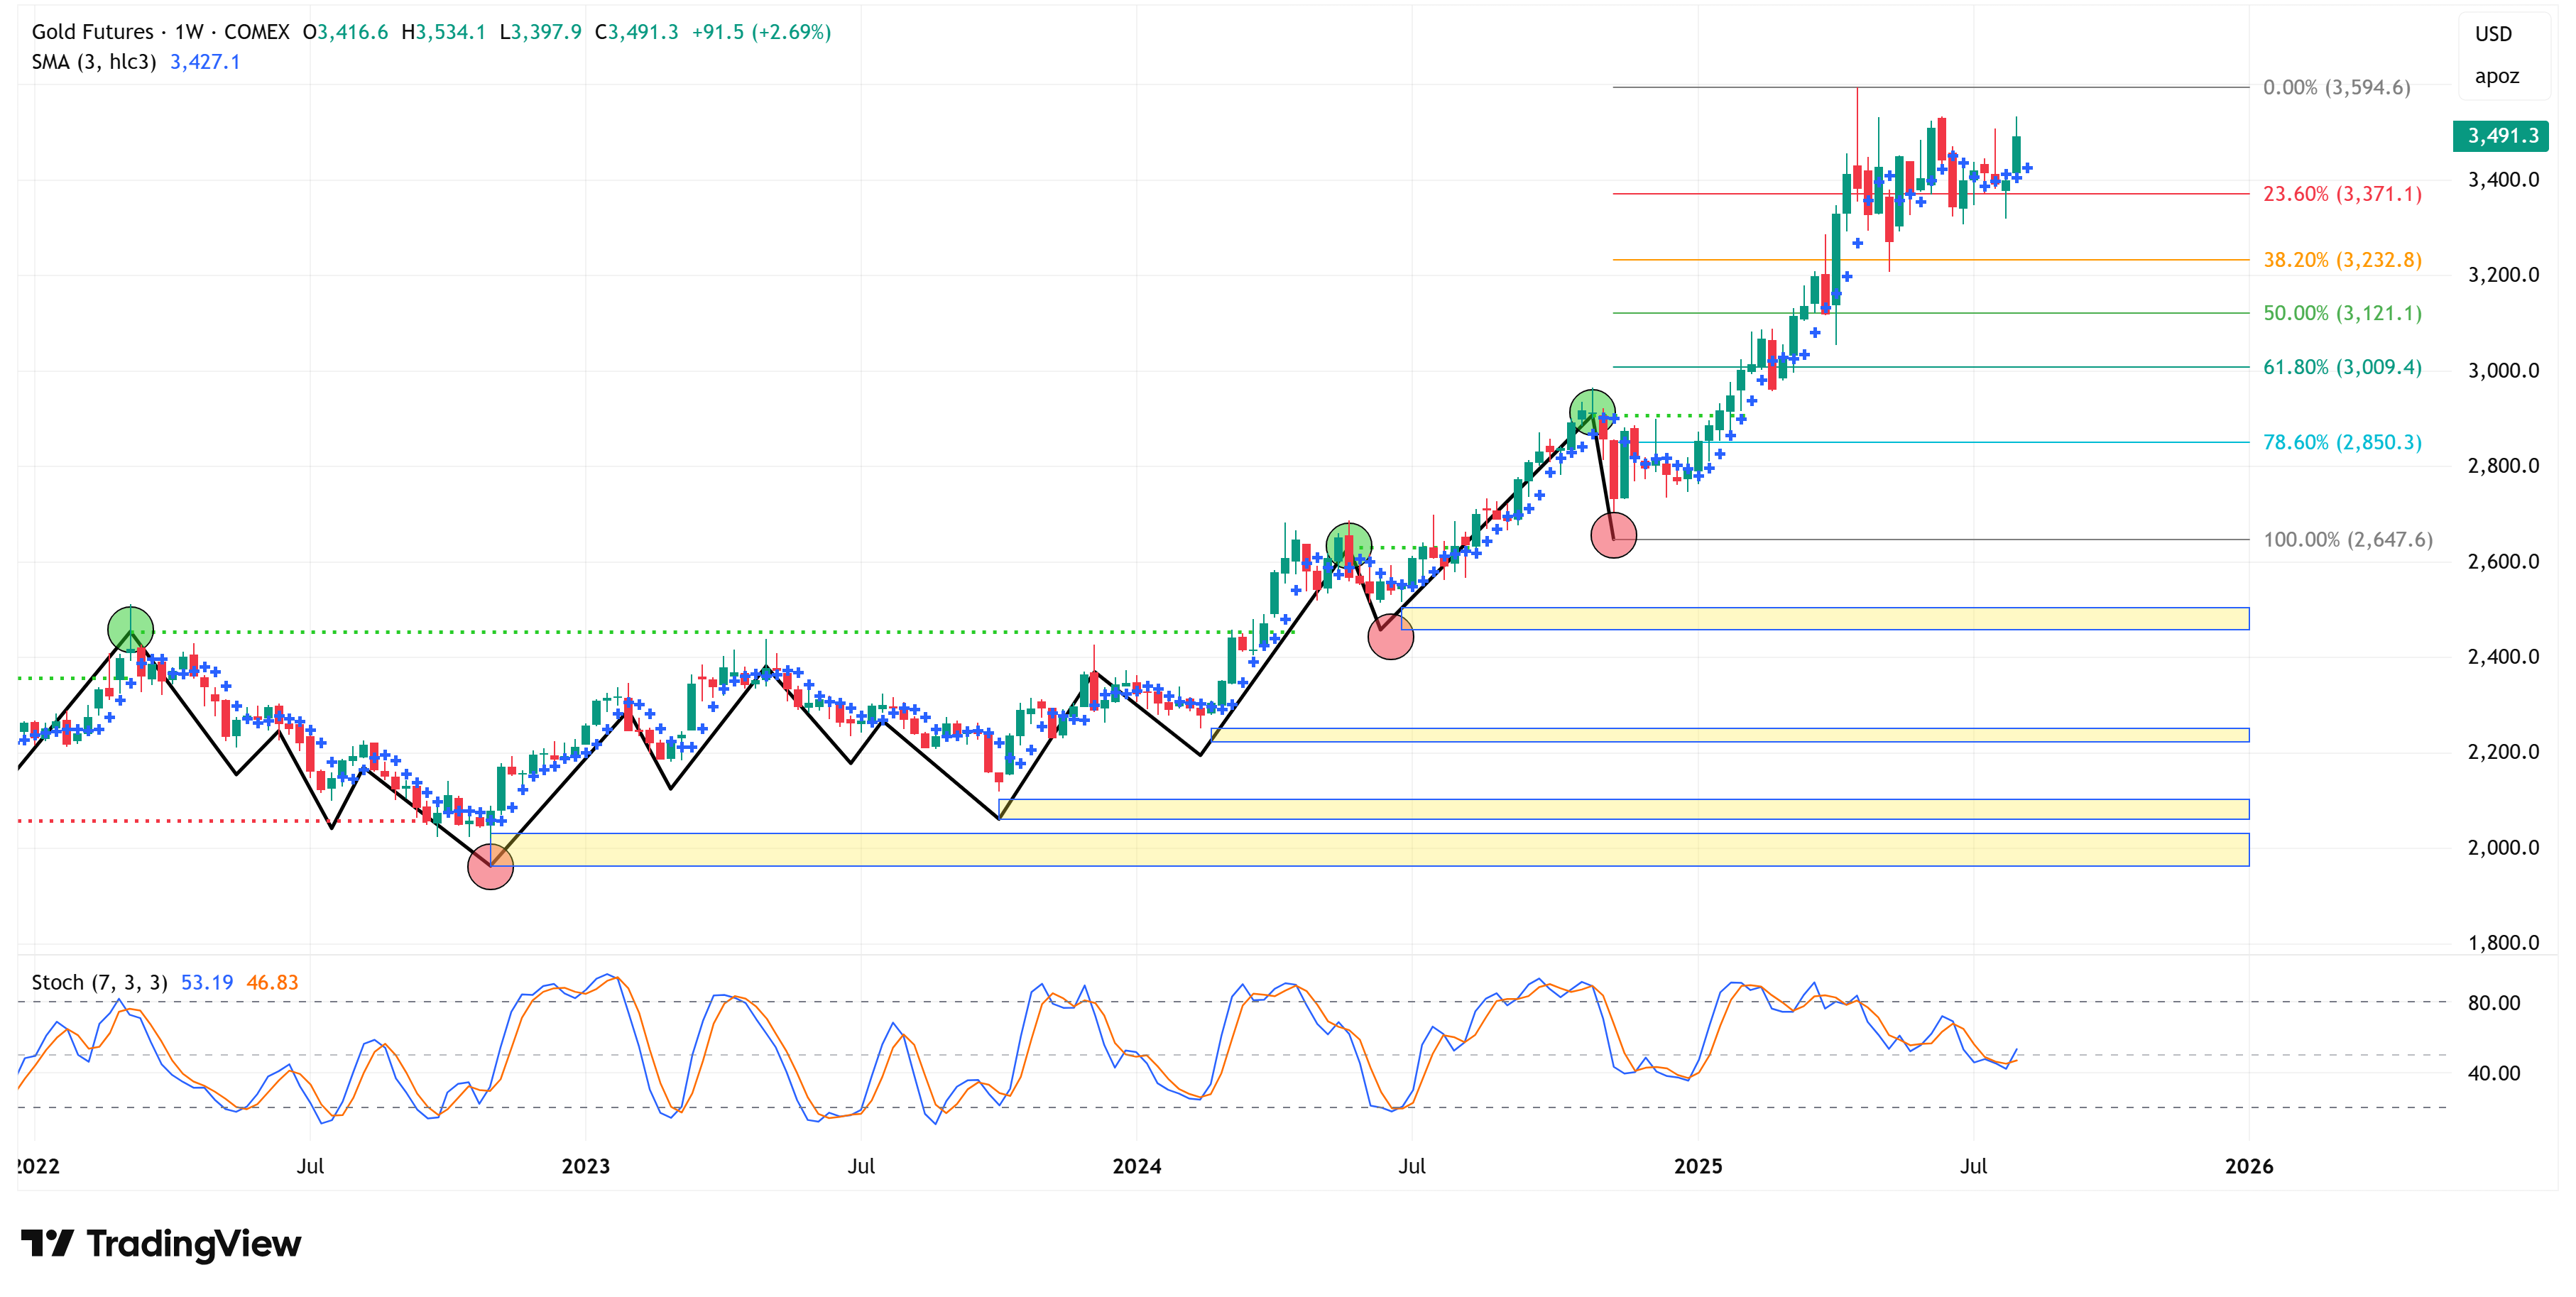
Gold
📈 Trend = ⬆️ / 🎯 Target = 3,595 / 🛑 Stop Loss = 2,648
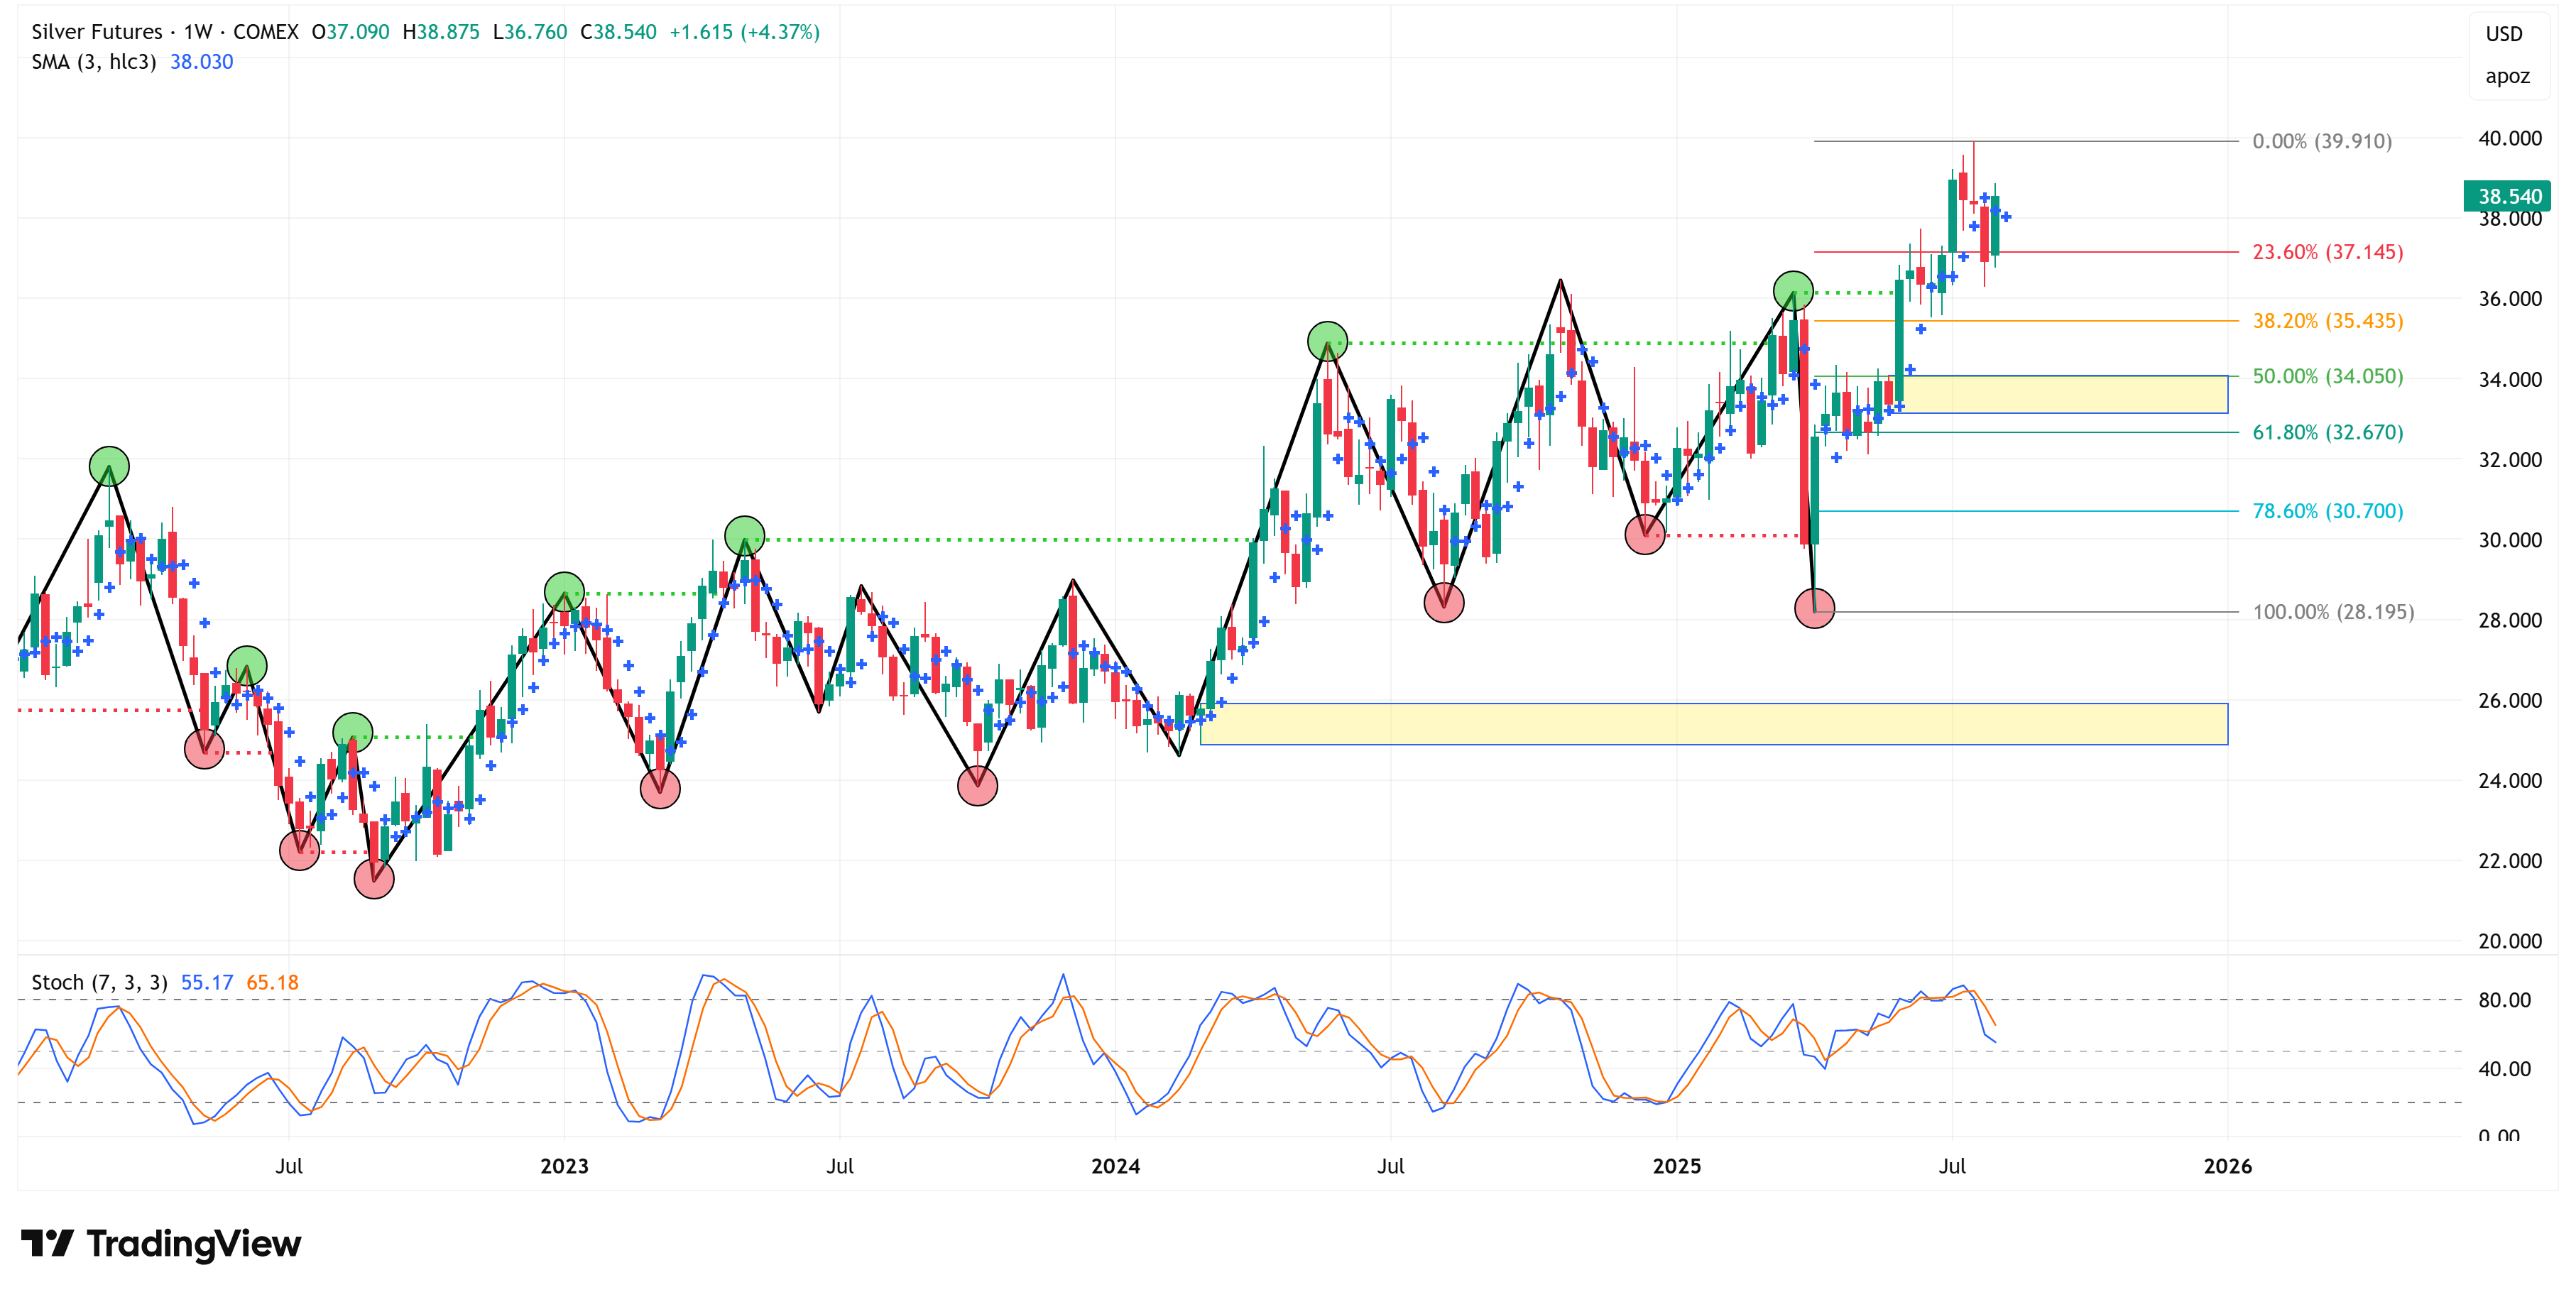
Silver
📈 Trend = ⬆️ / 🎯 Target = 39.91 / 🛑 Stop Loss = 28.20
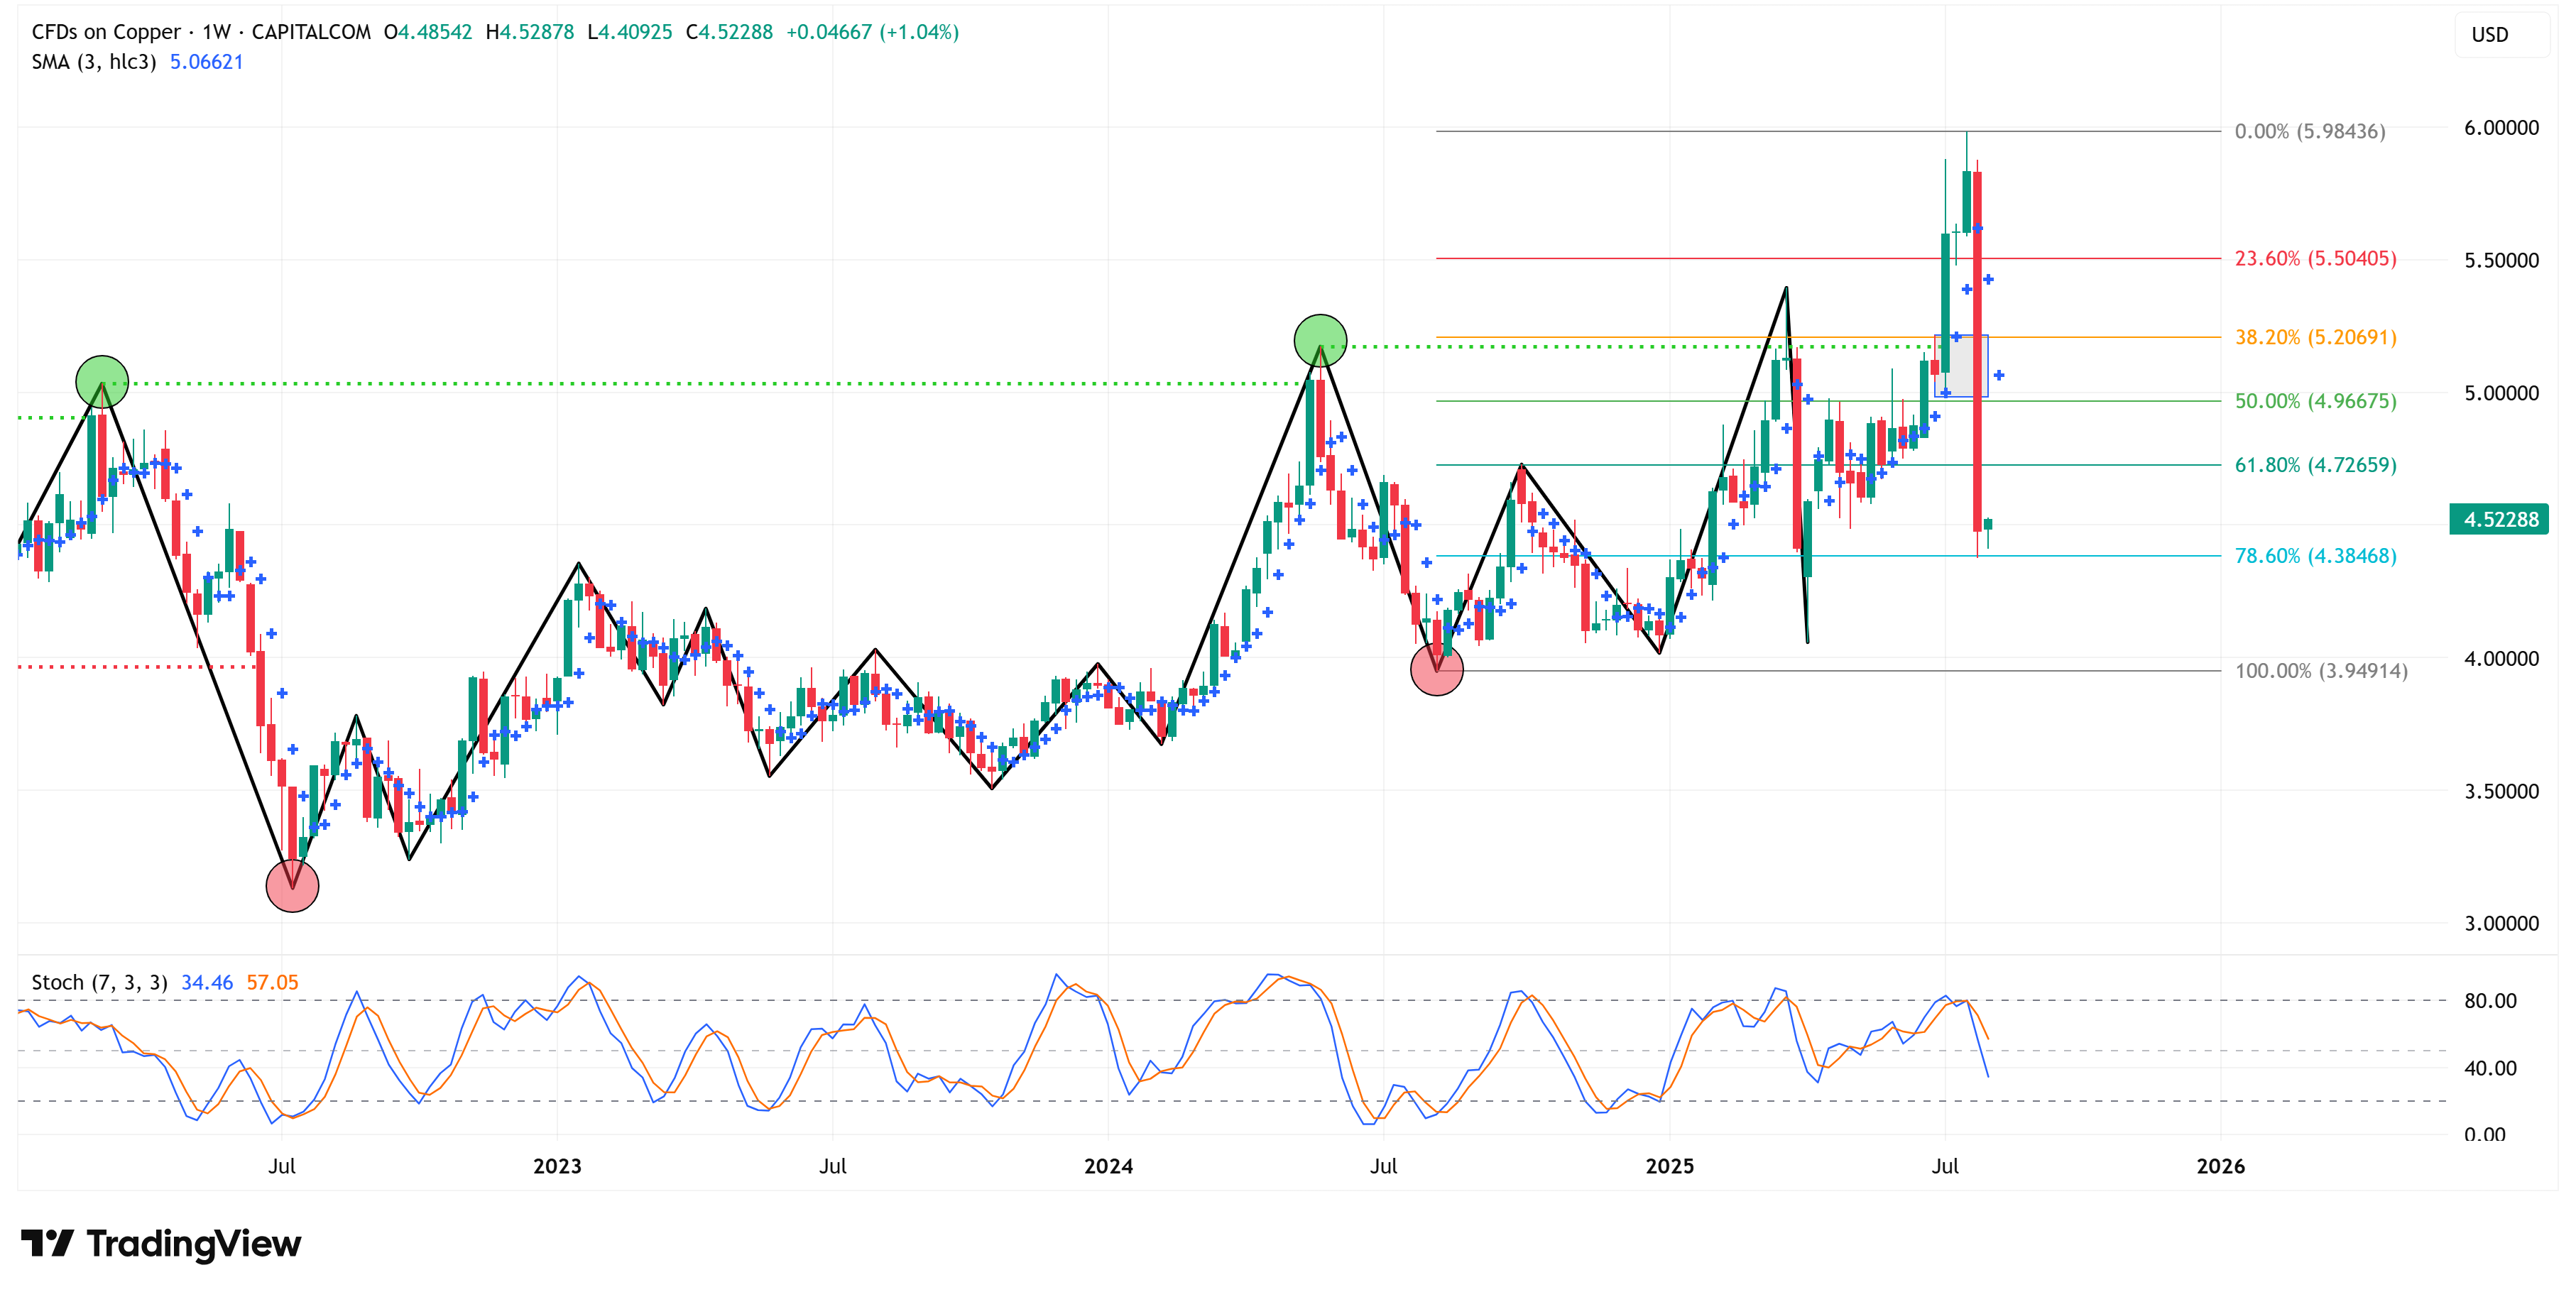
Copper
📈 Trend = ⬆️ / 🎯 Target = 5.984 / 🛑 Stop Loss = 3.949
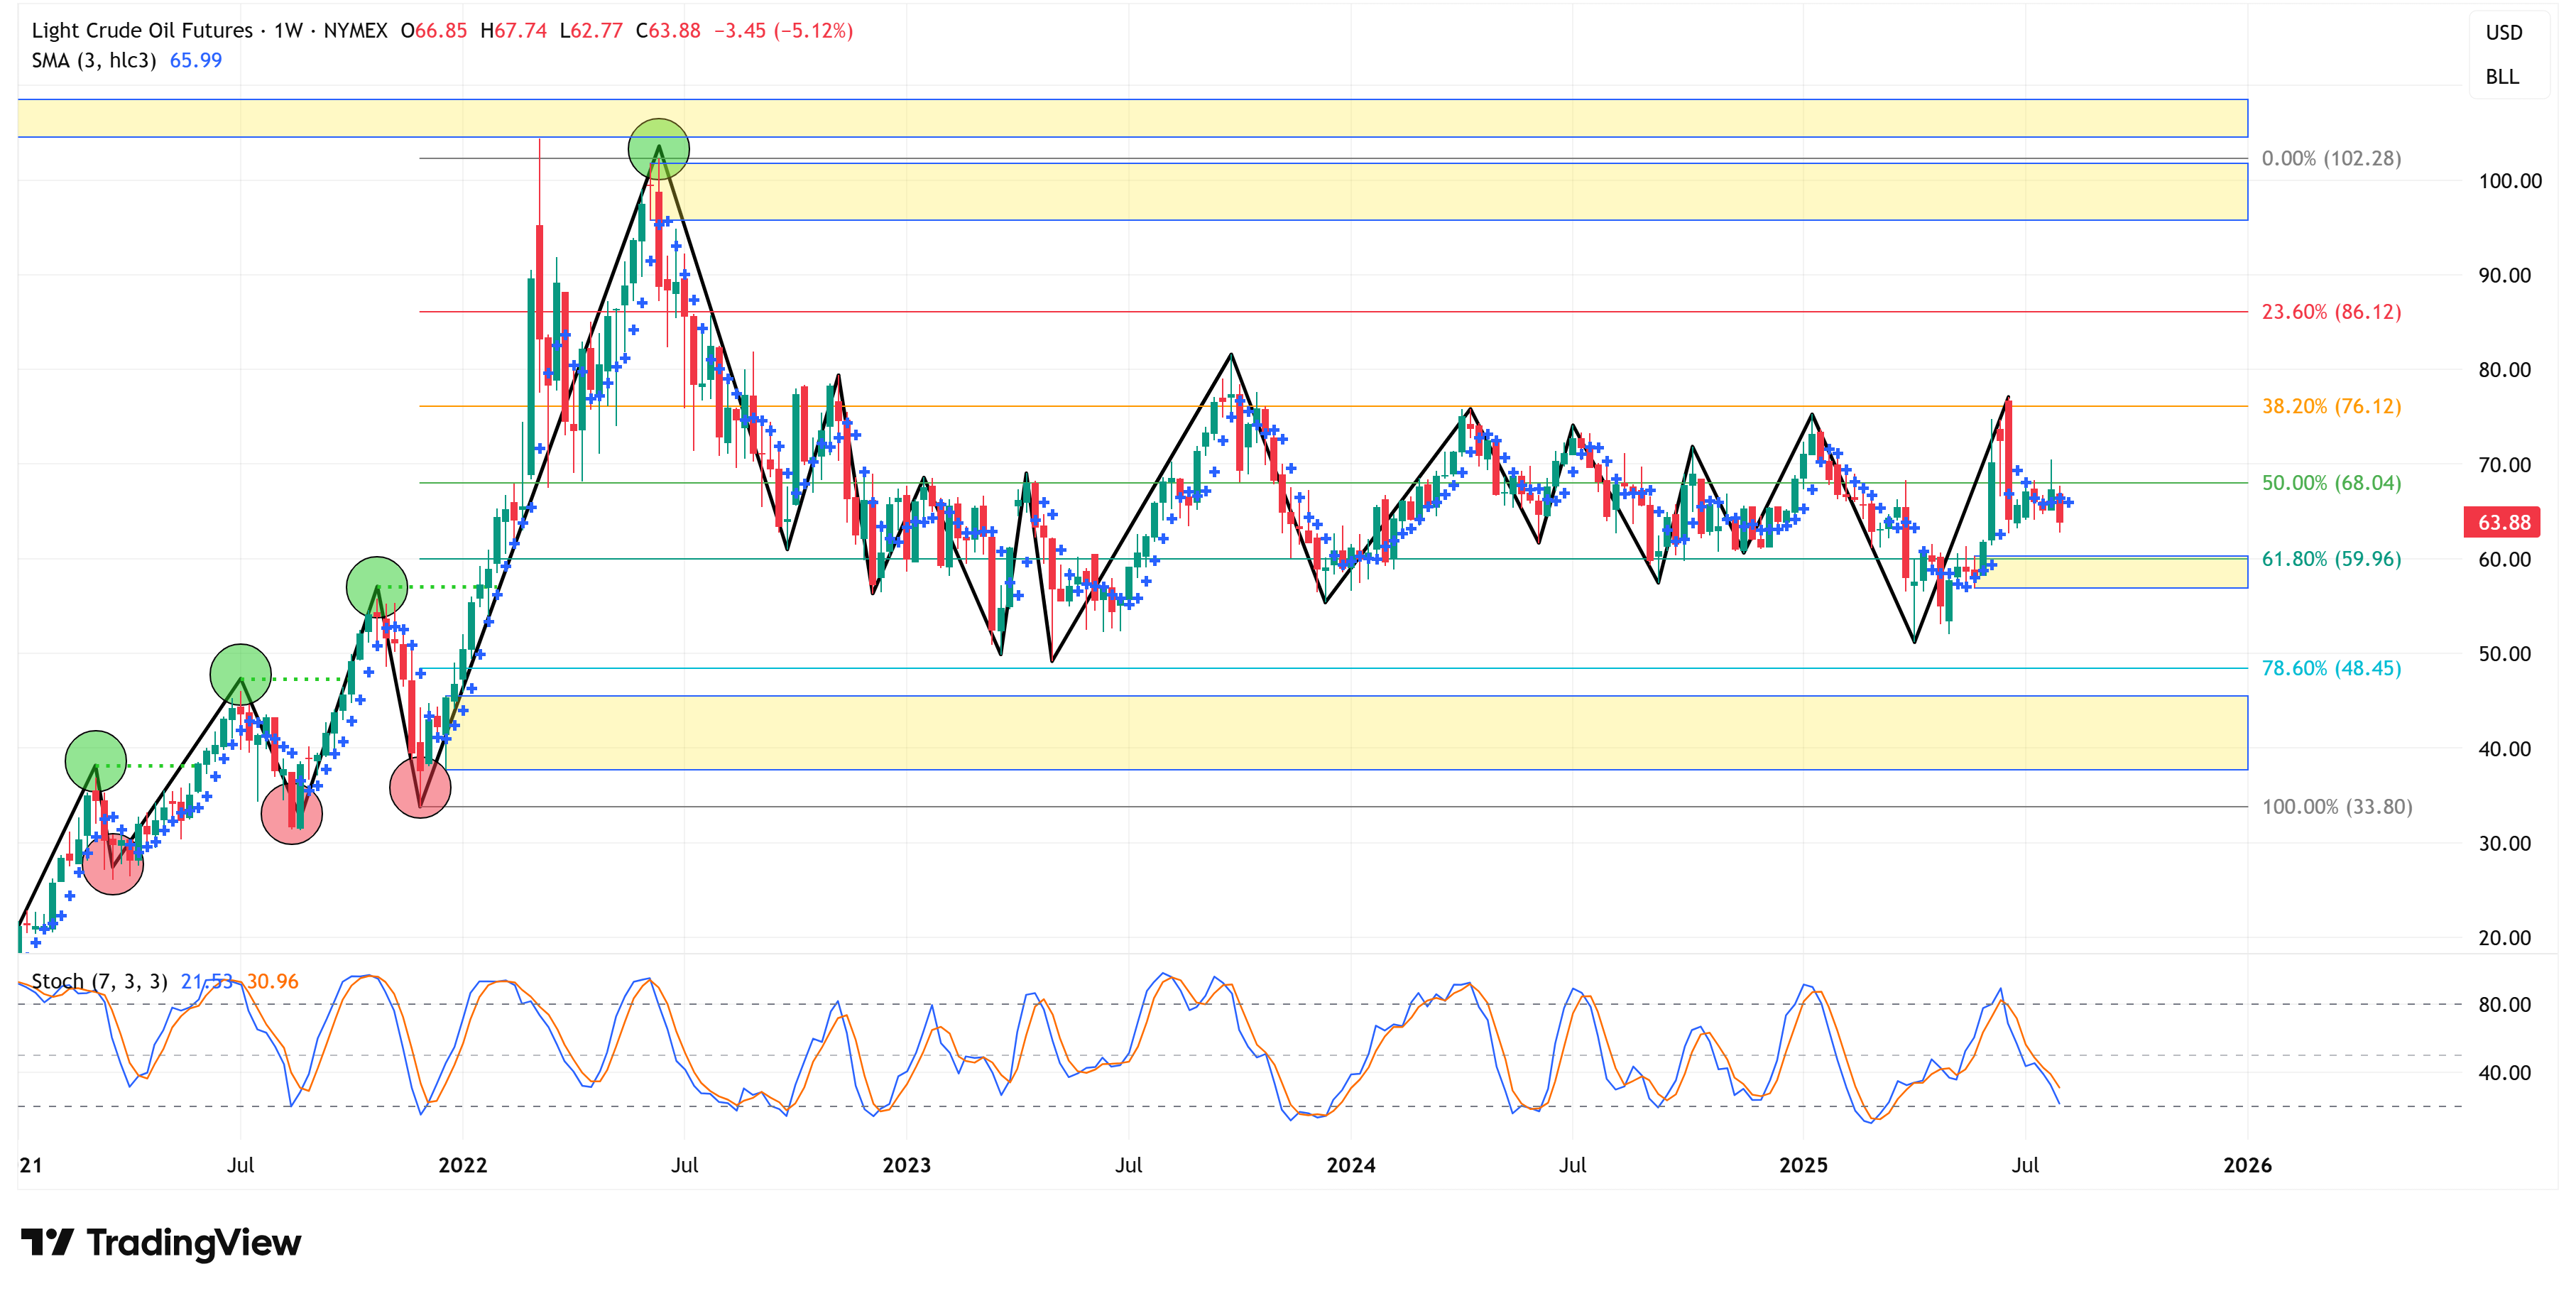
Crude
📈 Trend = ⬆️ / 🎯 Target = 102.28 / 🛑 Stop Loss = 33.80
Fixed Income:
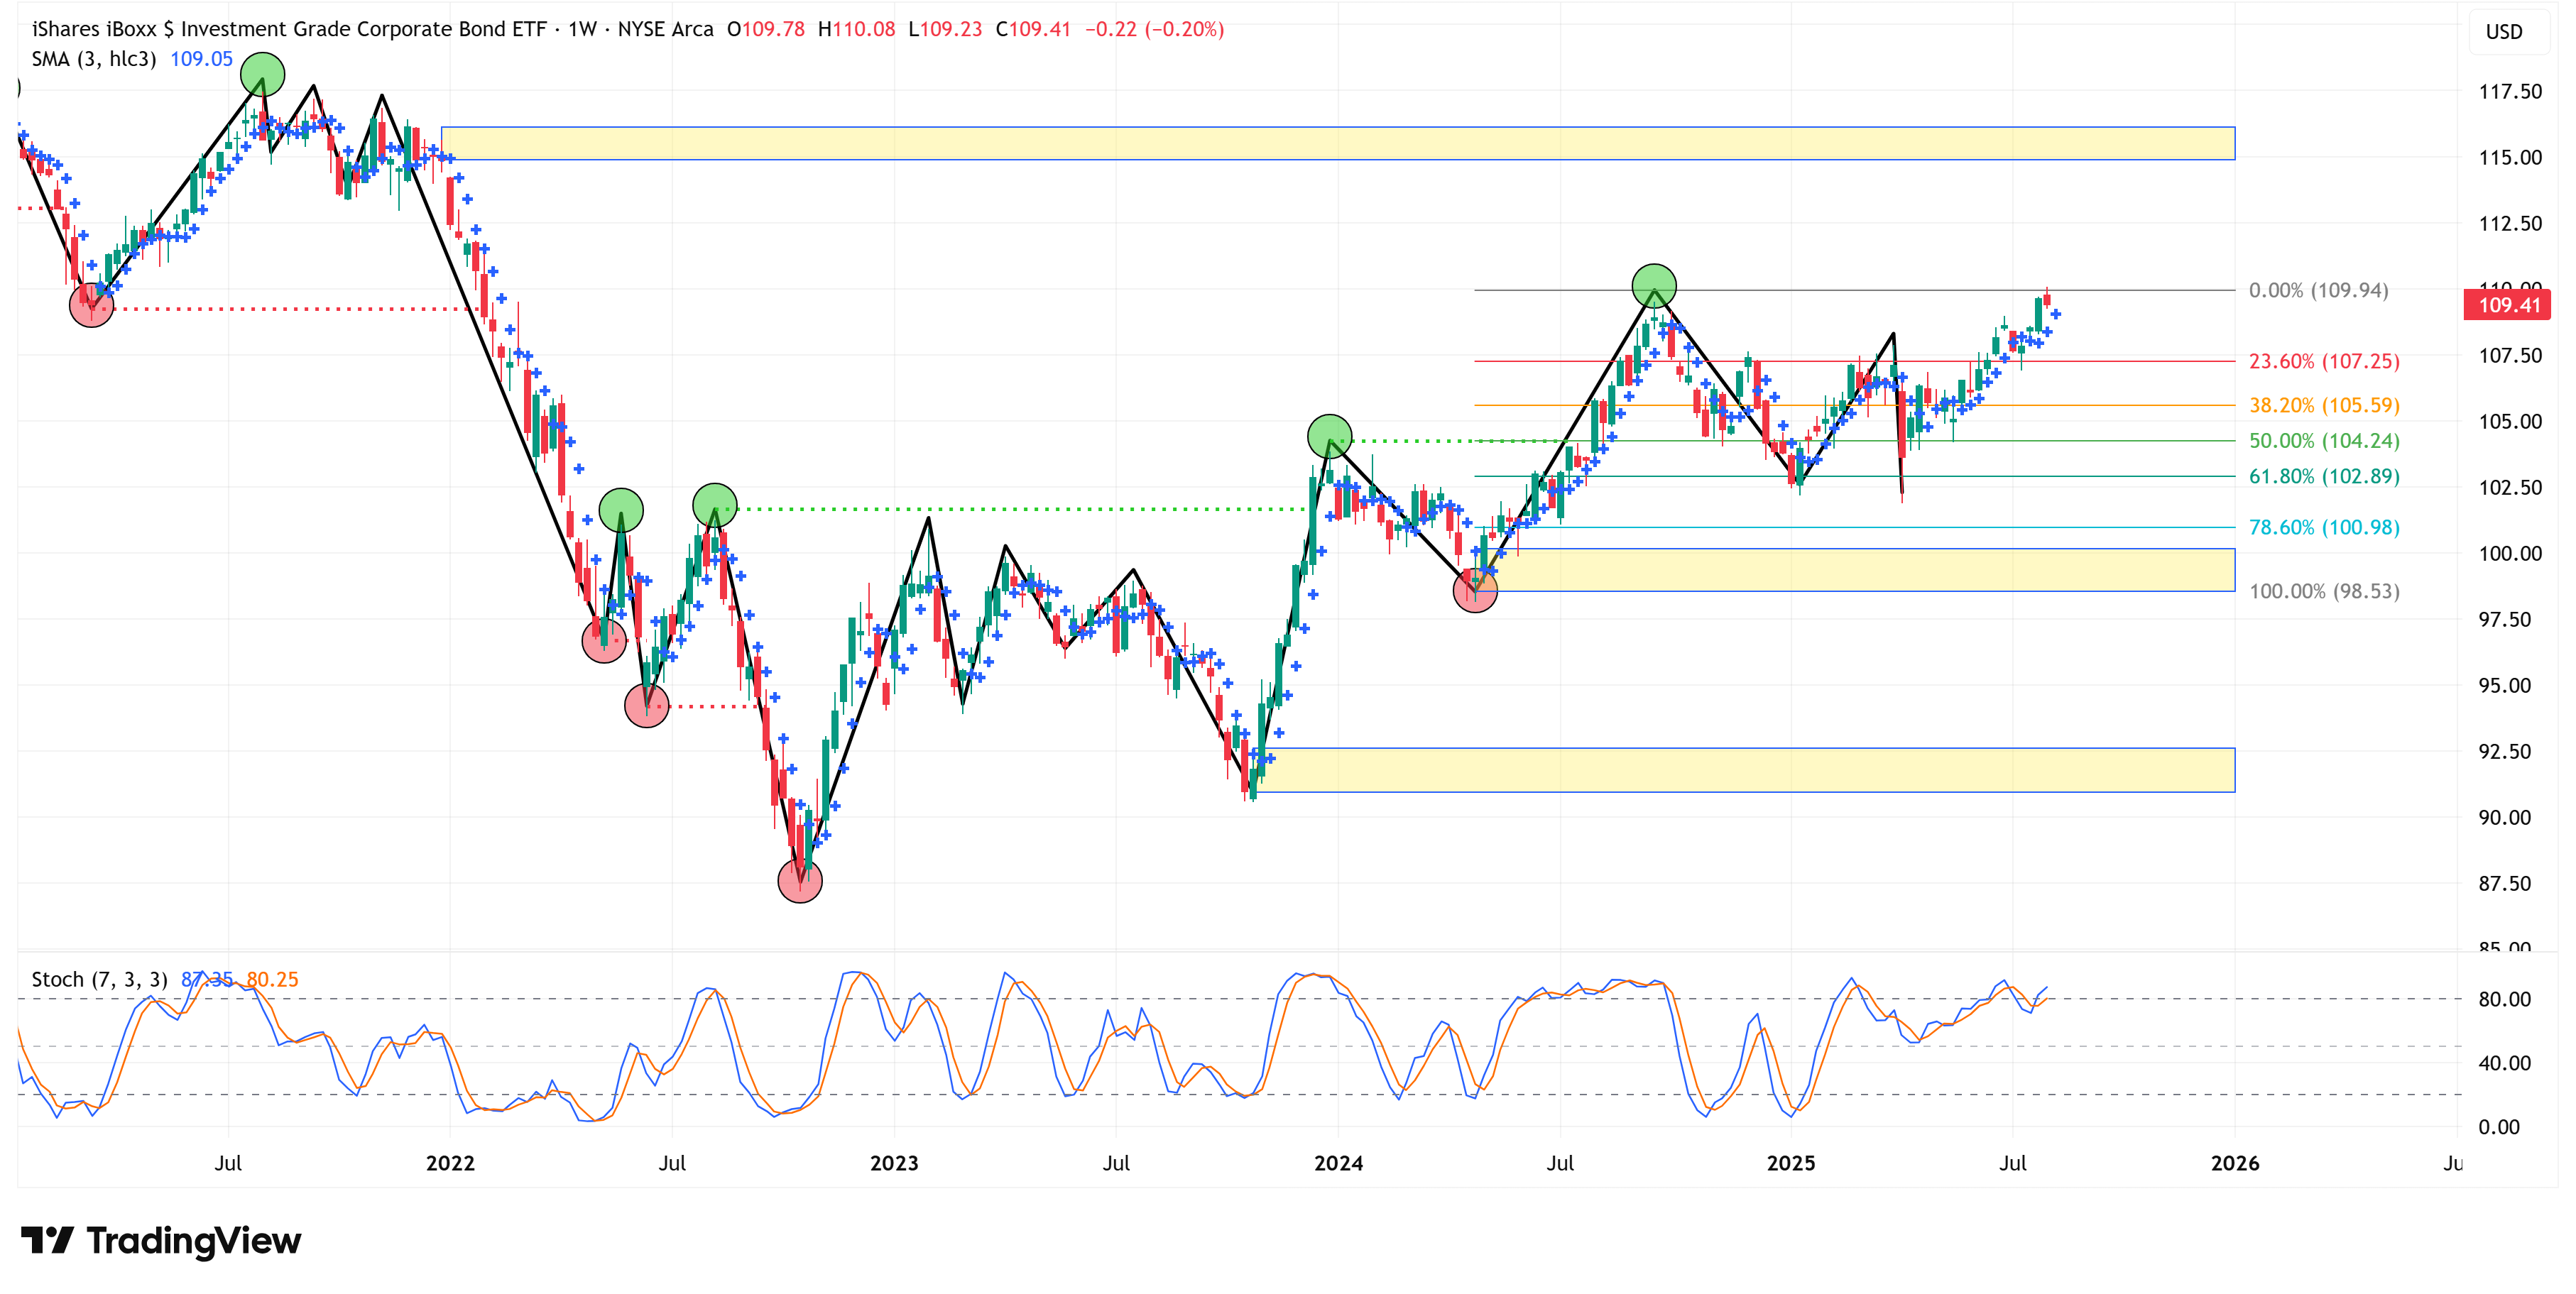
Investment Grade (LQD)
📈 Trend = ⬆️ / 🎯 Target = 109.94 / 🛑 Stop Loss = 98.53
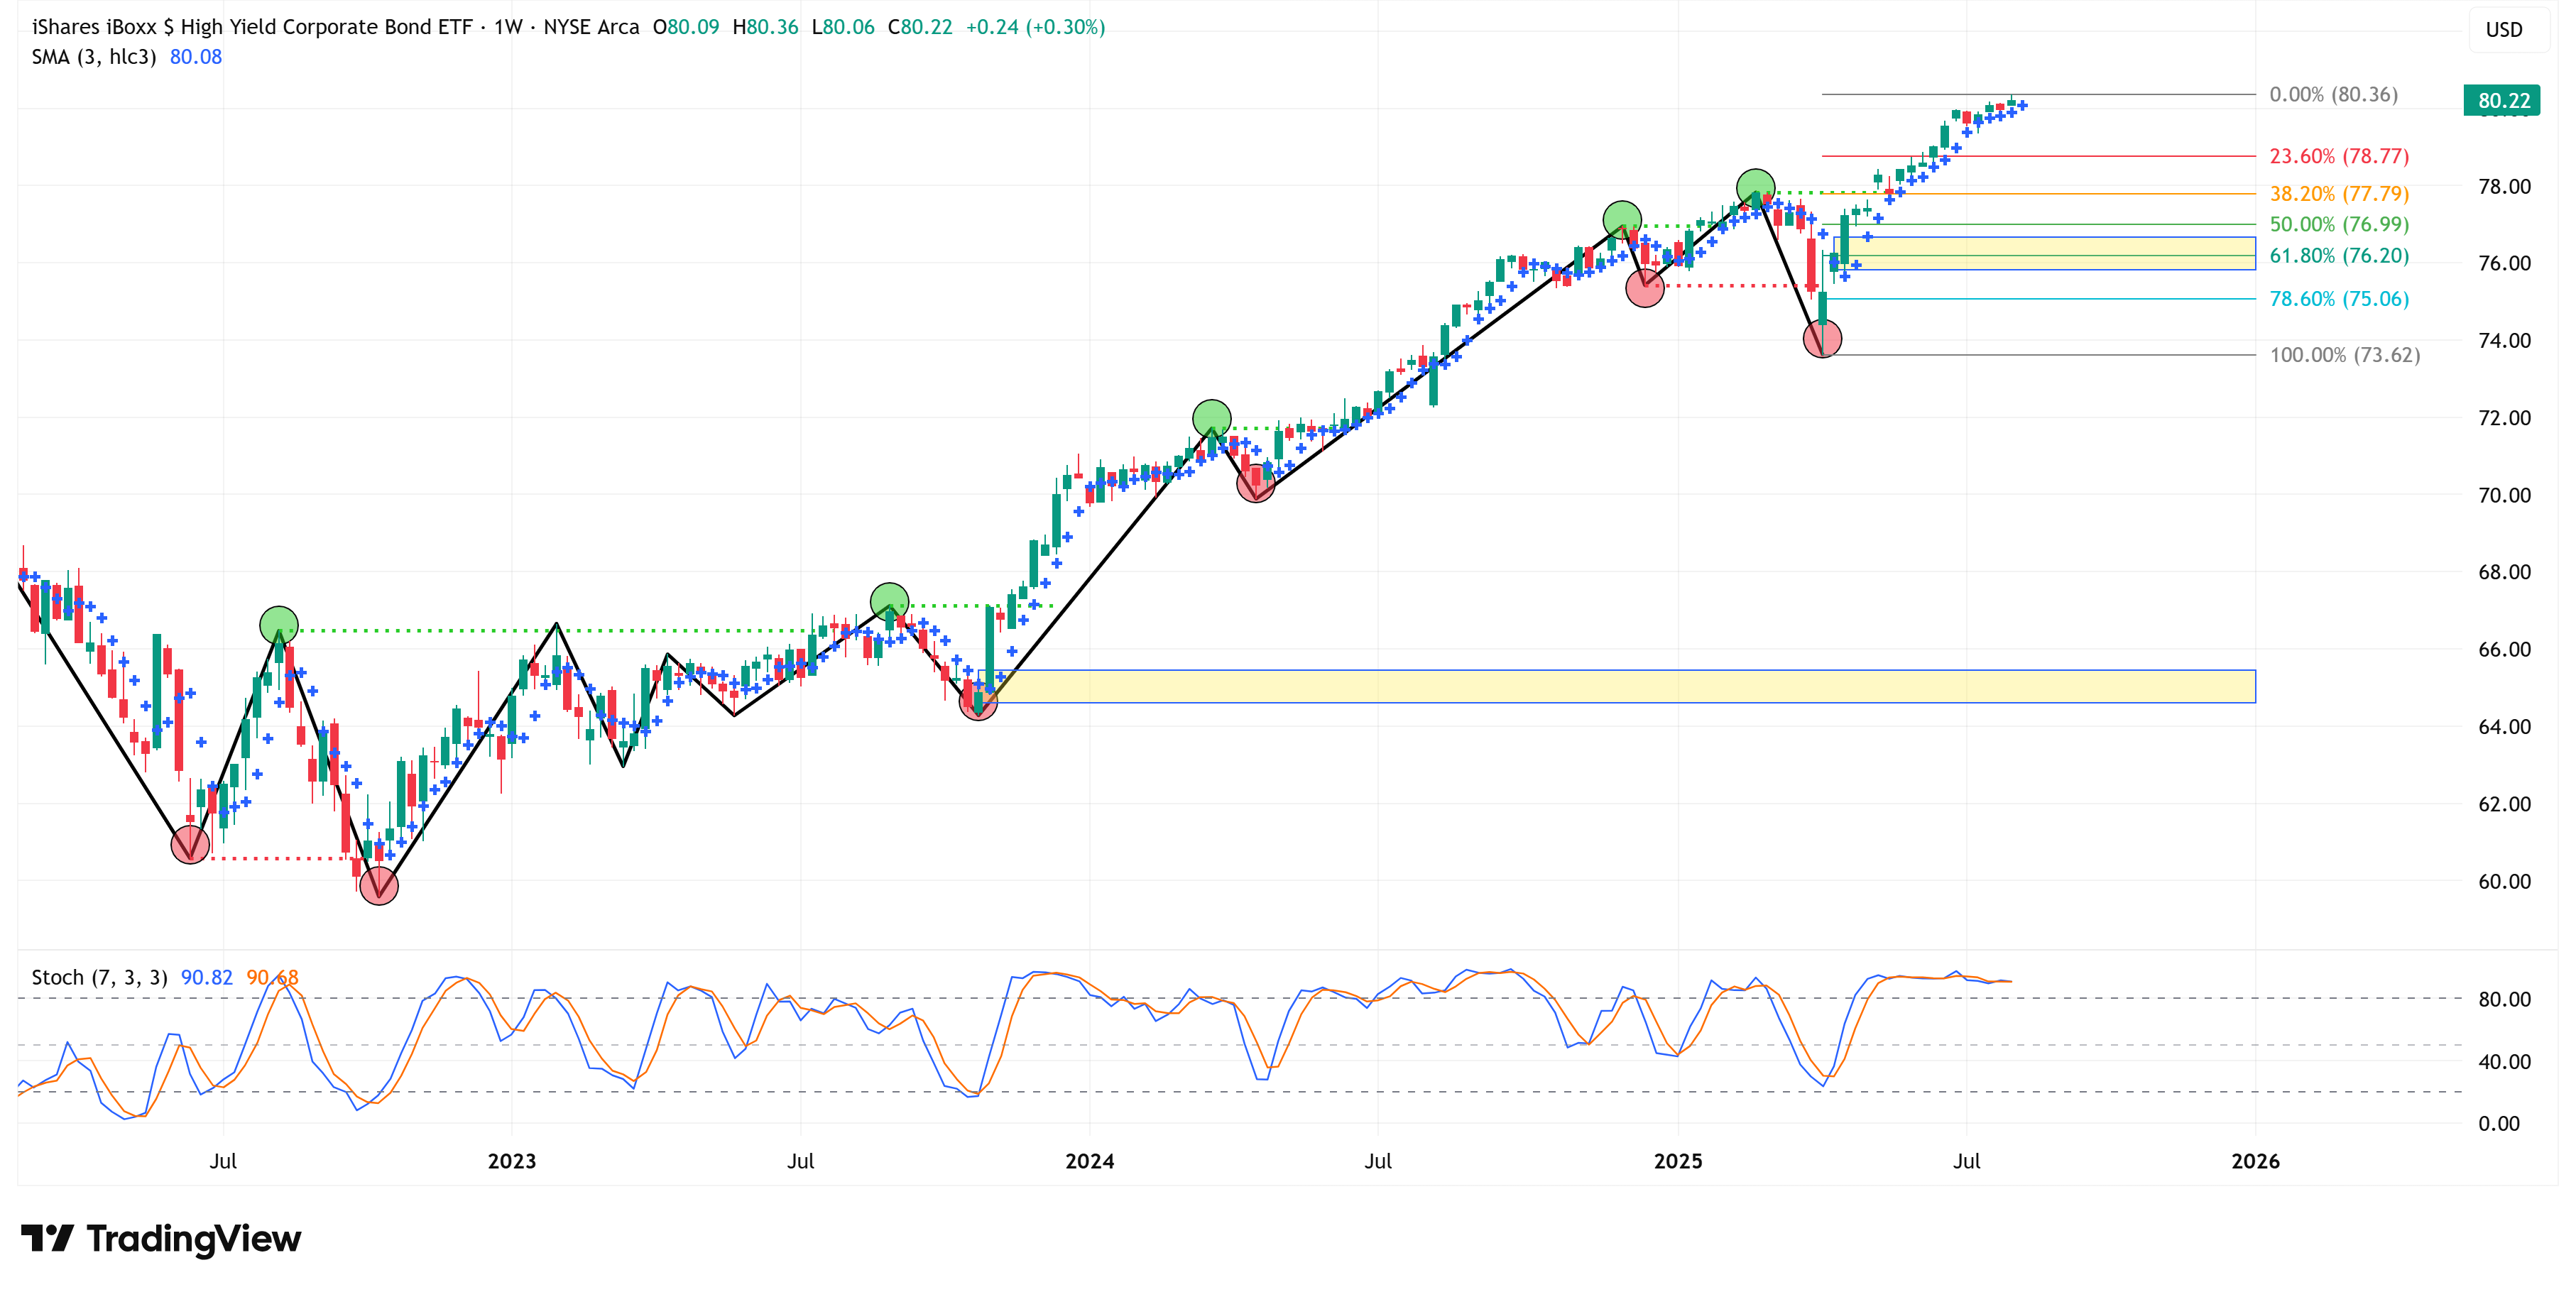
High Yield (HYG)
📈 Trend = ⬆️ / 🎯 Target = 80.36 / 🛑 Stop Loss = 73.62
Thank you, as always, for your continued support of this newsletter!
Let’s make it a great week!
Take care,
Jim Colquitt
Do you have any other feedback you’d like to provide? If so, please feel free to reply to this email and let me know! I read and respond to every email, and I value your opinion!
The Weekly Chart Review is a publication of Skillman Grove Research LLC.
All opinions and views expressed herein are based on our judgments as of the date of writing and are subject to change at any time.
The content of this newsletter is for educational purposes only and should not be construed as investment advice.
Investing involves risk, including loss of principal, and past performance may not be indicative of future results.
Do your research and, where appropriate, seek the advice and counsel of a reputable financial advisor.
Matthew 6:33