Weekly Chart Review
Technology pulled back last week...history would suggest it could be a multi-week event...
Happy Monday!
Last week, the S&P 500 declined by -1.42% while 10 of the 11 sectors were lower for the week. The only sector to eke out a gain last week was Health Care which increased by +0.25%.
I led last week by asking the question:
“Is this the week Technology corrects?”
Technology was lower for the week but it was far from the worst performer. The bookends for the week were Health Care at +0.25% and Real Estate at -3.94%.
Absolute / Relative Value Charts
From an absolute value standpoint, we continue to see a large cluster of sectors and the S&P 500 in the upper right “Expensive & Overbought” quadrant.
The S&P 500, Communication Services, and Technology all remain greater than +2.0 standard deviations to the overbought side with Consumer Discretionary knocking on the door.
From a relative value standpoint, we continue to see a bifurcation between Technology, which appears to be on an island all by itself at +2.34 standard deviations, and Real Estate, Utilities, and Consumer Staples which are all below -2.0 standard deviations.
As I’ve said a number of times, when we have a true risk-off moment, investors will flock to the defensives which are not only a favorite in market selloffs but are extremely “Cheap & Oversold” currently on a relative basis.
The Charts
Let’s take a quick look at the charts for the S&P 500 Index and each sector.
S&P 500 Index
If you’re a bull, you have to be hoping for a continuation of the green parallel channel at the top right of the chart. At worst, you’re hoping the red parallel channel becomes a bull flag pattern that declines for a few weeks before launching higher again.
If you’re a bear, you will need to see the S&P 500 decline down and through both the green and red parallel channels. With that said, watch for support at 4,134 and at the neckline. You’ll know the bears are in charge if there is a sustained break below the neckline.
Technology
Last week I highlighted the fact that the RSI (lower panel) had reached a similar point where in the past it was a signal that it was about to start moving lower. Sure enough, the same thing happened this time.
The key question now is will this be a 3 or 4 week move lower similar to the first two highlighted areas (red vertical lines) or is this the beginning of something more substantial similar to the third highlighted area on the chart?
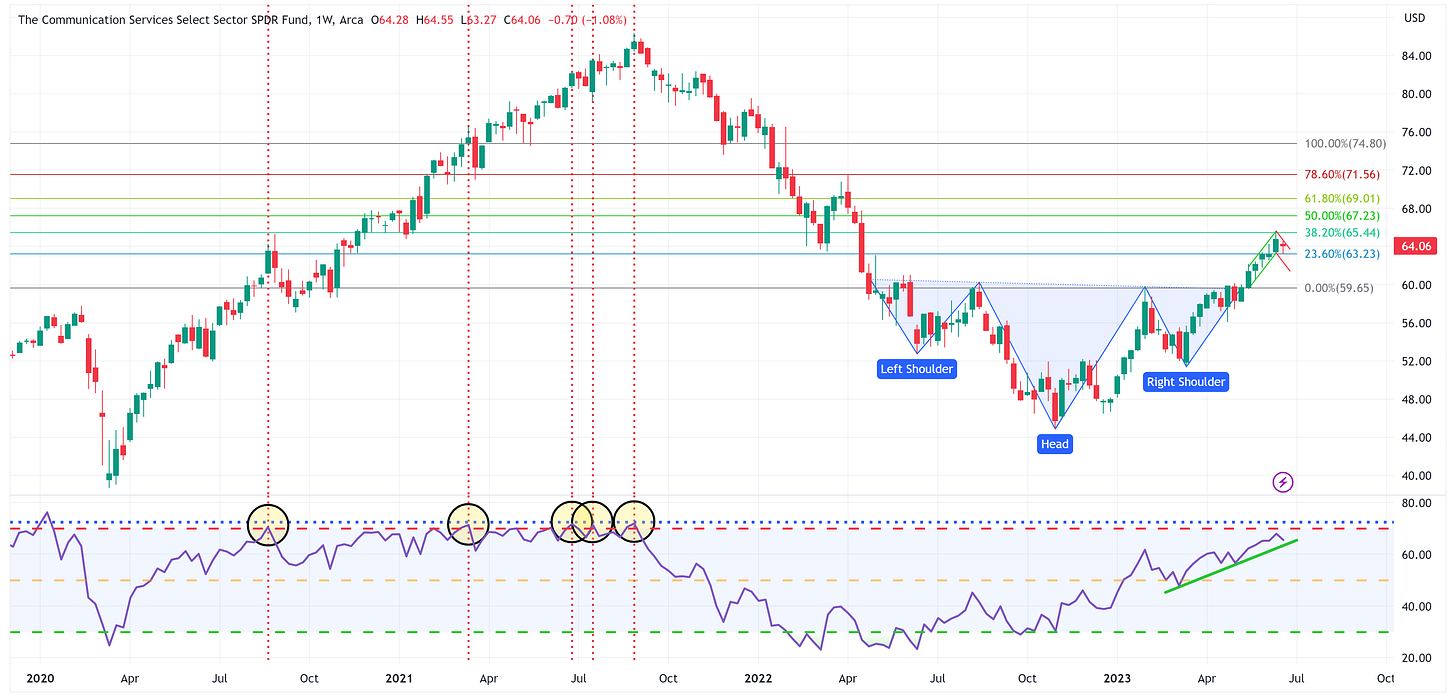
Communication Services
XLC has a similar structure to the S&P 500 whereby if you’re a bull, you have to hope this is just a quick bull flag and a move onward and upward from here. In support of that case, note how last week’s price action respected the 23.6% Fibonacci level. If we see a break below 63.23, the next level of support is around 59.65.
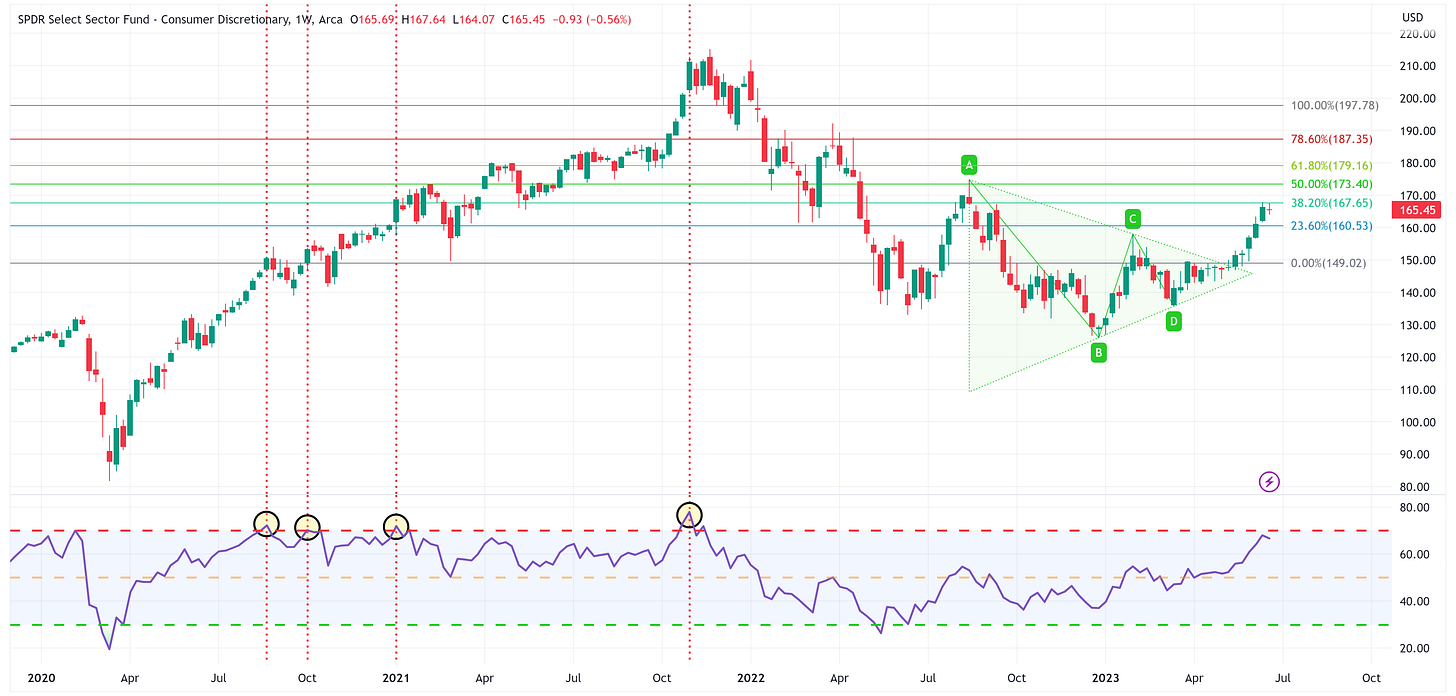
Consumer Discretionary
Note that XLY has now run into resistance two weeks in a row at exactly the 38.2% Fibonacci level. For the move to extend higher, it has to be able to break through this level (167.65) on its way to the next level of resistance at 173.40. Alternatively, look for 160.53 and 149.02 to provide support.
Industrials
The Industrials continue to look interesting here from a technical standpoint. We have an inverse Head & Shoulders (H&S) pattern in place and last week tested the neckline while the RSI still has room to run. That said, we will want to see this week’s price action close above the neckline for the continued possibility of a move higher.
Energy
Energy continues to look vulnerable here. We have a H&S pattern in place and we’ve broken through the neckline. If the downtrend continues, the target is 55.28 with the next level of support at 73.70 along the way. For the H&S pattern to be negated, we need to close above the neckline and have it become support in the subsequent weeks.
Materials
Similar to Industrials, Materials could have some potential here. With that said, it has to clear the neckline of the H&S pattern and remain above it in the subsequent weeks. Look for the neckline or somewhere around 82.66 to provide resistance on the way up.
Financials
Last week, I was a bit more constructive on the potential for Financials but I’m seeing it in a different light this week as I think we could be in the process of forming a H&S pattern. We need to watch the RSI support (green line) and see how Financials react once they come in contact with the perceived neckline.
Real Estate
Similar to Financials, I am beginning to see Real Estate through the lens of a possible H&S pattern developing. While it is not confirmed at this point, let’s make sure to watch the RSI support (green line) and how Real Estate acts once it comes in contact with the perceived neckline.
Health Care
Health Care continues to show signs of life, especially as it was the only sector to log a positive week last week. We need to continue to watch and see how it navigates the symmetrical triangle that has developed. A break to the high side calls for a target somewhere in the neighborhood of 150.15.
Utilities
Utilities had a tough week last week. We need to continue to watch the RSI support (green line) and how Utilities navigate the lower portion of the triangle that has formed. Recall that Utilities are one of the most oversold sectors on a relative basis and tend to be a more defensive play if the market continues to move lower as a whole.
Consumer Staples
Similar to Utilities, Consumer Staples is one of the most oversold sectors on a relative basis a favorite defensive play if the market continues lower. It also seems that we are developing an inverse H&S pattern which could suggest Consumer Staples has room to run. Again, watch the RSI support (green line) and how Consumer Staples react once coming in contact with the perceived neckline.
Summary
We saw pullback almost across the board last week with regard to the S&P 500 and then underlying sectors. Year-to-date, the market has been held up almost exclusively by the Technology sector. As noted in the above charts, history would suggest that the pullback we saw in Technology last week may end up being a 3 or 4 week event and if so, my sense is that a lot of the rest of the market will move lower with it. Watch for the defensive sectors to be a beacon of relative safety if that happens.
Until next week…


