

Hey everyone, it’s Jim.
I hope you had a great weekend and that your Summer is off to a great start!
Let’s jump right into this week’s newsletter.
In this week’s newsletter:
Stay Informed
Key Macro Events From Last Week (ICYMI)
Key Macro Events To Watch This Week
The Market Map
Application - S&P 500
Deep Dive
TACO Trade + “No More Mr. Nice Guy…”
S&P 500 Fair Value Model
The Market Map - Extended Analysis
Major US Indices
11 Major US Equity Sectors
US Treasuries
Stay Informed
Key Macro Events From Last Week (ICYMI)
Here’s a brief recap of the major U.S. financial and economic news releases for May 26–30, 2025.
📉 Durable Goods Orders (April 2025)
New orders for durable goods fell by 6.3% in April—the largest decline since January 2024—primarily due to a 17.1% drop in transportation equipment.
Excluding transportation, orders edged up 0.2%, indicating underlying demand remained stable. (Link)
🧠 Consumer Confidence (May 2025)
The Conference Board’s Consumer Confidence Index rebounded to 98.0 in May from 85.7 in April, ending a five-month decline.
The improvement was attributed to a temporary easing of U.S.-China trade tensions, though concerns about tariffs persisted. (Link)
📝 FOMC Minutes (May 6–7, 2025)
The Federal Reserve maintained interest rates, citing significant uncertainty due to unpredictable trade policies and their potential impact on inflation and employment.
Officials expressed concern that tariffs could simultaneously elevate inflation and suppress growth, complicating monetary policy decisions. (Link)
📉 GDP – Q1 2025 (Second Estimate)
The U.S. economy contracted by 0.2% in Q1 2025, slightly better than the initial 0.3% estimate, marking the first decline in three years.
The downturn was driven by a surge in imports ahead of anticipated tariffs, which widened the trade deficit and offset modest consumer spending growth. (Link)
💸 Core PCE Inflation (April 2025)
Core Personal Consumption Expenditures (PCE) inflation slowed to 2.5% year-over-year in April, down from 2.7% in March.
This deceleration suggests that inflationary pressures are easing, despite recent tariff-related price increases. (Link)
🔍 Additional Noteworthy Developments
Goldman Sachs anticipates that the recent inflation uptick due to tariffs will be temporary, projecting core PCE inflation to reach 3.6% by year-end before stabilizing.
Despite positive economic indicators, escalating U.S.-China trade tensions continue to overshadow economic optimism, with potential tariff increases posing risks to stability. (Link)
Key Macro Events To Watch This Week
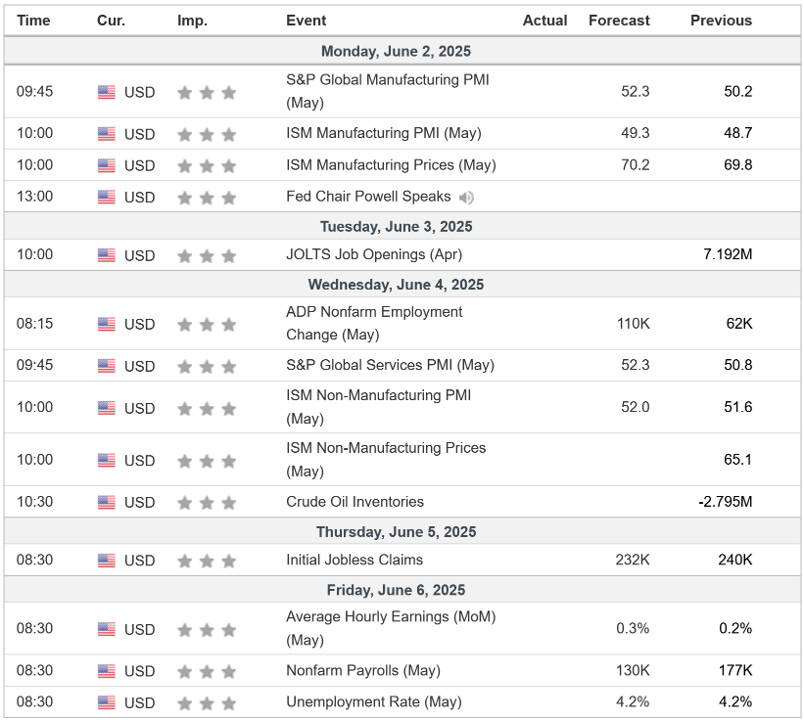
The first week of the month brings the release of nonfarm payrolls and the unemployment rate. These will be the key economic releases this week.
With that said, keep an eye on what Fed Chairman Powell may or may not say in his speech later today. Recall that he had a meeting with President Trump last week, and we know that Trump desires lower interest rates.
The Market Map - Application - S&P 500
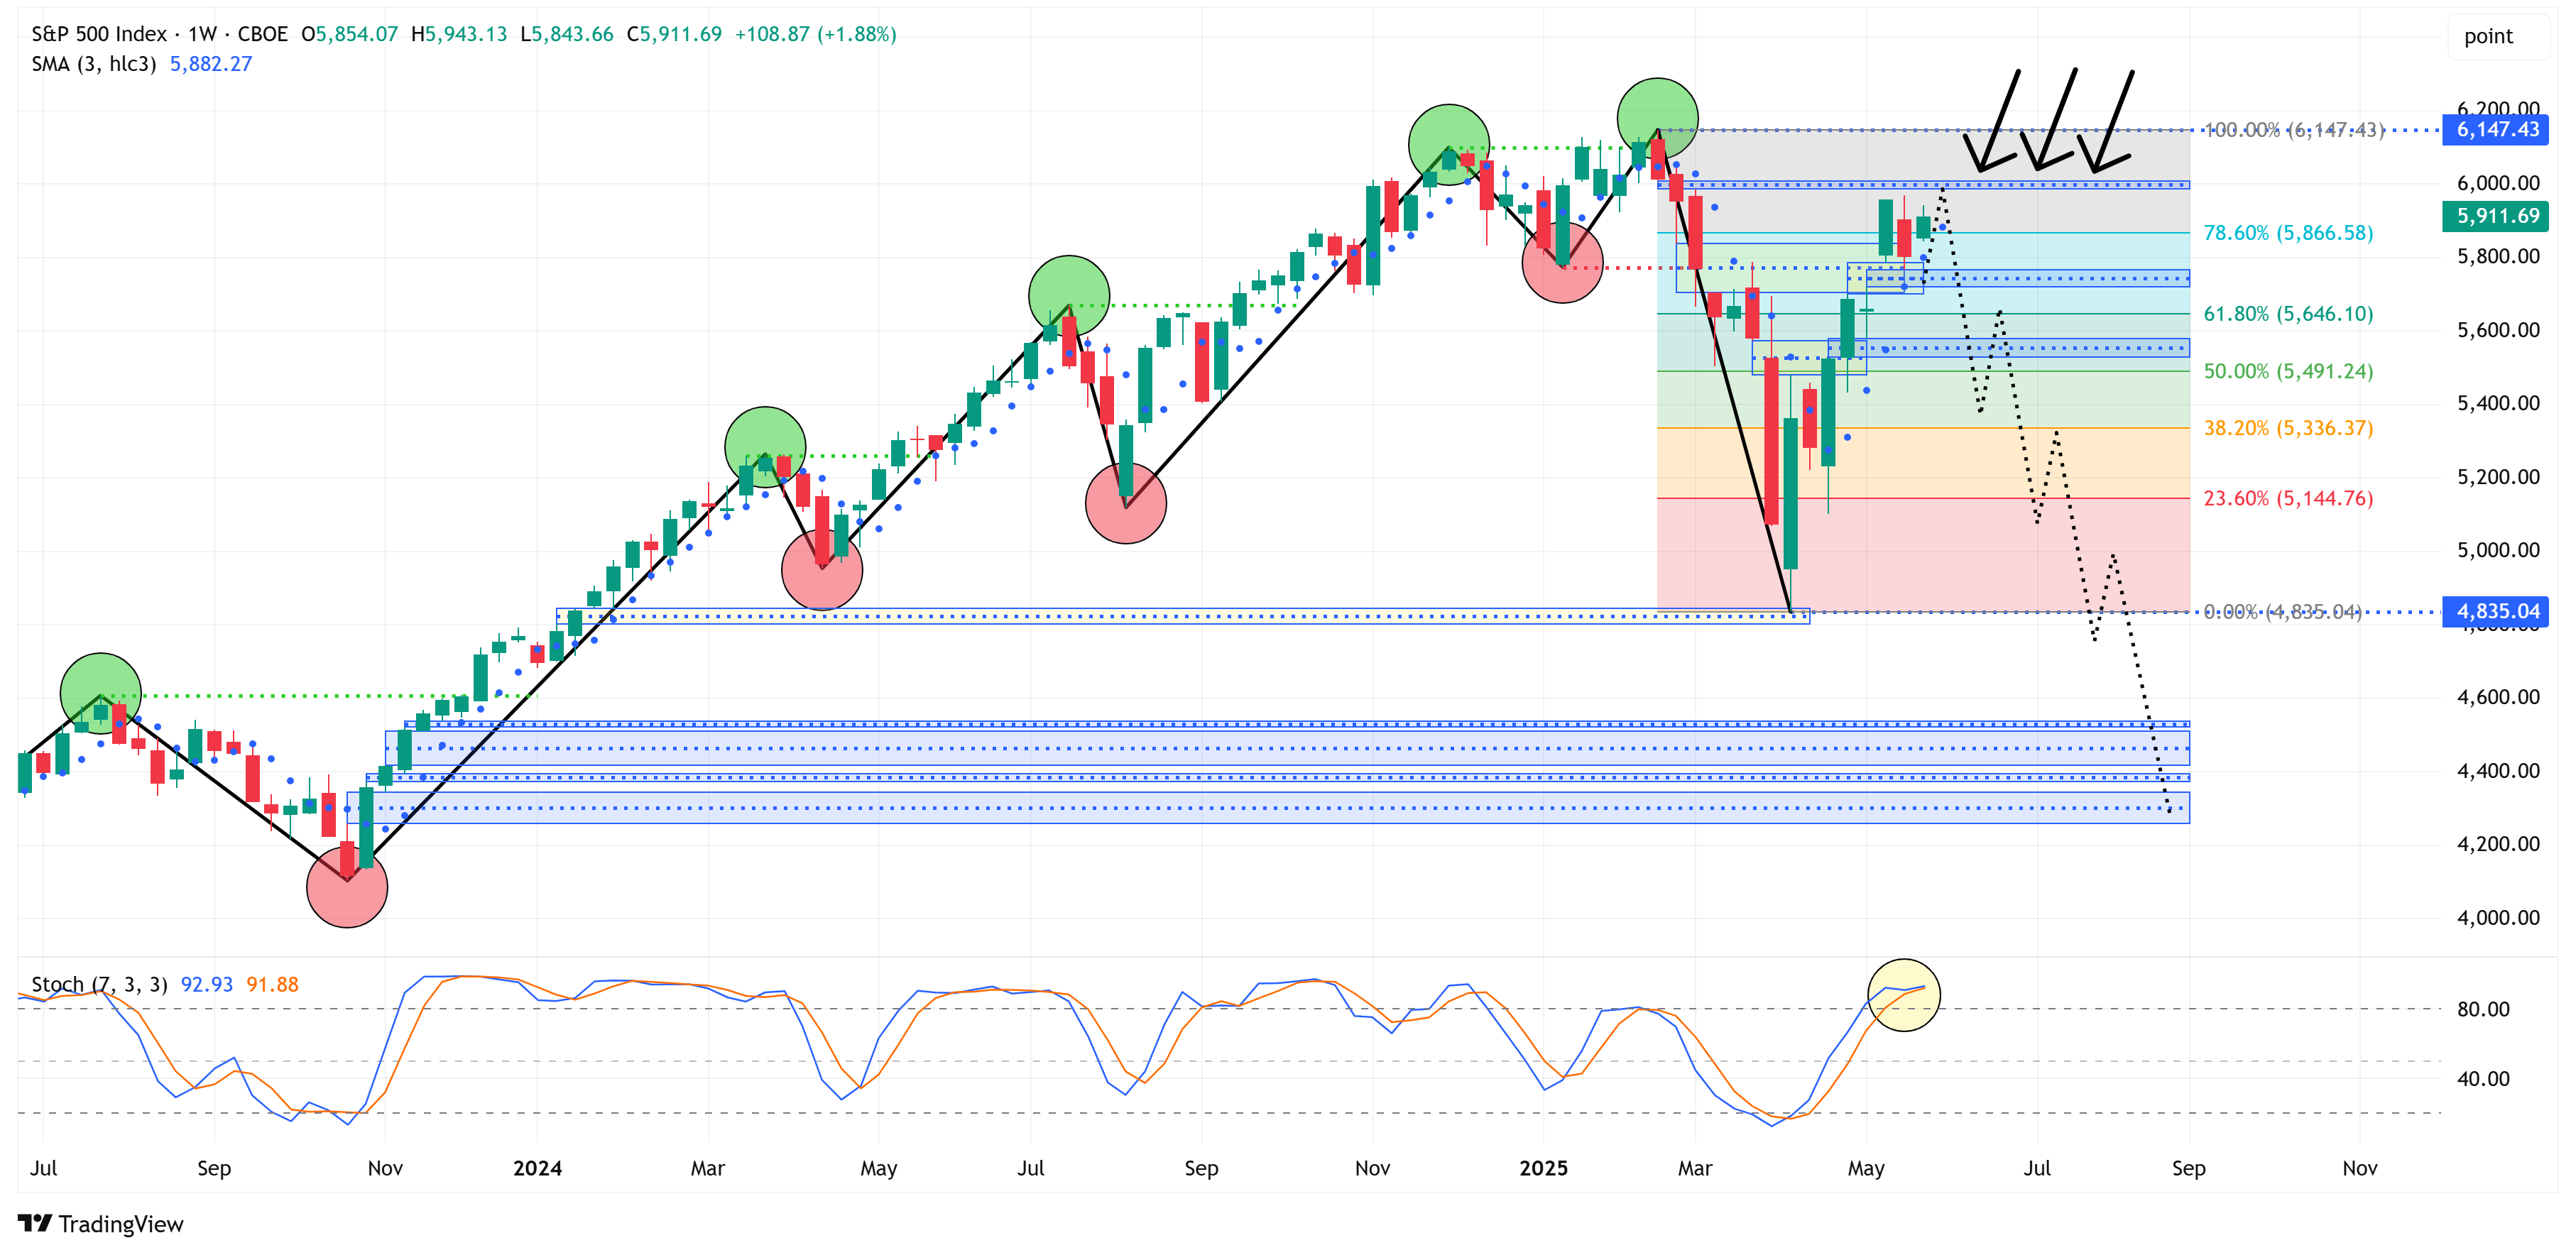
The S&P 500 returned +1.88% last week; however, it remains in a technical downtrend according to our work.
Note: A weekly close above 6,147.43 would shift our work to bullish.
Last week, I made the following two statements, which remain true this week:
“Using the chart below as a reference, I believe there is a reasonable chance that the market rallies to close the unfilled gap above current prices (denoted by the black arrows: 5,986 - 6,009) or possibly slightly higher, before heading lower.”
“Further, if we look at the stochastic indicator in the bottom panel (see yellow highlighted circle), it would suggest that the market is a) overbought and b) appearing (though not confirmed) as though it may want to transition lower.”
From a technical standpoint, not much changed on the weekly chart from last week.
Let’s see if our lower time frame (the 4-hour chart) gives us any clues.
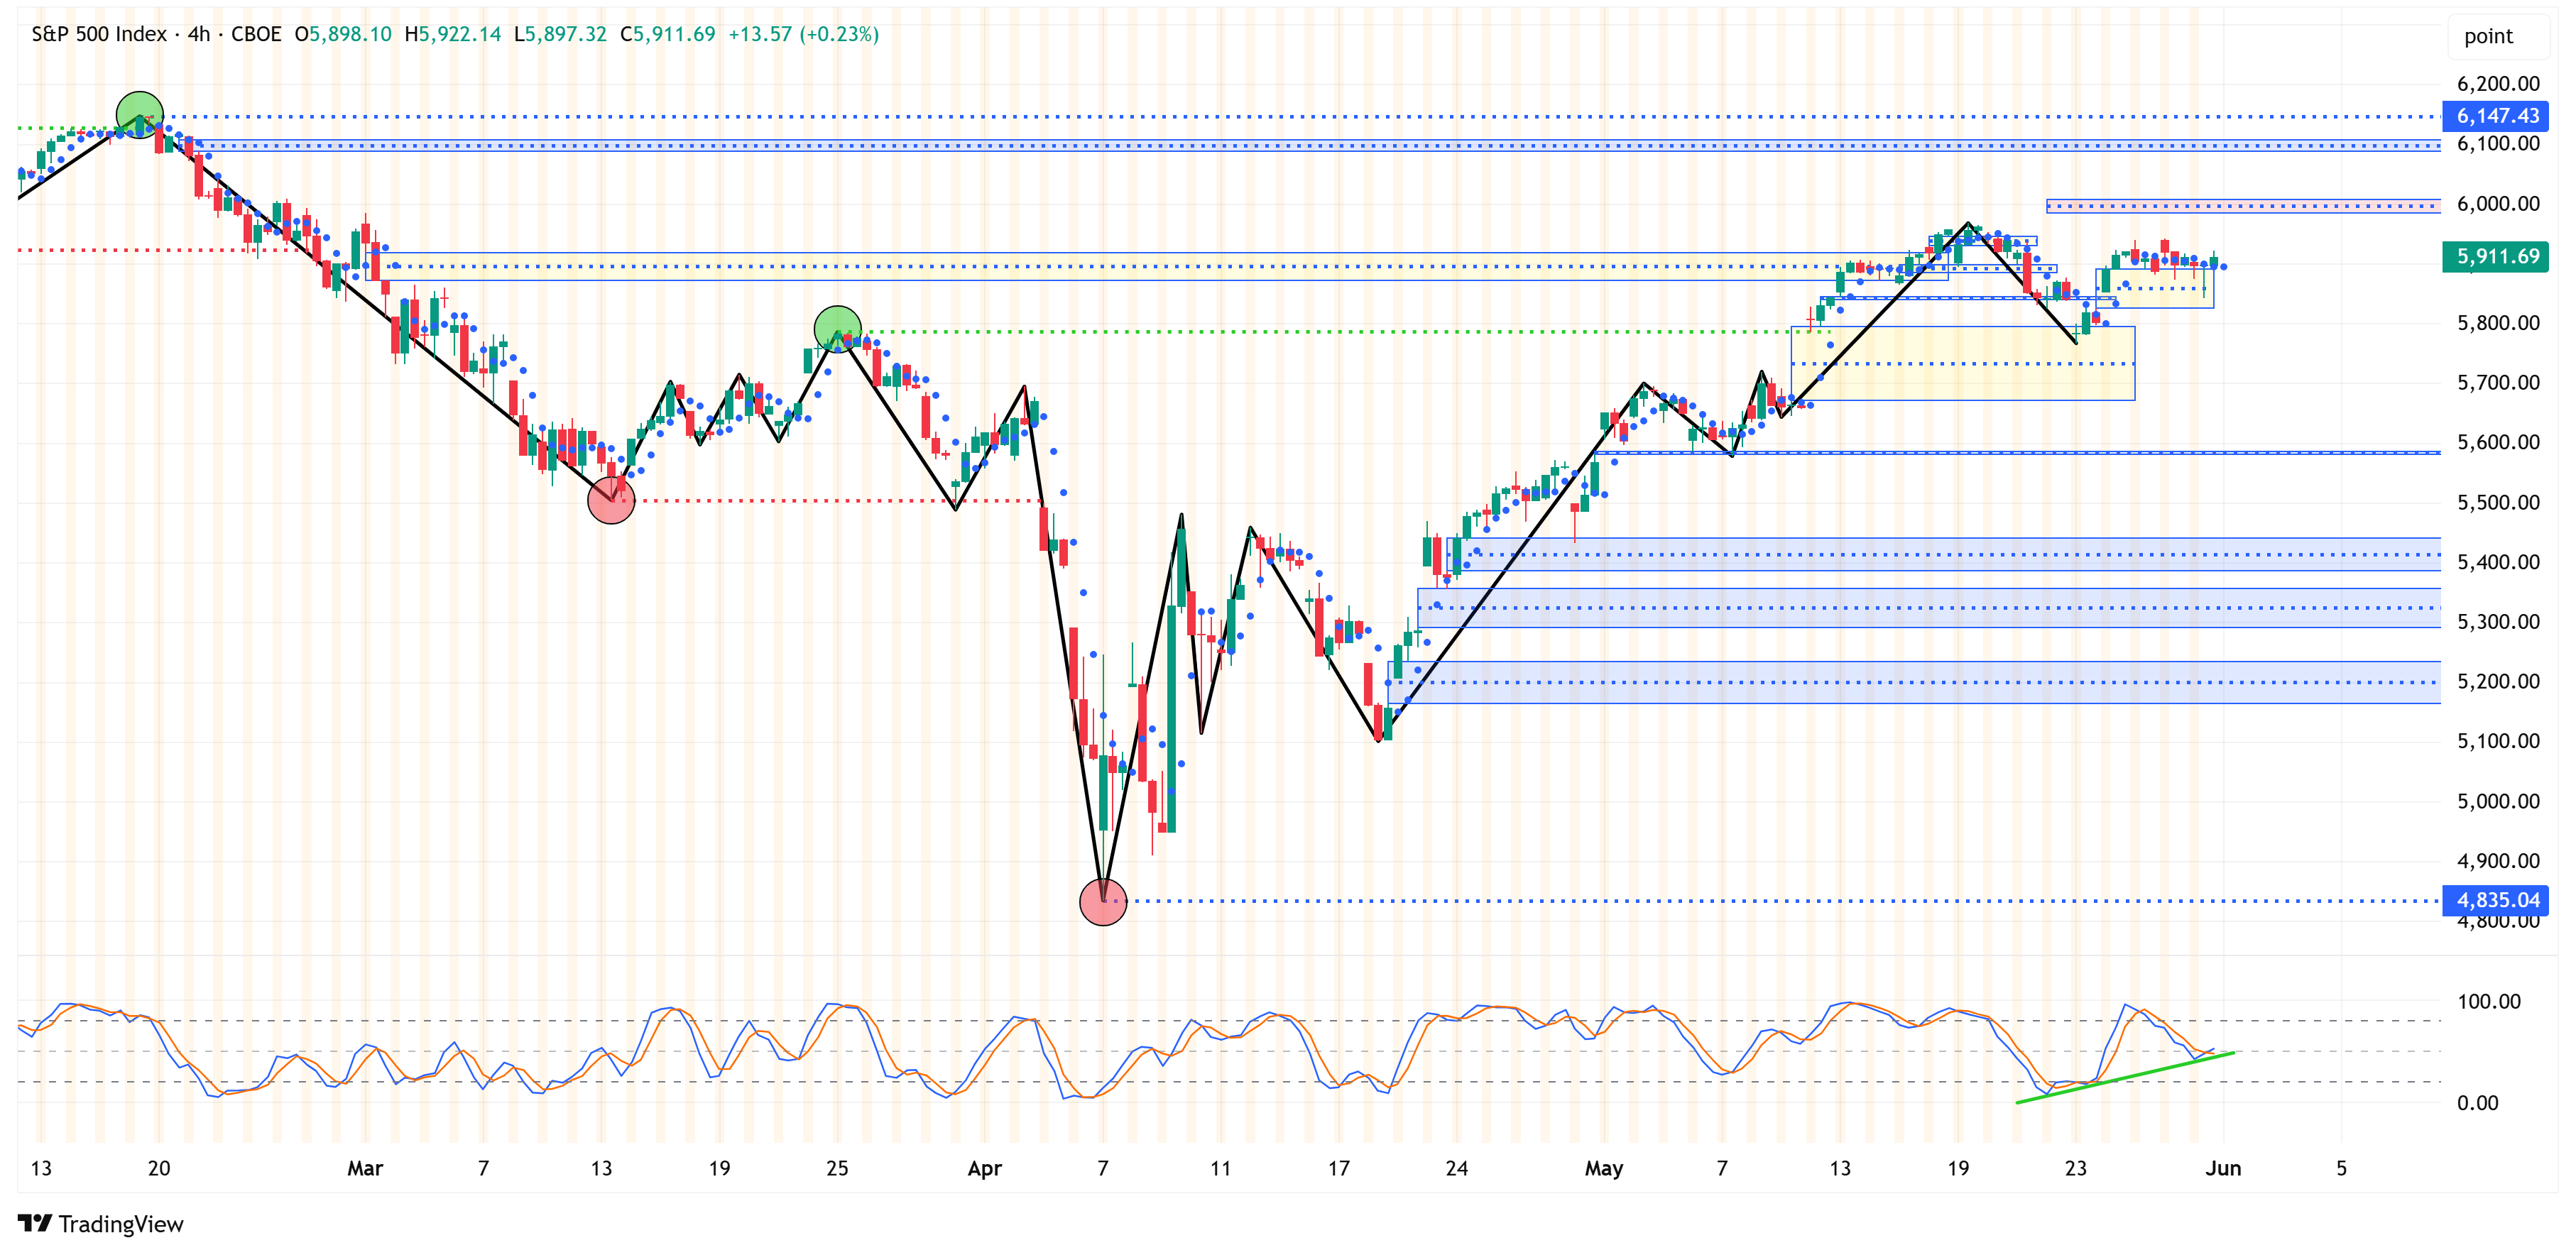
Here again, not much of a change from last week.
The lower time frame remains bullish, thus suggesting that we could see a final push higher to close the overhead gaps before heading lower.
Deep Dive
TACO Trade + “No More Mr. Nice Guy…”
Last week, the term “TACO Trade” was coined by Financial Times columnist Robert Armstrong.
The phrase stands for Trump Always Chickens Out and is a reference to Trump’s on-again, off-again tariff policies.
The suggestion was made that many on Wall Street are buying companies whose share prices fall in response to tariff announcements, knowing that “Trump Always Chickens Out,” and said companies will rebound once Trump relents on his initial tariff proclamation.
Trump was agitated at the suggestion when confronted by it and made the following statement:
“I chicken out? I’ve never heard that,” he said. “Don’t ever say what you said,” he told the reporter. “That’s a nasty question. To me, that’s the nastiest question.”
Fast forward a couple of days, and Trump makes the following post on Truth Social:
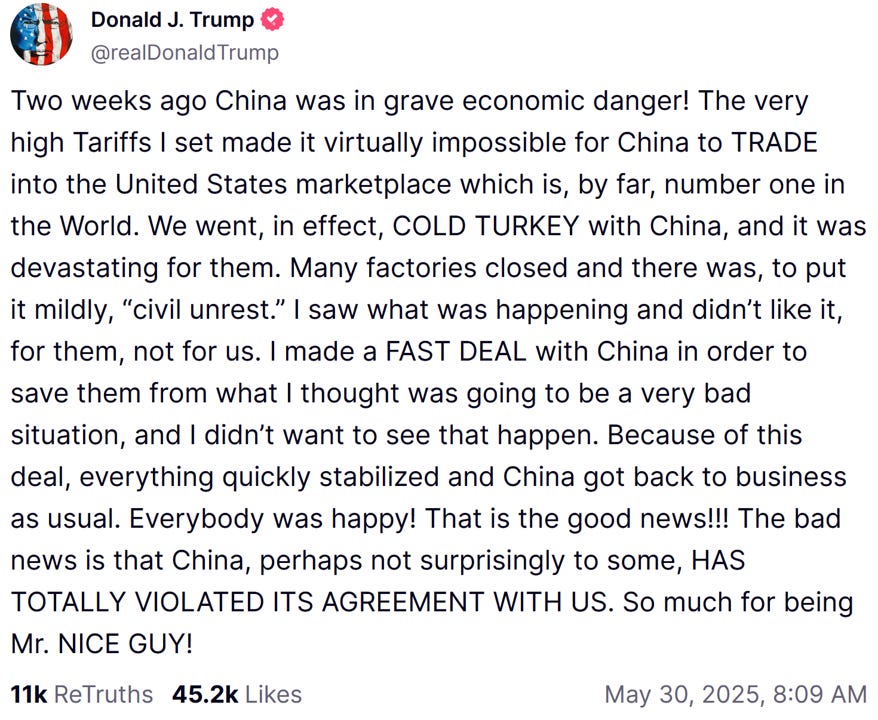
I think the last line is key: “So much for being Mr. NICE GUY!”
Is it possible that this is a reactive behavioral response from Trump to the “TACO Trade” comment?
The idea being that Trump hears about the “TACO Trade” and then suddenly announces a tougher stance on China, not because of long-term strategy, but as a reaction to the criticism.
We’ll never know the answer to this, but even if there is a remote chance that the “TACO Trade” got in Trump’s head, all else being equal, do you think that tilts Trump towards easier or tougher negotiations/tariffs going forward? I have to believe it is the latter.
Full disclosure, I voted for Trump and in general, I support his policies (Note: I wish he would act more Presidential at times), but let’s be honest with ourselves, he’s a narcissist who will do anything to save face and boost his ego even if it means changing a policy to appear to take a tougher stance.
Most analysts out there pride themselves on fundamental analysis, technical analysis, or some combination of the two. This year has been extraordinarily unique in the degree to which politics has shaped the narrative and the sentiment. Now, it appears that we may need to handicap for face-saving actions by the President.
Put it all together, and this is a difficult task. That’s why I am a big believer in creating and using a more systematic approach like the approach we use with “The Market Map”.
This systematic approach removes emotion and provides specific price targets and stops for any asset class on any time frame.
I hope you’ll explore some of the lessons I’ve prepared on this topic (Lesson #1, Lesson #2, Lesson #3, Lesson #4), and if you become a paid subscriber, you’ll be able to see this analysis put into action beyond just the S&P 500 chart at the top of the newsletter.
The sections that follow are for paid subscribers only.
In these sections, we will discuss our proprietary:
S&P 500 Fair Value Model
This model provides a guide for a) how far the S&P 500 could decline in the next recession and b) when to get back into the market after it has declined.
“The Market Map” - Systematic Process
We will call out specific price objectives (up trends vs. down trends, targets, stop losses, etc.) on the following:
Major US Indices
11 Major US Equity Sectors
US Treasuries
Subscribe today and take advantage of our “15% off for life” sale!
Keep reading with a 7-day free trial
Subscribe to Skillman Grove Research to keep reading this post and get 7 days of free access to the full post archives.