Weekly Chart Review
A negative week last week may create a positive multi-week run for the S&P 500...
Happy Monday!
Let’s dive right in.
We’ll start, as usual, with our absolute value and relative value charts.
Absolute Value
Like last week, we continue to see a large cluster of sectors, and the S&P 500 Index itself, in the upper-right “Expensive & Overbought” quadrant. It is worth noting that three sectors (Communication Services, Technology, and Consumer Discretionary) and the S&P 500 Index, are not only in the “Expensive & Overbought” quadrant but are also beyond +2.0 standard deviations.
Here we have the same data, just a different look.
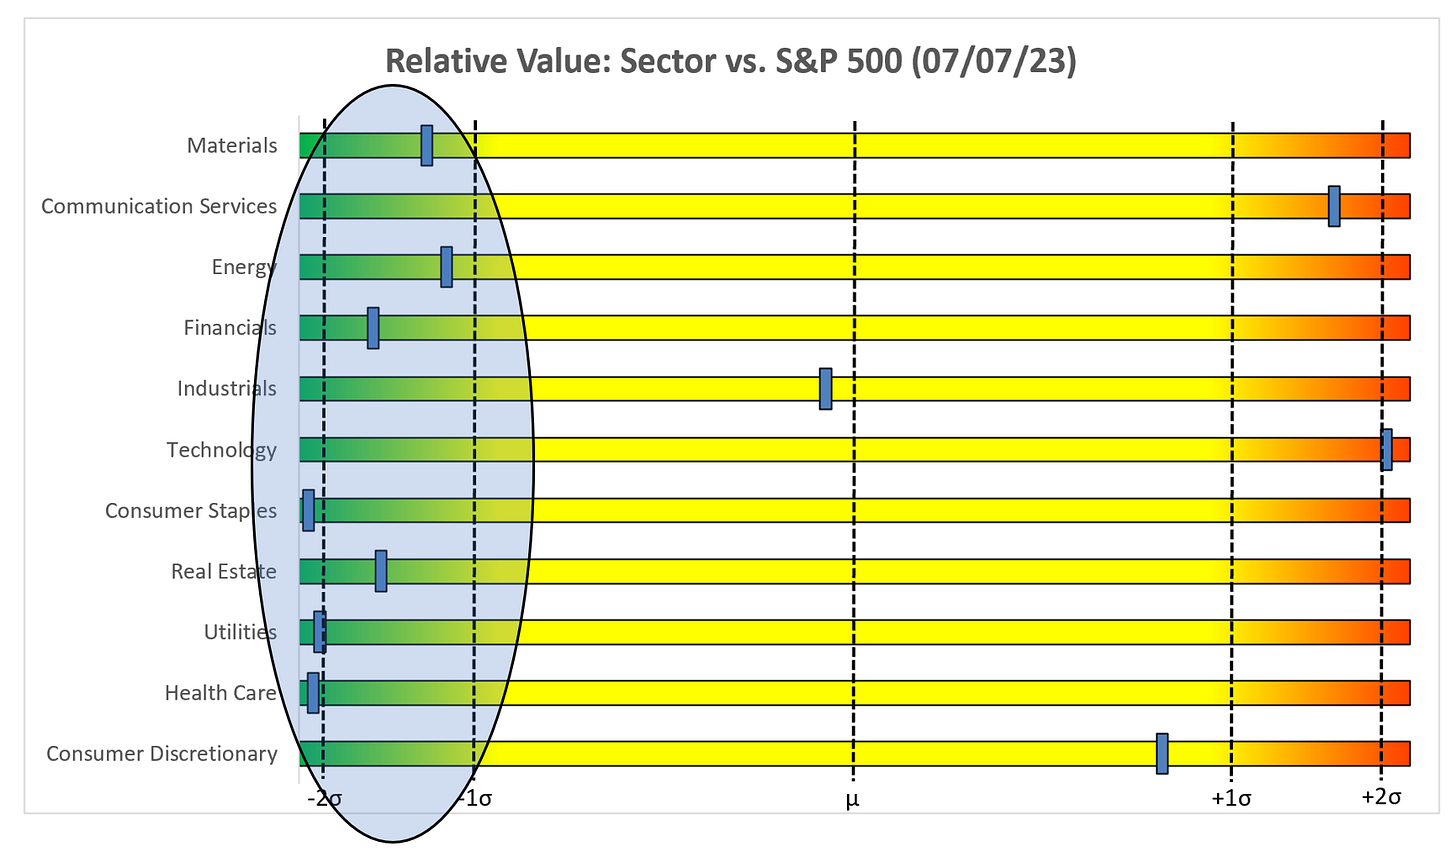
Relative Value
I say it every week, but it continues to be the Technology show this entire year. If Technology turns, it could be problematic for the rest of the market (Note: we’ll explore this idea further later in this week’s post.) In the interim, note that we’ve got a cluster of sectors firmly planted in the “Cheap & Oversold” quadrant with the three historically most “defensive” sectors (Utilities, Health Care, and Consumer Staples) beyond the -2.0 standard deviation threshold.
Here we have the same data, just a different look.
S&P 500 Index
Last week, I discussed the fact that the S&P 500 Index had formed a “bullish engulfing” candle on the weekly chart.
I went on to make the following observation:
“I have highlighted with yellow price bars, the eight bullish engulfing patterns the S&P 500 has had since 2020.
It is interesting to note that in three of the instances (red circles), the bullish engulfing candle was followed by a down week (i.e. a red candle) only to shake off that down week and continue to ramp higher.
Alternatively, in four of the instances (green circles), the bullish engulfing candle was followed by an up week (i.e. a green candle) only the find the S&P 500 decline rather significantly in the weeks directly following the green candle.”
Below is the updated chart for this previous week.
The S&P 500 fell by -1.16% last week, thus creating a “red candle”. If the above analysis holds, this would suggest that the S&P 500 may continue to march higher from here. This would mean that our inverse Head & Shoulders (H&S) pattern is still in play and maybe more importantly, that the inverse H&S target of 4,927 is still in play.
What about rates?
There was a lot of talk last week about the UST 10Yr breaking out of the channel that it has been in since late last year. Some are suggesting that this means rates are going to continue to move higher.
I don’t disagree with the thesis, but I believe the UST 10Yr has to clear the 4.09% threshold which has been a critical level several times in the past (see yellow circles).
If the UST 10Yr does clear the 4.09% threshold, from a technical standpoint, the target becomes 4.93% and this may have a negative impact on equities, and in particular, the Technology sector.
Technology (XLK) vs. UST 10 Year
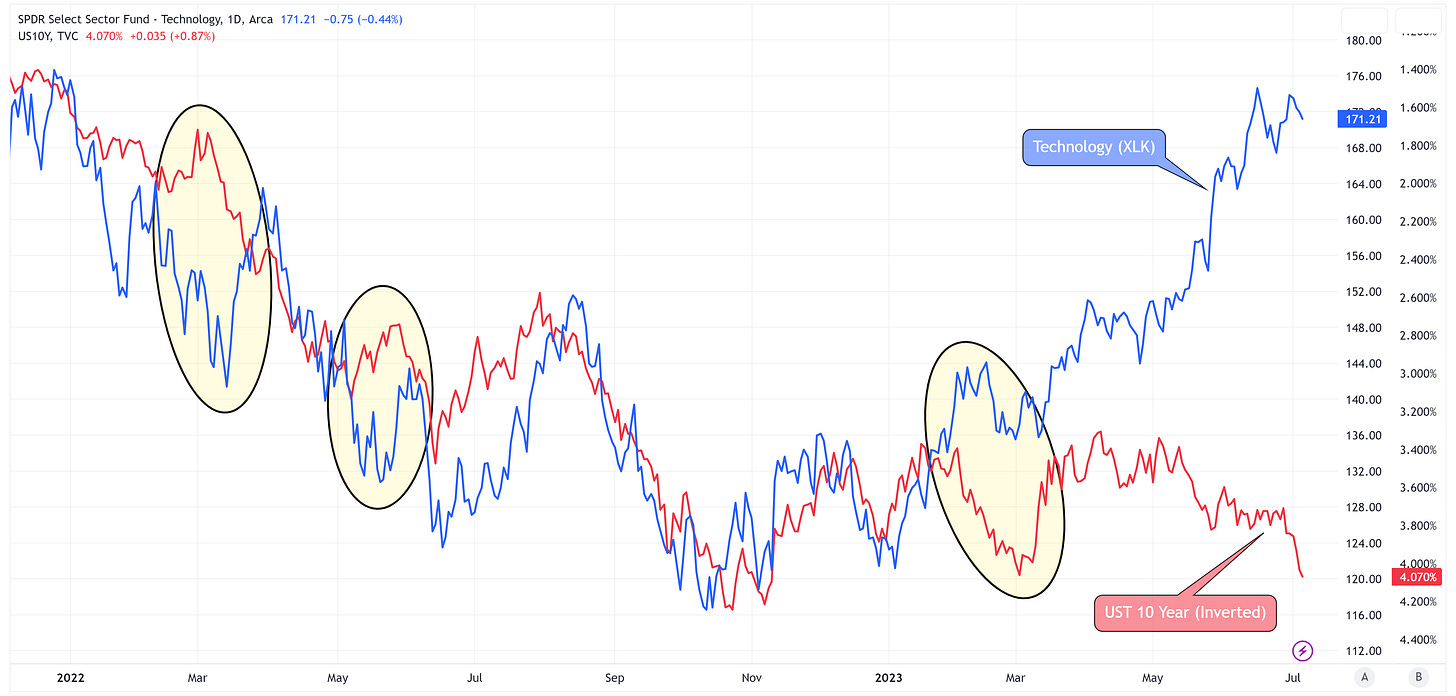
Here is a chart of the Technology sector (XLK) vs. the UST 10 Year (values have been inverted) since the beginning of 2022.
Note that for most of this time frame, the two have tracked quite nicely. However, on several occasions, the two have deviated. The deviation typically doesn’t last very long and usually corrects itself by meeting somewhere in the middle.
The key question is who moves first and how far? Earlier this year, it was Technology that made the first move. Will that happen again?
This matters because Technology has carried the S&P 500 this year. If that starts to break, it will negatively impact multiple sectors and the market as a whole.
Now let’s turn our attention to the sectors as we take a quick spin through each of the charts.
Technology
A down week for the sector but structurally, nothing wrong with the chart. With that said, see the above note regarding Technology vs. rates and note that the RSI remains elevated and we’re pushing all-time highs from late 2021. Lastly, don’t forget that Technology remains well beyond +2.0 standard deviations on both the absolute and relative value charts.
Communication Services
Communication Services continues to find resistance right around the 38.2% Fib level (65.44) but on the positive side, the inverse H&S remains in play with a target of 74.80 and there is still a modest amount of room to run from an RSI standpoint.
Consumer Discretionary
A modest down week for Consumer Discretionary last week but nothing overly alarming. With that said, the week prior, XLY was just short of the 70 threshold on the RSI and it fell last week just a bit. Is it possible that XLY has one final push higher to move above the 70 threshold on the RSI before moving lower? Let’s see what happens this week.
Industrials
Industrials were down just over -1.00% last week but up almost +4.00% the week prior with a massive bullish engulfing candle. Inverse H&S remains in place, RSI has room to run, this might be a sector to watch in the coming weeks if it can clear its previous high from January 2022 of 107.88.
Energy
Energy has spent the last several weeks flirting with the neckline of the Head & Shoulders pattern. The H&S pattern will be negated if XLE clears the right shoulder which is a value of 87.74. With that said, note that the RSI remains in a downtrend and continues to move lower off of resistance (red line).
Watch rates for what may happen next with Energy. If rates continue to move higher, this suggests that the FOMC is going to continue to increase rates and they will likely be doing so because they do not believe inflation is sufficiently contained. In that environment, we could see Energy move higher until demand destruction finally sets in.
Materials
Materials attempted to break through the neckline of the inverse H&S last week but were unable to do so. RSI continues to bounce around in no man’s land. I’d be inclined to sit on the sidelines with Materials until it figures out which way it wants to go.
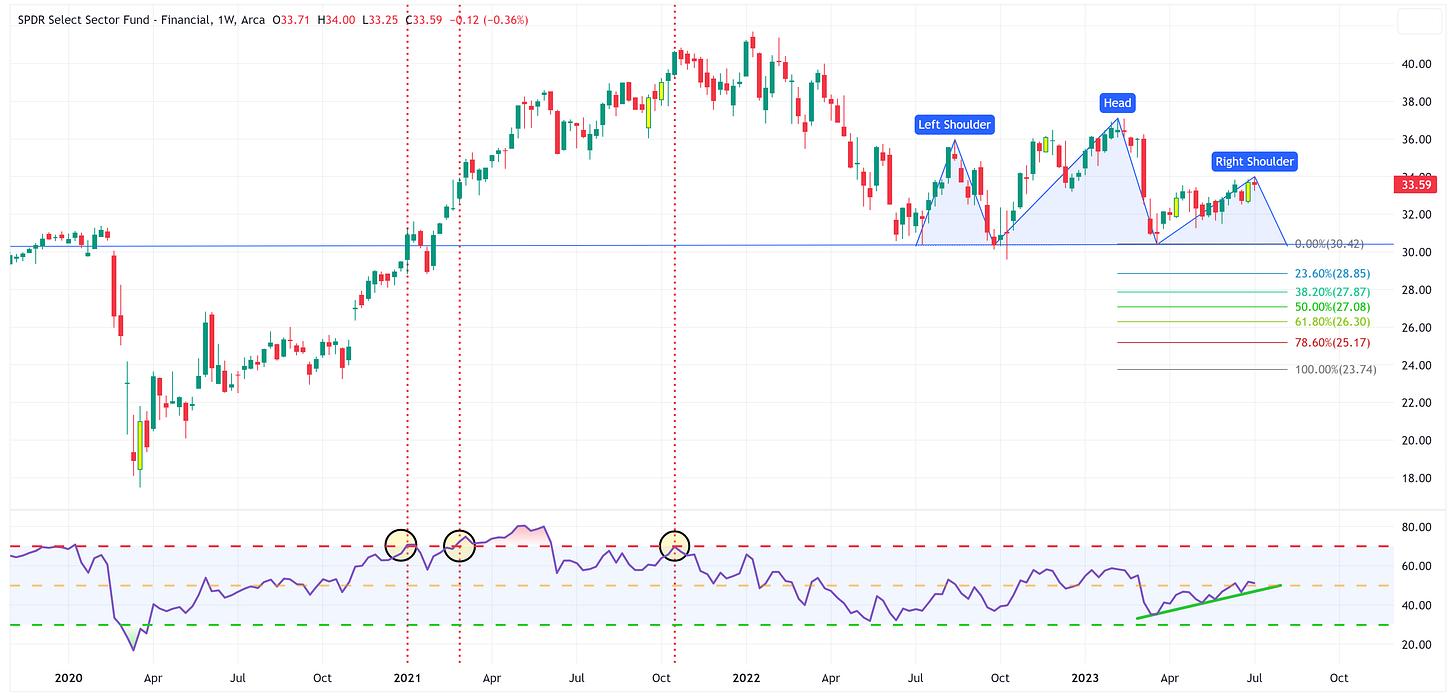
Financials
I hypothesized a couple of weeks ago that Financials could be in the process of forming the right shoulder of a H&S pattern. So far, that has not materialized and the RSI continues to suggest that the move higher may continue.
Real Estate
Similar to Financials, I had previously hypothesized that Real Estate may be in the process of forming the right shoulder of a H&S pattern. So far, that has yet to materialize. On a positive note, XLRE was one of the only sectors to have a positive week last week and it managed to close above the green trend line noted on the chart. These are all positive developments for the sector.
Health Care
Health Care has spent most of this year range bound between the confines set by the symmetrical triangle that has formed. RSI remains on an uptrend but another significant down week, like last week, may break the RSI support we’ve seen (green line). Symmetrical triangles are difficult in that they can break to the high or low side; therefore, we need to sit on our hands for a bit to see which way this breaks. With that said, remember that Health Care tends to be a defensive sector so if we see the overall market start to move lower, Heath Care may find some inflows.
Utilities
Similar to Health Care, Utilities have remained range bound this year and we don’t have a good idea which way it will break (high or low). Also, Utilities fall into the “defensive” category so if we see the market break lower, Utilities could see some inflows.
Consumer Staples
Consumer Staples continues to look like it is in the process of forming an inverse H&S pattern; however, we need to watch the RSI to see if it breaks through support (green line). Similar to Health Care and Utilities, Consumer Staples is considered a “defensive” sector and therefore likely to see positive inflows if the overall market starts to move lower.
Summary
A down week last week for the S&P 500 but per my initial analysis, that could be setting up for a positive multi-week run. The rates move was interesting last week. We need to watch this closely and specifically 4.09% on the UST 10 Year. If 4.09% is breached and subsequently becomes support, we could see a fairly substantial move higher for the UST 10 Year which I believe would be negative for equities.
Until next week…


