In honor of Thanksgiving, this will be an abbreviated newsletter this week.
Inflation Softer Than Expected
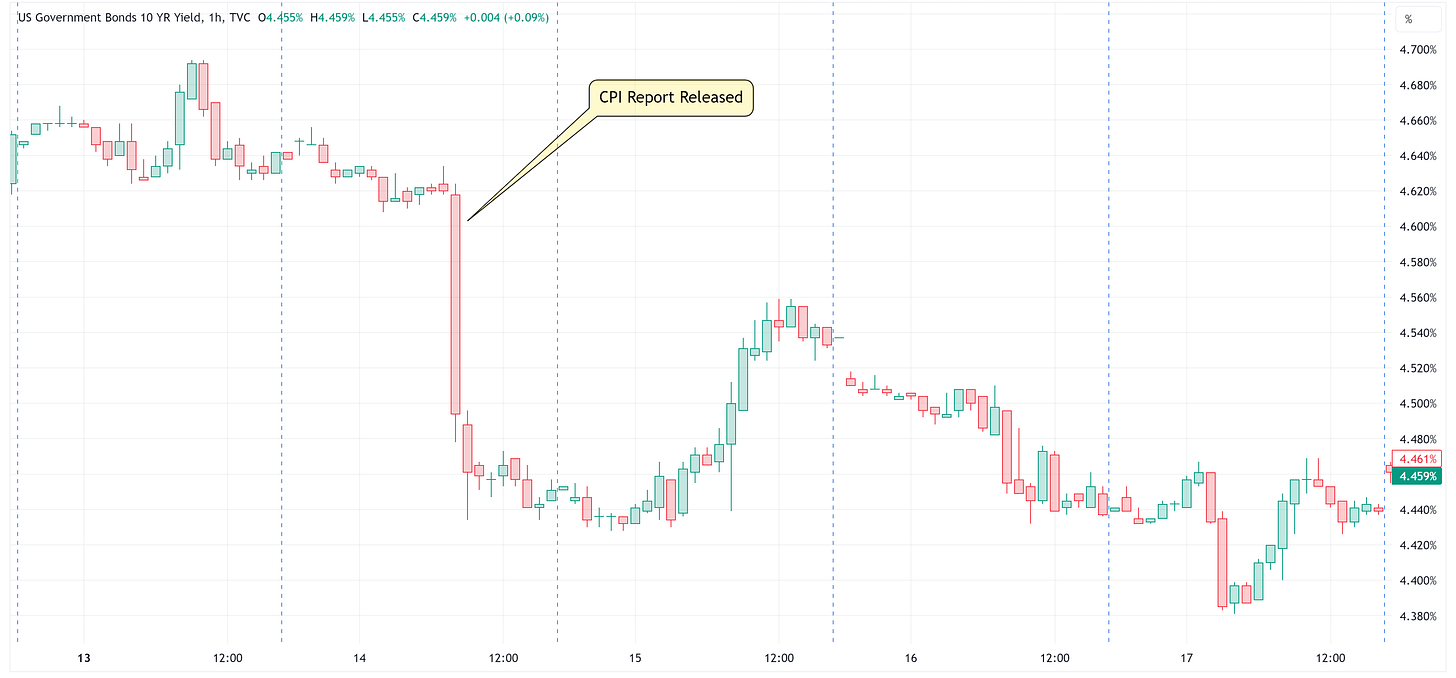
The big news from last week was that the inflation figures (CPI) came in softer than anticipated.
Here is a chart of the US Treasury 10-year yield. I probably didn’t need to insert the caption to point out when the CPI report was released.
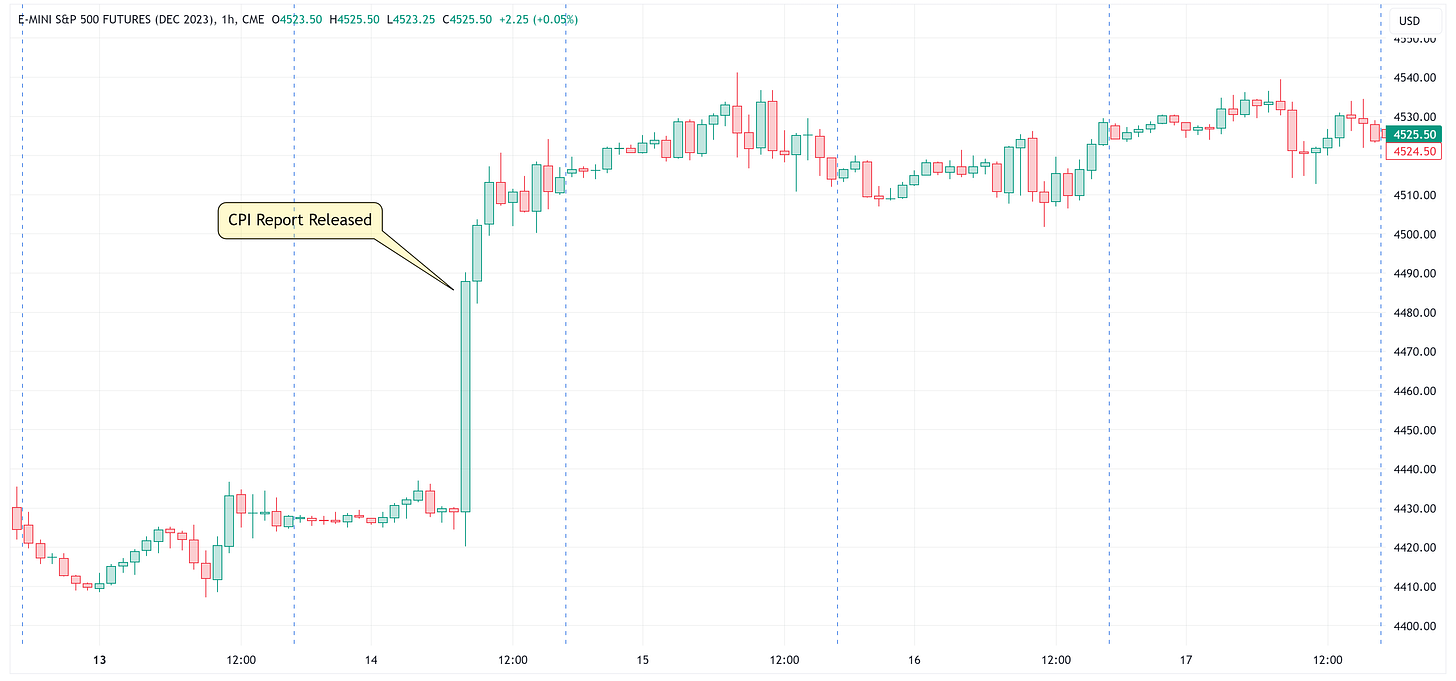
Here is the same time frame chart, but looking at S&P 500 futures instead.
It certainly seems that the order of operations was as follows:
Soft CPI report —> US Treasury’s rally —> S&P 500 rallies
S&P 500
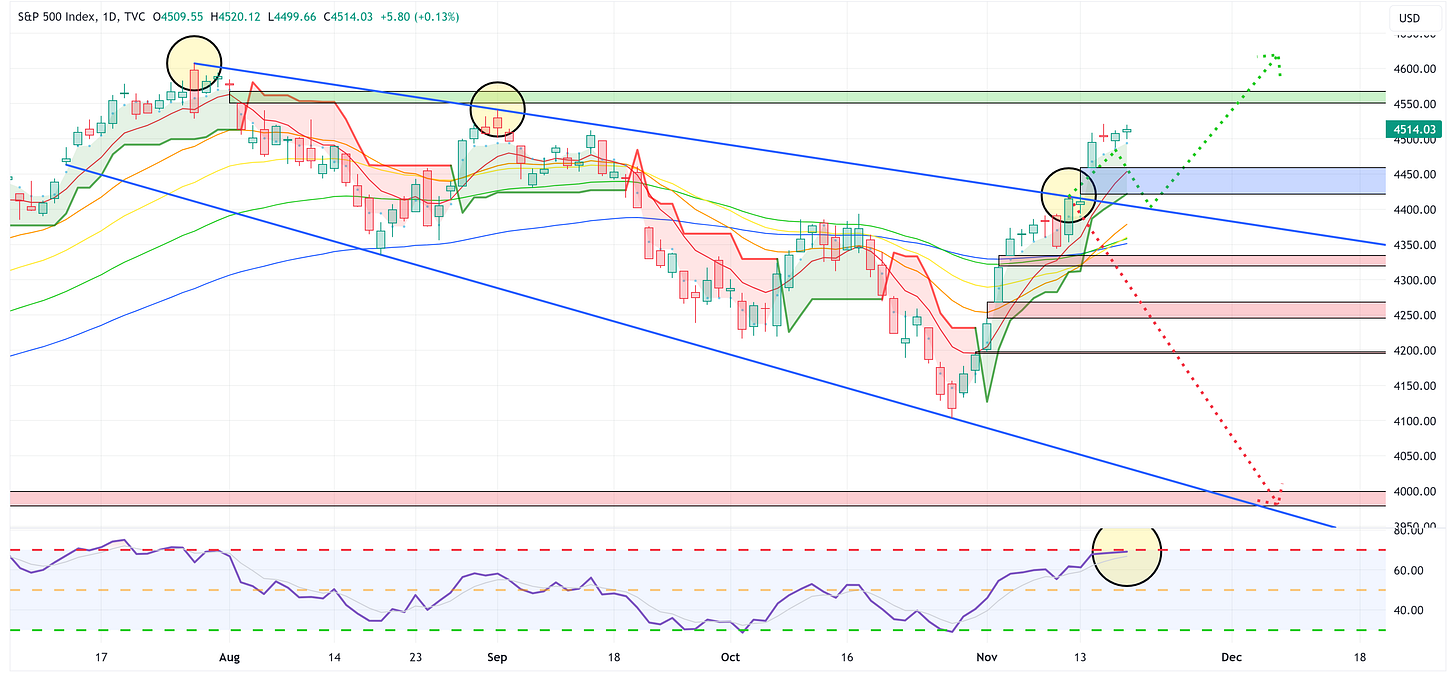
If we zoom out and look at the daily chart of the S&P 500, here’s what we see.
Last week (see the full report here), I made the following comment regarding a possible “bullish path” for the S&P 500 over the short term.
“Bullish Path = A continuation higher from here where the S&P 500 not only breaks the trendline but then retests the trendline thus allowing it to become support and then marching higher from there to take out the next “overhead gap”.”
As I noted above, for this bullish move to have legs, it needs to come back down and close the gap it created last week (blue box), bounce off of the downward trendline, and then march higher from there.
Watch the RSI
Note that the RSI is teetering on “overbought” territory. A move lower to fill the gap and bounce off the trend line may be enough to work off some of the overbought conditions and then propel the S&P 500 higher to close the overhead gap (green box).
If this narrative breaks, it will be with the S&P 500 trading below the downward trendline on the chart. If that happens, I think you have a pretty good shot at taking out each of the open gaps below (red boxes).
US Treasury’s
On October 30th, I made the following comment (see the full post here), regarding the potential for a move higher in the US Treasury ETFs that we follow:
“ZROZ, TLT, TLH, and IEF all have very similar charts. I realize the following rhetorical question could be (and likely is) a bit early, but “Are these four ETFs forming the “Head” of a possible inverse Head & Shoulders pattern from a deeply “oversold” position on the RSI?”
If so, a rally back to the neckline (i.e., not even accounting for the target levels that would be created above the neckline if this does turn out to be an inverse Head & Shoulders pattern), would create a move of +51.4%, +29.3%, +22.7%, and +11.5%, respectively.”
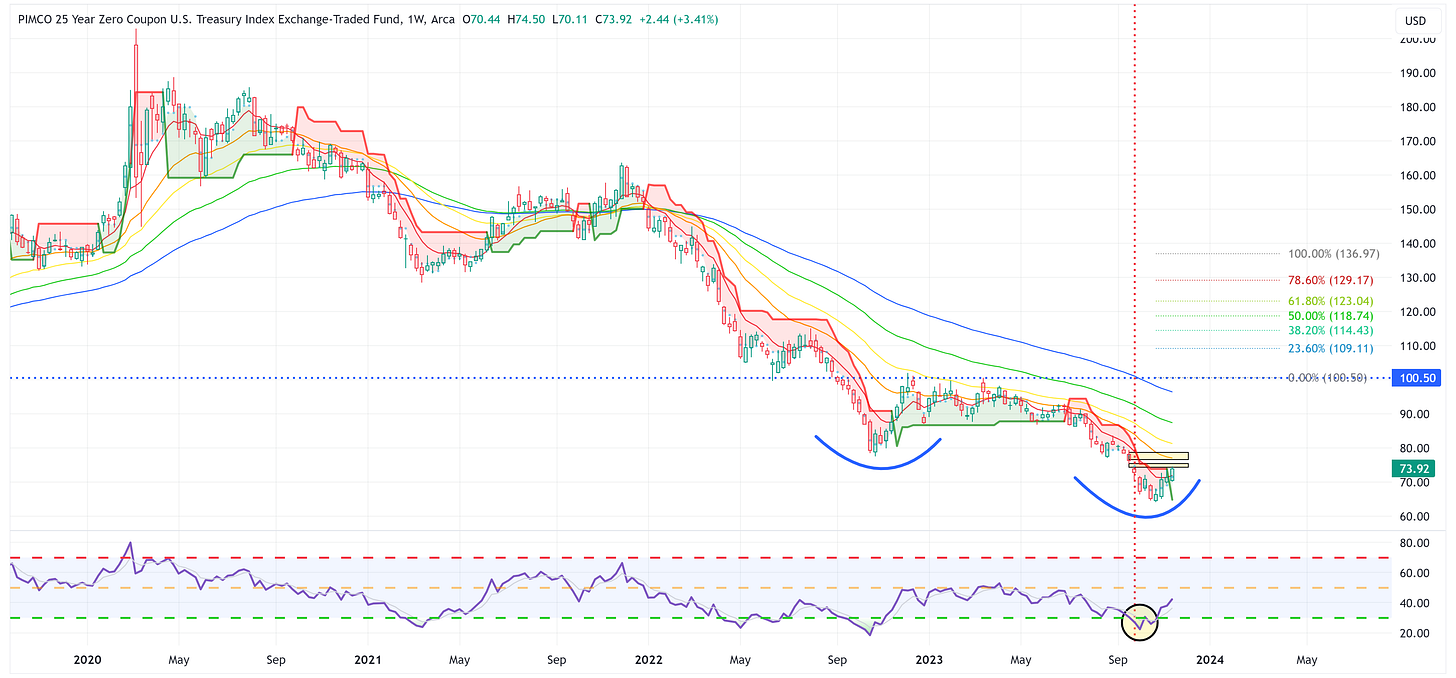
Let’s highlight ZROZ in today’s post.
Here is the weekly chart for ZROZ.
Since I published the October 30th piece, ZROZ has returned 11.36%.
If this ultimately becomes an inverse Head & Shoulders, ZROZ could reach a target in the neighborhood of 136.97 over the medium to longer term.
If inflation continues to fall, US Treasuries should continue to rally and the US Treasury ETF’s we follow have plenty of room to run.
Summary
The S&P 500 had a fantastic week last week on the back of softer inflation figures and a rally in US Treasuries. However, the rally was so fast and furious that it a) created a new gap below current price levels that needs to be filled and b) is already reaching overbought levels on the RSI indicator.
Watch for a potential pullback over the next week or so and pay close attention to how the S&P 500 reacts with regard to the downward trendline.
Happy Thanksgiving!
Life can be full of many ups and downs, but my hope is that each of us (myself included) will take a minute or two over the next few days to count our blessings and to spend time thankful for all we have been given.
Until next week…


Interest rates do appear to be a real key here. Appreciate the post & hope you have a great Thanksgiving!