Weekly Chart Review
With a look at what a few of the sectors are telling us...
Last week, I posted the following chart and said:
“I can make the case that we could be in the process of forming an inverted Head & Shoulders pattern (not confirmed at this point). If that is the case, our first target is 4,277, or 7.73% higher than Friday’s close. If that target is achieved, our second target becomes 4,532, or 14.14% higher than Friday’s close.”
Fast forward one week and here is the same chart.
Note that we have broken through the neckline and have continued to climb higher. This by no means suggests that we are “guaranteed” to hit our target of 4,277 but the pieces are falling into place towards that end.
There is one thing about this chart that worries me. Note the red box towards the right hand side of the chart. This is a 20 point price gap that was created between the high on last Tuesday, and the low on last Wednesday.
I’m a big believer that all gaps get filled. The question is always over what time frame. It could be this week or it could be two months from now, no one knows. Either way, this is a price area (red shaded box) where the S&P 500 will “need” to trade at some point in the future.
Putting is all together.
After such a strong rally to close out the second half of last week, it wouldn’t surprise me to see a modest pullback this week. If we do get a pullback, the key will be to watch for where the pullback stops.
Two Scenarios
If we pullback to the neckline and bounce from there, that would be a very positive development for this inverse H&S pattern and instill greater confidence towards achieving the 4,277 price target.
If the market attempts to “close the gap” that I noted above, this would suggest that the inverse H&S is likely no longer in play which then removes the previously suggested targets.
Net/net, the pullback, if and when it comes, will tell you a lot about where we’re heading over the short-to-medium term.
Sector Review
Next, let’s a take a quick run through a few of the S&P 500 sectors. We’ll focus on the ones that continue to outperform relative to the S&P 500 and those that might be at a turning point.
We will do this by taking a look at the weekly Heikin-Ashi candle charts like we did in the February 20th “Weekly Chart Review” where we compared each sector to the S&P 500. For this review, I have also added a Relative Strength Index (RSI) indicator for context.
As a reminder, we perform this analysis by taking the sector’s price and dividing it by the S&P 500 (SPY). For example, to analyze the Communication Services Sector (XLC), we would use XLC/SPY.
Communication Services (XLC/SPY)
After a brief wobble a few weeks ago, XLC is back to outperforming relative to SPY. Also, note that the RSI remains in an uptrend and has not reached the point of being overbought as of yet. This suggests that XLC could have room to run relative to SPY.
Energy (XLE/SPY)
Energy is not necessarily oversold when looking at the RSI; however, we are creating what appears to be a rounding bottom reversal pattern which suggests it could be about to move higher relative to SPY. Further, there were surprise OPEC+ production cuts announced over the weekend which could move energy prices higher thus further amplifying XLE’s performance relative to SPY over the short-term.
Financial (XLF/SPY)
XLF is deeply oversold relative to SPY and appears to be forming a rounding bottom reversal pattern. It would seem likely that XLF bounces at some point relative to SPY given how oversold it is.
Industrial (XLI/SPY)
XLI appears to have formed a double-top relative to SPY which would suggest a further move lower relative to SPY. Note that the RSI remains in a downtrend and is not oversold at this point.
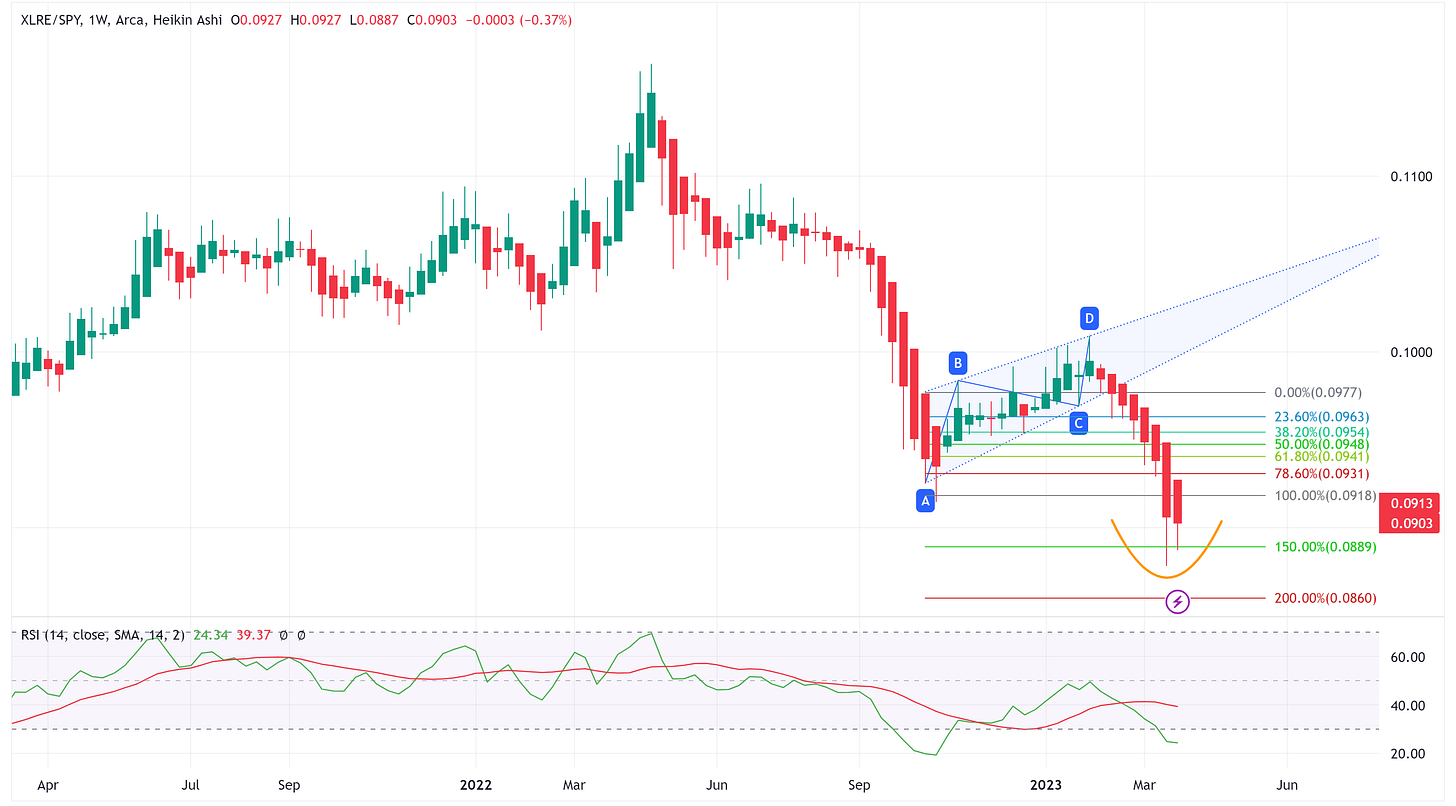
Real Estate (XLRE/SPY)
XLRE has reached the point of being oversold vs. SPY as noted in the RSI panel. The last time we saw this, XLRE began a period of multiple months of outperformance relative to SPY.
Technology (XLK/SPY)
XLK has been absolutely on fire vs. SPY since early October outperforming SPY by over 16%. Worth noting that we appear to be forming a rounding top reversal pattern and note that XLK is overbought relative to SPY on the RSI panel. Further, look what happen to XLK vs. SPY the last time XLK was this overbought back in December 2021.
Summary
The path of least resistance for the S&P 500 appears to be higher over the short-to-medium term. This would square well with what I noted in my “Bear Stearns” piece from a couple weeks ago.
With that said, don’t be surprised if we have a modest pullback this week before continuing higher thereafter. Remember to watch for where the pullback stops, that will tell you a lot about the strength of this current rally and where we may be heading next.


