Weekly Chart Review
Enter the U.S. Employment Report...
Let me start by saying that I hope everyone had a wonderful Easter yesterday and that you were able to spend some time with family and friends attending your local church services.
Now, let’s dive in for this week.
We have spent the last two weeks looking at the following chart. In last week’s post, I made the following comment:
“After such a strong rally to close out the second half of last week, it wouldn’t surprise me to see a modest pullback this week. If we do get a pullback, the key will be to watch for where the pullback stops.”
The S&P 500 returned -0.10% last week on a holiday-shortened week. While technically a “pullback”, I honestly thought it would be more than that so I am not taking a victory lap.
The second part of the statement above was an acknowledgment that “the key will be to watch for where the pullback stops.” Note that twice the market rallied up to the 38.2% Fibonacci level and then down to the 23.6% Fibonacci level. This doesn’t mean much other than the market appears to be respecting the Fibonacci levels as a basis for support and resistance over the short term.
If this continues to play out, and the market has a sustained break below the 23.6% Fibonacci, it is reasonable to think the next stopping point is the 0.00% Fibonacci or a price level of roughly 4,022. Alternatively, if the market continues to press higher, expect each of the above Fibonacci levels to provide some amount of resistance along the way.
Economic Release Creates Uncertainty
The markets were closed on Friday but we did get a key piece of data as the “U.S. Employment Report” was released. You can see the results below but worth noting that everything came in largely as expected.
The interesting thing was how the markets reacted to the news.
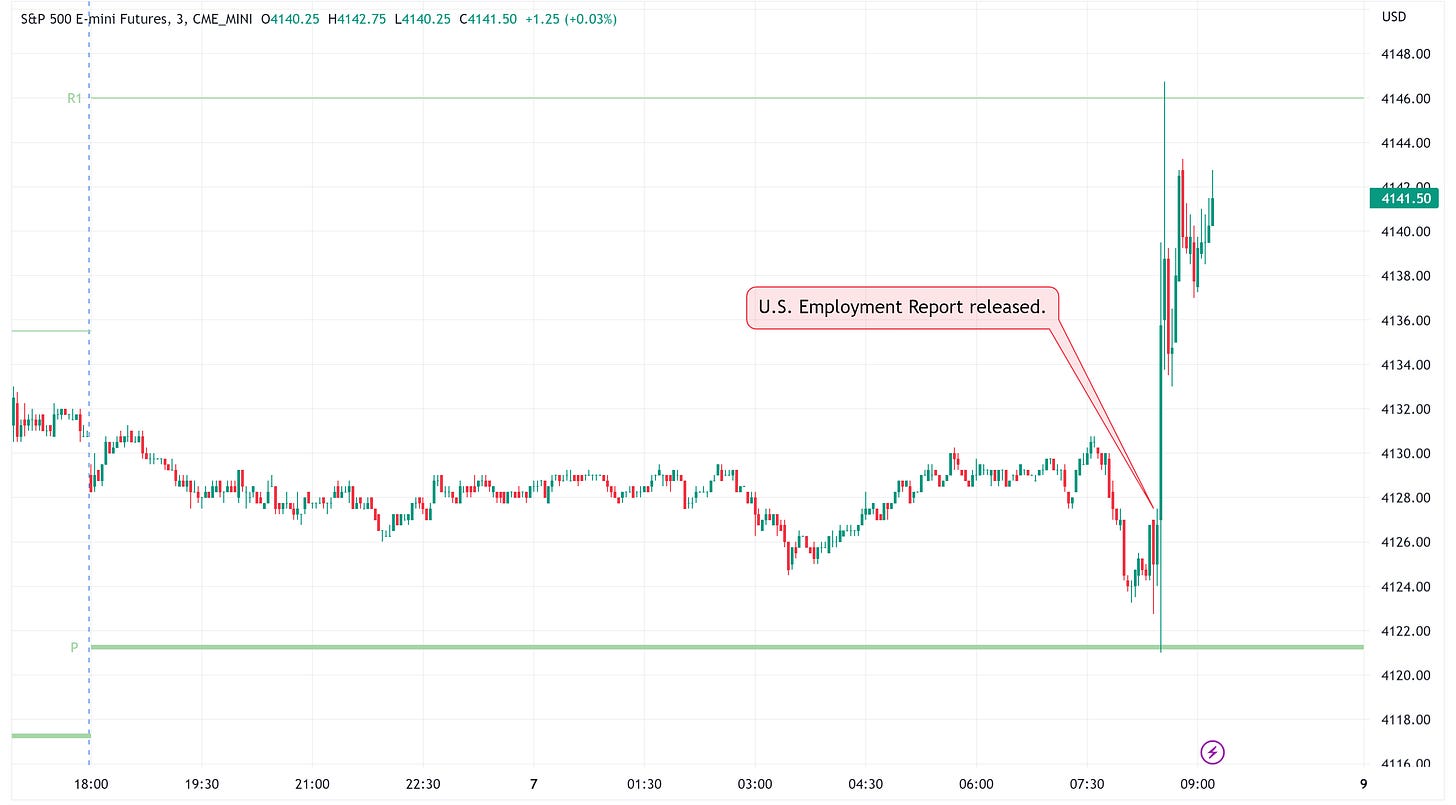
The chart below shows the S&P 500 futures market which was open on Friday. It’s probably pretty obvious where the U.S. Employment Report was released. If not, it’s at exactly the point where you see the market move sharply higher.
I am writing this piece on Saturday afternoon so I do not have the benefit of seeing where futures opened on Sunday night or where they are trading currently on Monday morning. With that said, the equity market appeared to like the report at least initially.
Alternatively, if we look at the yield on the 2 Year US Treasury, we find that it had an equally sharp knee-jerk move higher. Before the release, the 2 Year US Treasury was trading with a yield of ~3.83%, post the report, it moved all the way up to ~3.99%.
In tandem with this, we saw the Fed Funds Futures market move from a 48% chance of a 25 basis point rate hike in May to now pricing in a 71% chance of a 25 basis point rate hike.
While not an absolute statement, over the last several months, the equity market has looked favorably upon the notion of the Fed halting its rate hikes and has looked negatively upon the notion of additional rate hikes in the pipeline. As of right now, it would appear we have at least one more 25 basis point rate hike coming in May.
My sense is that the equity market thought it was done with rate hikes, and now it would appear that another rate hike is on the table. All else being equal, I would tend to believe that the equity market would look negatively at this development.
As I noted in my “Bear Stearns” piece from several weeks ago, it’s not uncommon to have a fairly substantial relief rally after a “near miss” event like Silicon Valley Bank.
More importantly, as I argued in my piece titled “How Long Can We Go?”, the better question to be asking is where we’re heading over the medium term. I won’t spoil the punch line but you’re probably not currently considering the market level my model is predicting.
Lastly, let’s conclude by looking at the sector charts I highlighted last week and see how they performed.
Communication Services (XLC/SPY)
Last week I noted:
“This suggests that XLC could have room to run relative to SPY.”
For the week, XLC returned +1.66% vs. a return of -0.05% for SPY.
Looking to this week, the chart remains the same; however, we are quickly approaching overbought levels on a relative basis so proceed with caution.
Energy (XLE/SPY)
Last week I noted:
“We are creating what appears to be a rounding bottom reversal pattern which suggests it could be about to move higher relative to SPY.”
For the week, XLE returned +2.60% vs. a return of -0.05% for SPY.
Energy’s strength last week was largely on the heels of the OPEC+ production cuts. There will come a point where the reality of underlying economic weakness will become more obvious to more people and Energy will be negatively impacted. For now, we’re a long way from overbought so it’s not inconceivable to think this positive trend could continue.
Financial (XLF/SPY)
Last week I noted:
“XLF is deeply oversold relative to SPY and appears to be forming a rounding bottom reversal pattern. It would seem likely that XLF bounces at some point relative to SPY given how oversold it is.”
For the week, XLF returned -0.50% vs. a return of -0.05% for SPY.
I completely whiffed on this one. Deeply oversold became even more deeply oversold. Worth noting that XLF hasn’t been this oversold since May 2020 when we were deep in the throes of the Covid crisis (see bottom panel of chart). Can we go lower on a relative basis, sure, but when it turns, it has the potential to be a fairly prolonged move higher so it might be worth dipping a toe in the water.
Industrial (XLI/SPY)
Last week I noted:
“XLI appears to have formed a double-top relative to SPY which would suggest a further move lower relative to SPY.”
For the week, XLI returned -3.37% vs. a return of -0.05% for SPY.
The song remains the same this week. XLI is not oversold relative to SPY and we have not reached our double-top prescribed target; therefore, we should expect more of the same.
Real Estate (XLRE/SPY)
Last week I noted:
“XLRE has reached the point of being oversold vs. SPY as noted in the RSI panel. The last time we saw this, XLRE began a period of multiple months of outperformance relative to SPY.”
For the week, XLRE returned -0.75% vs. a return of -0.05% for SPY.
While not the performance I would have hoped for on a relative basis, note that a) the Heikin Ashi candle has moved up from last week and b) the RSI (bottom panel) is beginning to tick up. These are signs that the bottom may be in for XLRE relative to SPY.
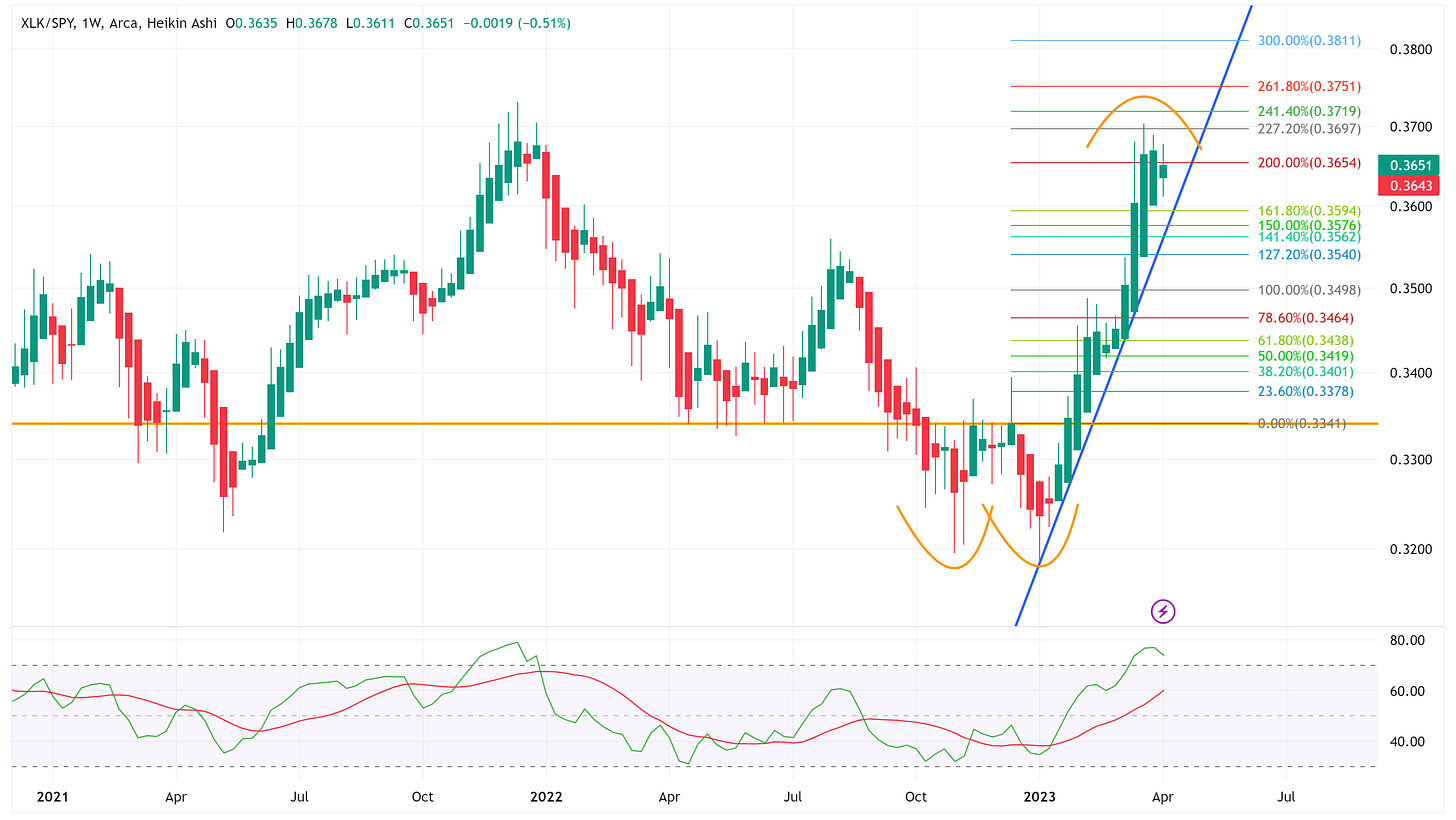
Technology (XLK/SPY)
Last week I noted:
“Worth noting that we appear to be forming a rounding top reversal pattern and note that XLK is overbought relative to SPY on the RSI panel. Further, look what happen to XLK vs. SPY the last time XLK was this overbought back in December 2021.”
For the week, XLK returned -1.28% vs. a return of -0.05% for SPY.
Similar (but opposite) to what we’re seeing with XLRE, the Heikin Ashi candle is now moving lower and we’re seeing the RSI rollover from overbought conditions. This would suggest XLK could continue to move lower relative to SPY.
Watch the blue trend line. We have not broken through this line in months. Will it hold? If so, the damage will be contained. If not, December 2021 is your proxy for what can happen.
Summary
As always, there are many moving parts to the market. I continue to be of the opinion that we’re at the part of the cycle where you want to err on the side of being more defensive than aggressive.
Does that mean you sell everything you own and move to cash, no, but what it does mean is that it may not hurt to lighten up on some risk assets and move directionally towards those assets that would provide some shelter in the storm.
Lastly, develop a systematic process that removes emotion from the decision-making process. Fear and greed are killers both on the upside and the downside. Build a system that removes emotion from the equation and you’ll be a mile ahead of almost everyone else.


