Happy Monday!
Let’s jump right in.
Last week was a strong week across the board as the S&P 500 returned +2.42% and all eleven sectors were in the green. The best-performing sector for the week was Consumer Discretionary at +3.28% while the “worst-performing” sector was Energy at +0.82%.
I made the following reference last week to my analysis from two weeks ago:
“The S&P 500 fell by -1.16% last week, thus creating a “red candle”. If the above analysis holds, this would suggest that the S&P 500 may continue to march higher from here. This would mean that our inverse Head & Shoulders (H&S) pattern is still in play and maybe more importantly, that the inverse H&S target of 4,927 is still in play.”
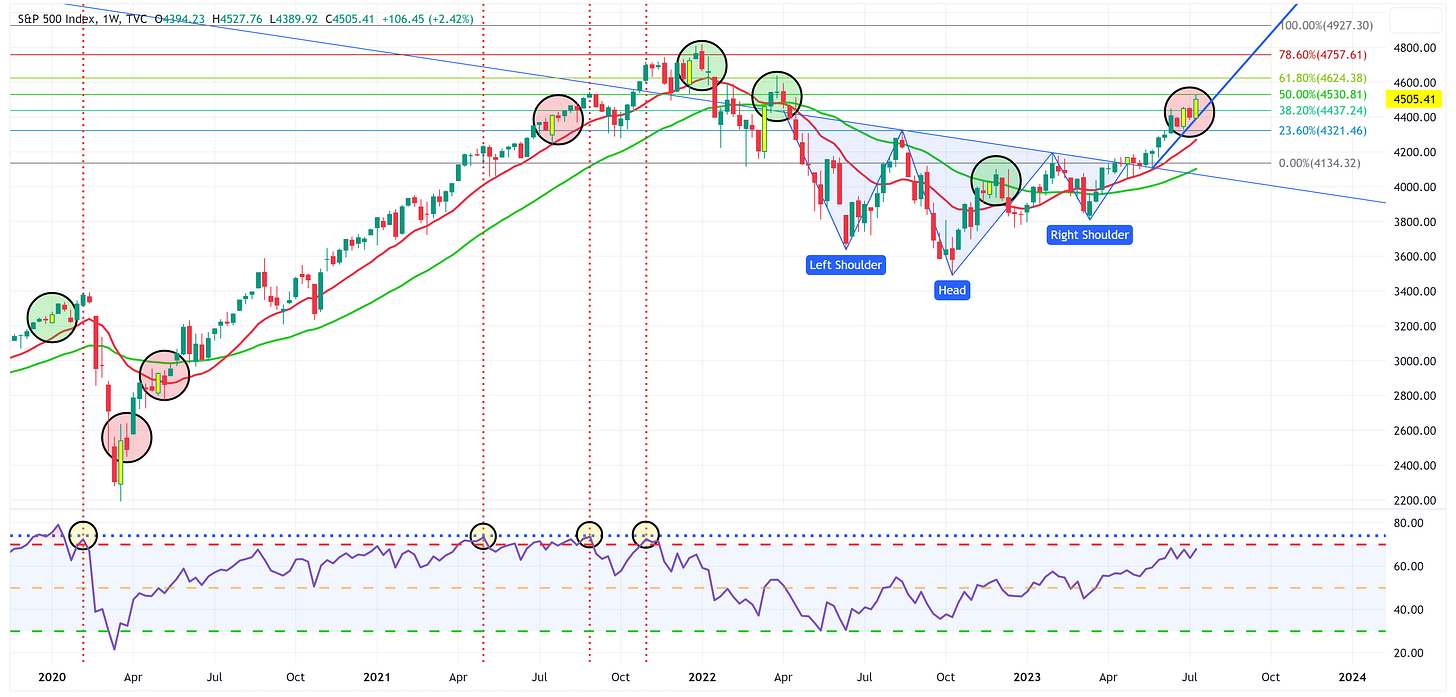
Not only did the S&P 500 “march higher” last week, but it also created another “bullish engulfing” candle (see below) which definitely keeps our inverse Head & Shoulders target of 4,927 in play.
Beyond the positive return and the bullish engulfing candle last week, there’s a lot to like about this chart from a bullish standpoint.
Note the recent moving average crossover as the 21-week (red line) moving average crossed up and through the 55-week (green line) moving average, this is inherently bullish. Further, note that both moving averages continue to have a positive (upward) slope and that the 21-week moving average continues to provide support. Net/net, there’s a lot to like about this chart for the bulls.
While the bulls are currently in charge, the bears will take note of the fact that while the RSI still has some room to run, it is pretty extended at this point. Further, note that last week’s price action almost perfectly hit the 50% Fibonacci line (4,530) and was rejected lower. This means that the Fibonacci levels are definitely in play and will likely provide resistance along the move higher.
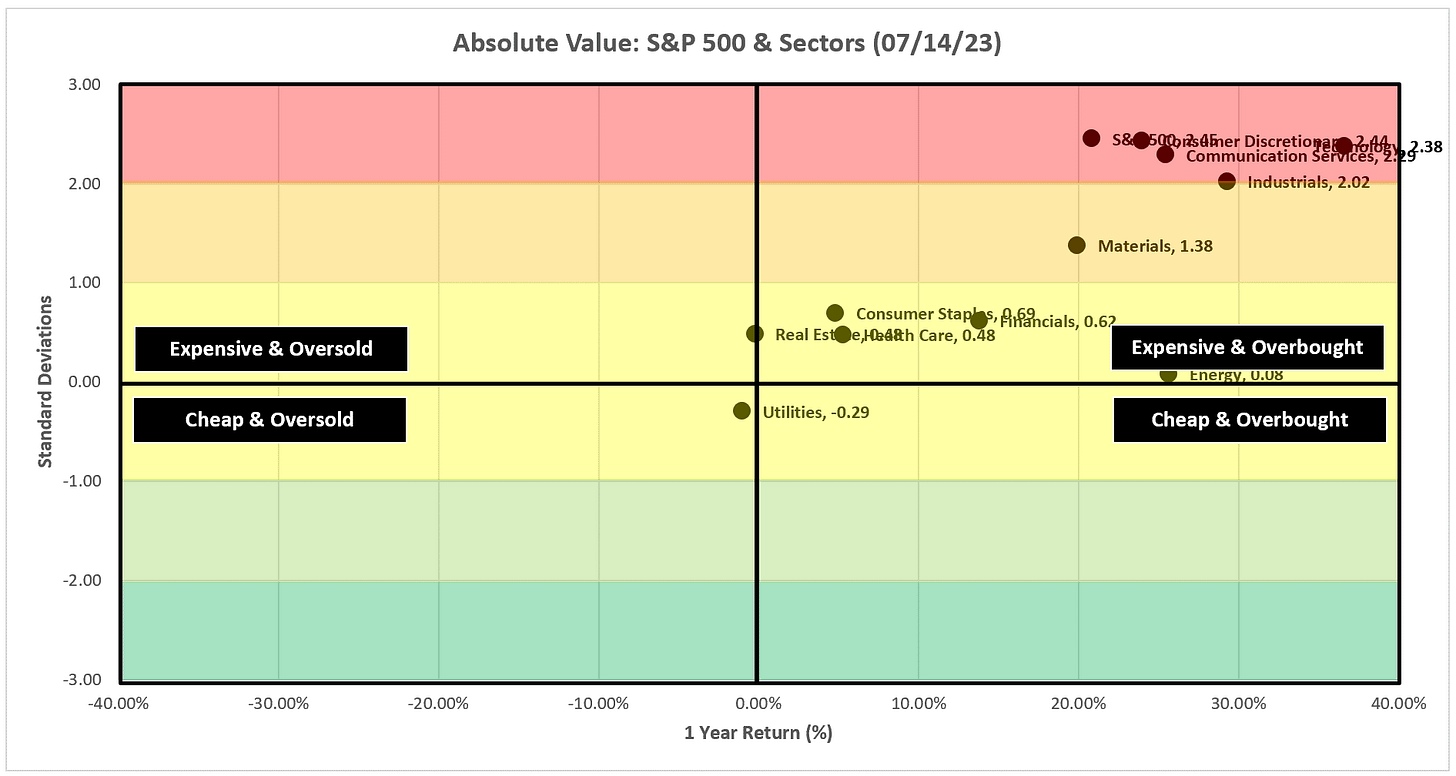
Lastly, as I’ll see below, and as I’ve pointed out for weeks, the S&P 500’s 1-year return puts it at +2.45 standard deviations which is likely unsustainable over the medium to long term. The S&P 500 “needs” to work off some of this froth by correcting lower to the 21-week or 55-week moving averages or by a sustained move sideways.
Absolute Value
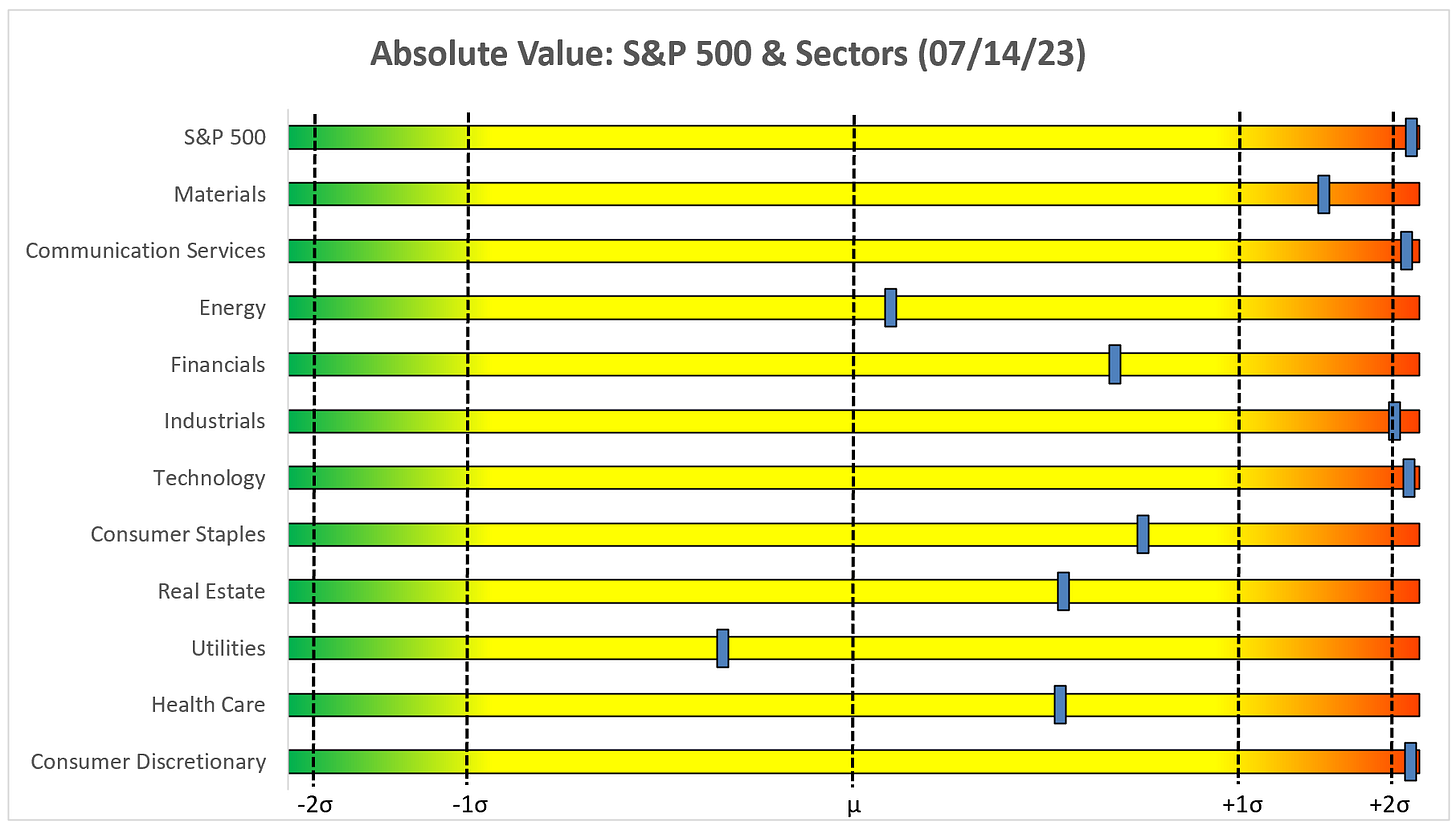
As noted above, the S&P 500 is not only at +2.45 standard deviations but it has a lot of company above +2.00 standard deviations. Further, note that every sector, except Utilities, is in the “Expensive & Overbought” quadrant on an absolute basis. This simply cannot be sustained forever.
Same data as above but a different look.
Relative Value
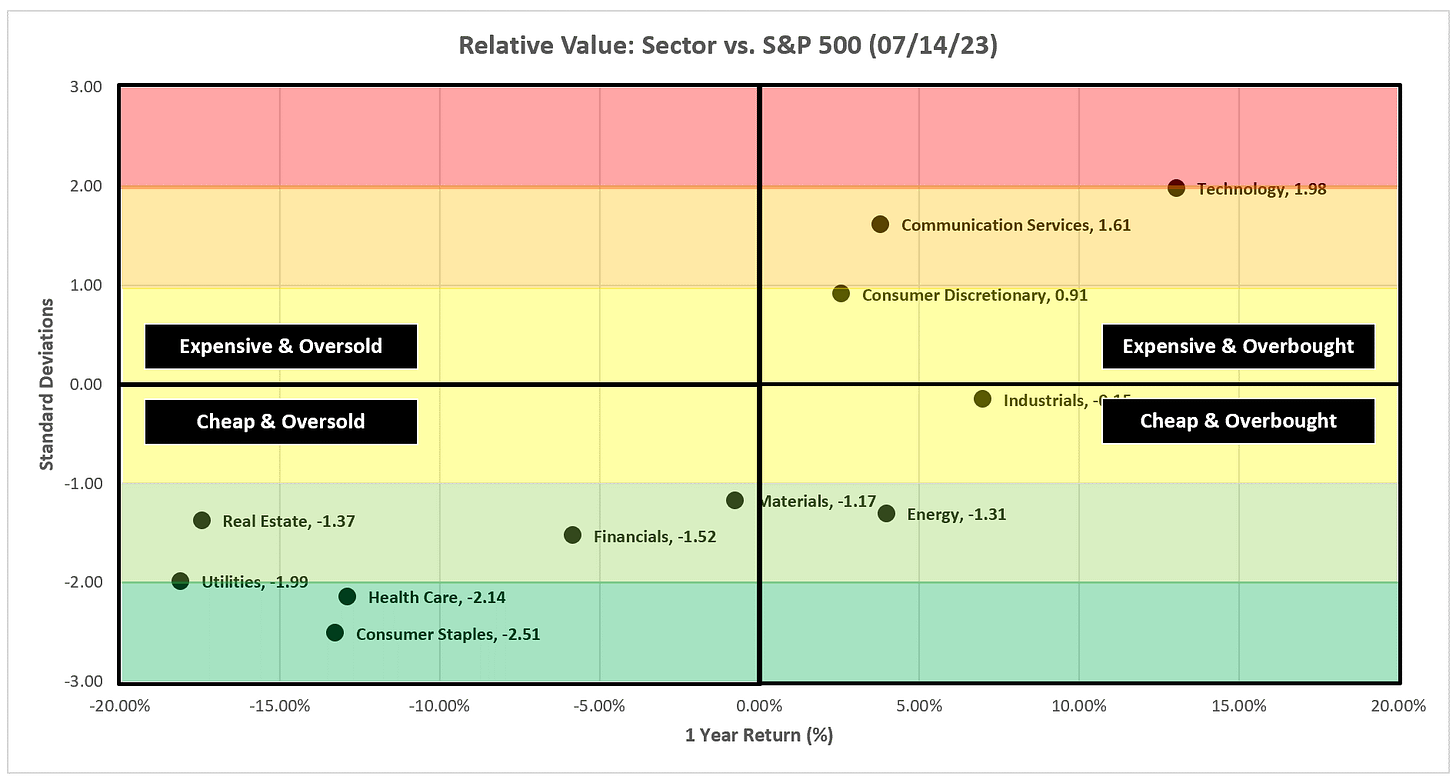
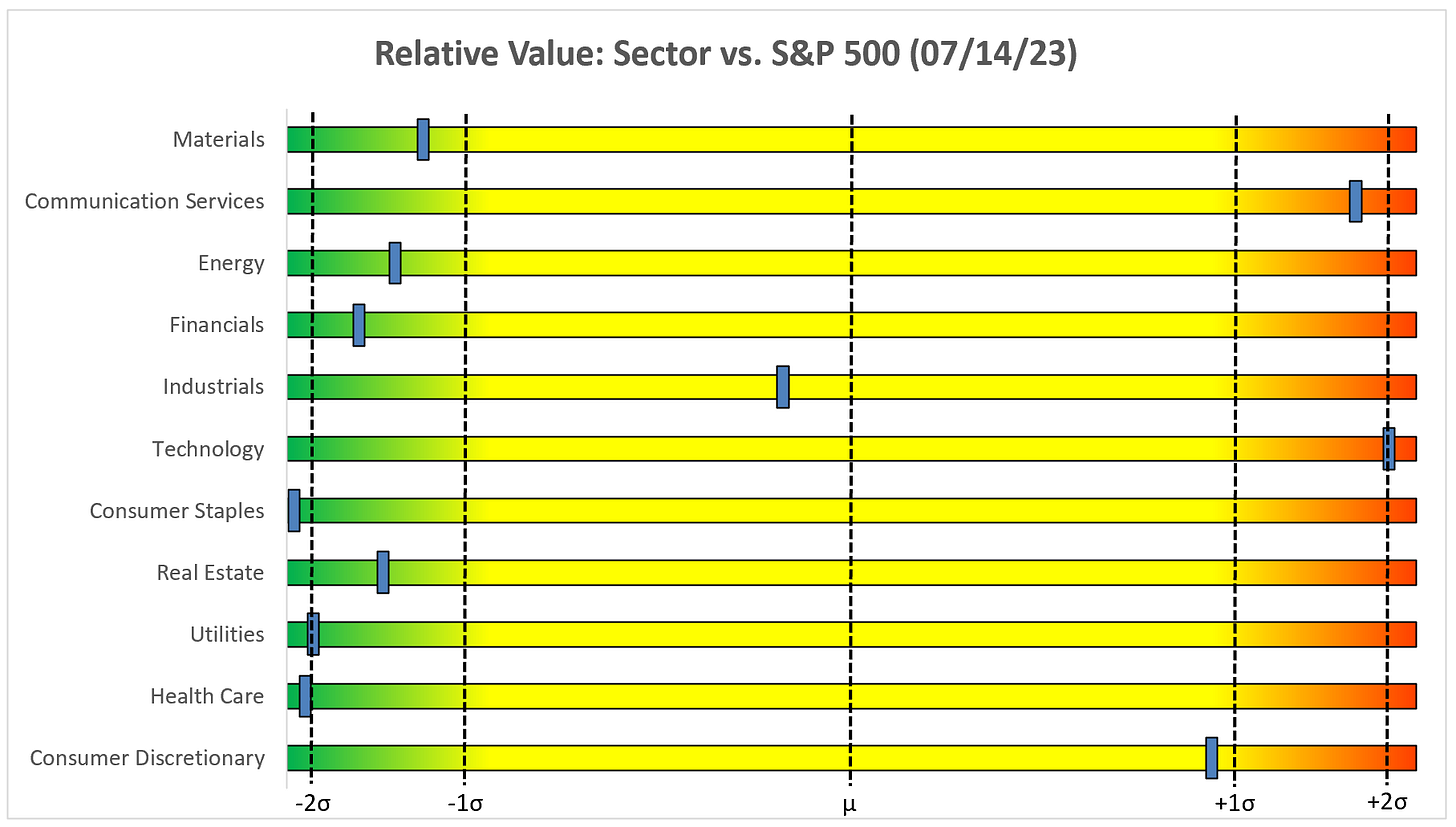
It’s more obvious in the second chart below but it really is a case of the haves and have-nots as the market continues to be driven by Technology, Communication Services, and Consumer Discretionary while everything else (except Industrials) is all the way at the other end of the spectrum.
I’ve said it for weeks but when this market turns, you’ll see flows into the defensives (Utilities, Health Care, and Consumer Staples) which are firmly in the “Cheap & Oversold” quadrant right now.
Same data as above but a different look.
Rates
Last week I made the following comment regarding the UST 10Yr:
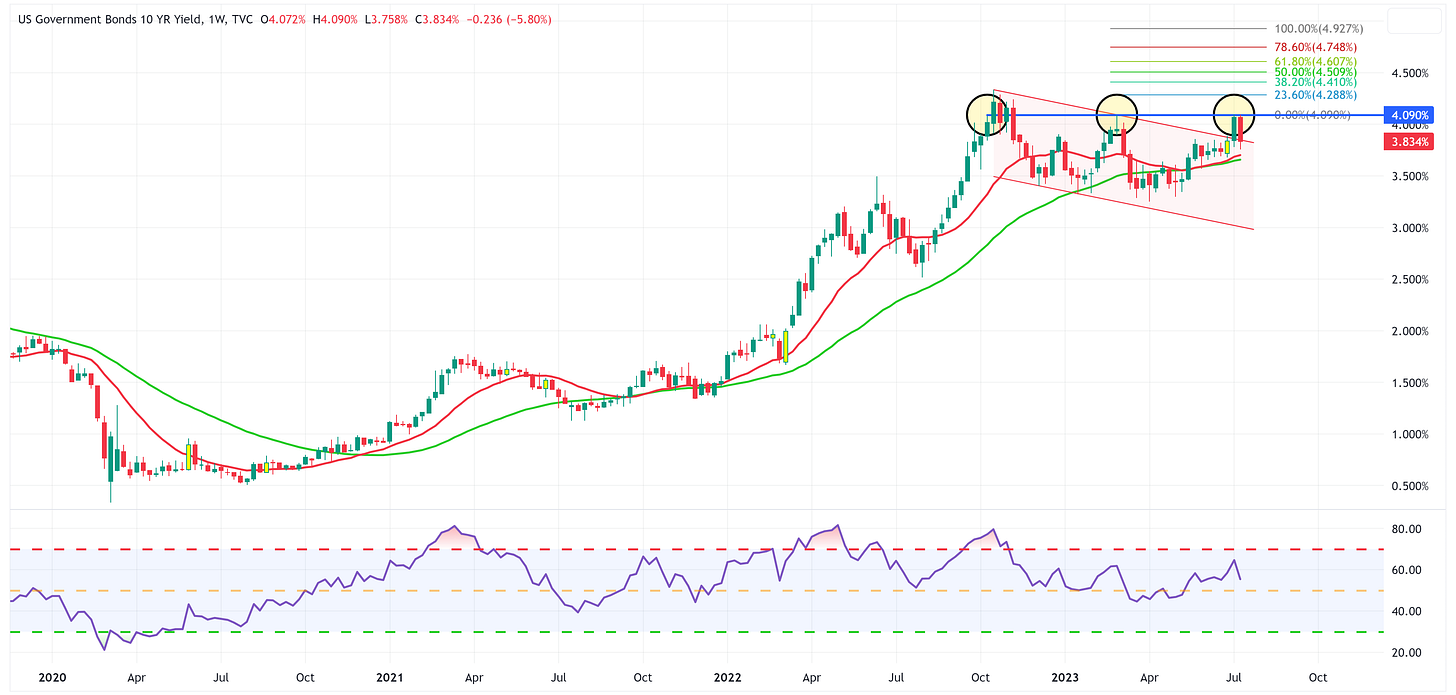
“There was a lot of talk last week about the UST 10Yr breaking out of the channel that it has been in since late last year. Some are suggesting that this means rates are going to continue to move higher.
I don’t disagree with the thesis, but I believe the UST 10Yr has to clear the 4.09% threshold which has been a critical level several times in the past (see yellow circles).”
Fast forward one week and here is the updated chart (see below). Note that the UST 10Yr hit exactly 4.09% last week and was rejected lower. This was largely in response to CPI and PPI coming in softer than expected which the market took to mean that FOMC may be done with rate hikes after the proposed rate hike later this month. With that said, I’m not convinced that July’s rate hike will be the last one for this cycle. Stay tuned on that front.
Let’s now turn to the sector charts. This week, I’m going to provide the chart and then “positives” and “negatives” for each chart. Please let me know if you like this approach.
Technology
Positive:
The inverse Head & Shoulders pattern remains in place with a target of 190.75.
Bullish engulfing candle last week.
Price is above the 21-week and 55-week moving averages and both moving averages remain positively slope.
Negative:
I have inserted a blue horizontal dashed line that represents the all-time high for XLK from Dec ‘21. Note that XLK reached this level last week and was rejected lower. For this move higher to continue, XLK has to eclipse the previous all-time high and then begin to use this level as support.
RSI remains above 70.
Communication Services
Positive:
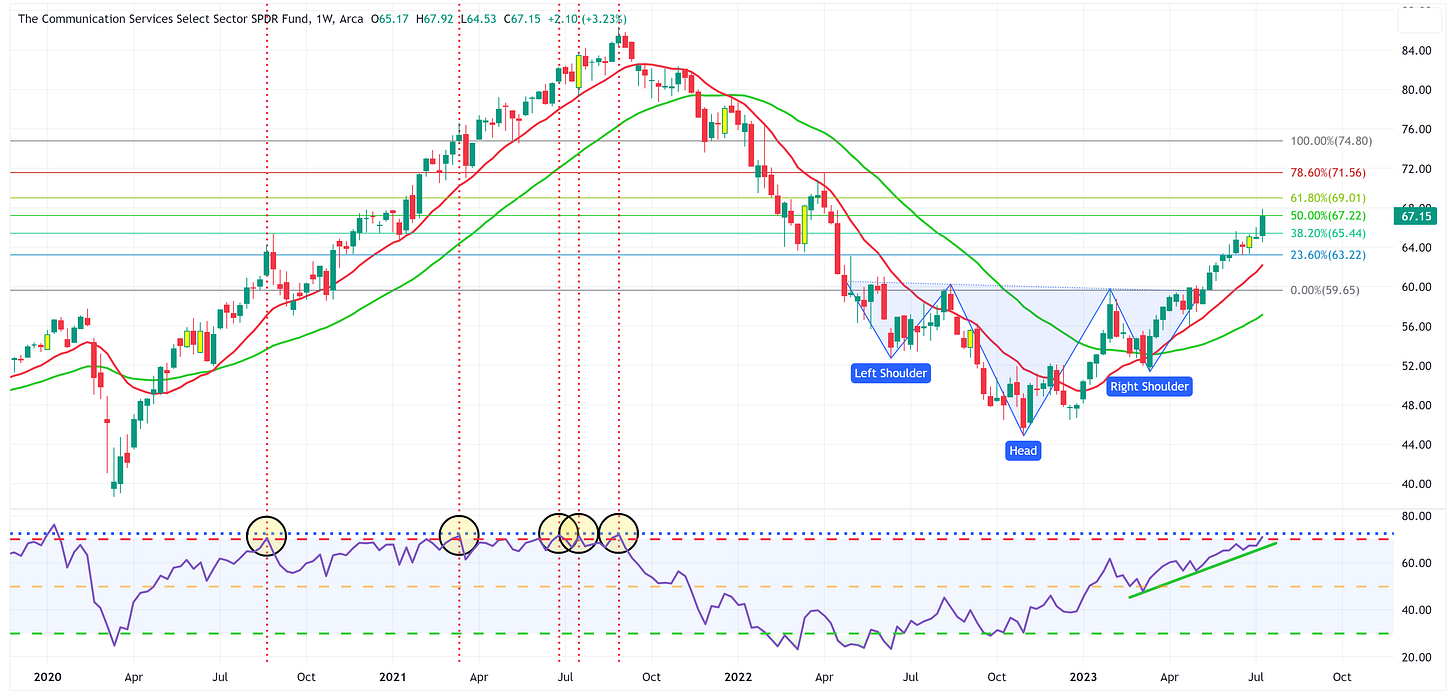
The inverse Head & Shoulders pattern remains in place with a target of 74.80.
The 21-week and 55-week moving averages remain positively sloped and the 21-week continues to extend itself further above the 55-week.
RSI continues its positive uptrend.
Negative:
Note that the week closed almost exactly at the 50% Fibonacci level. This suggests that this level is providing some amount of resistance.
While the RSI continues its positive trend, we are closing in on the level (blue horizontal dashed line) where we have made an about-face several times in the past.
Consumer Discretionary
Positive:
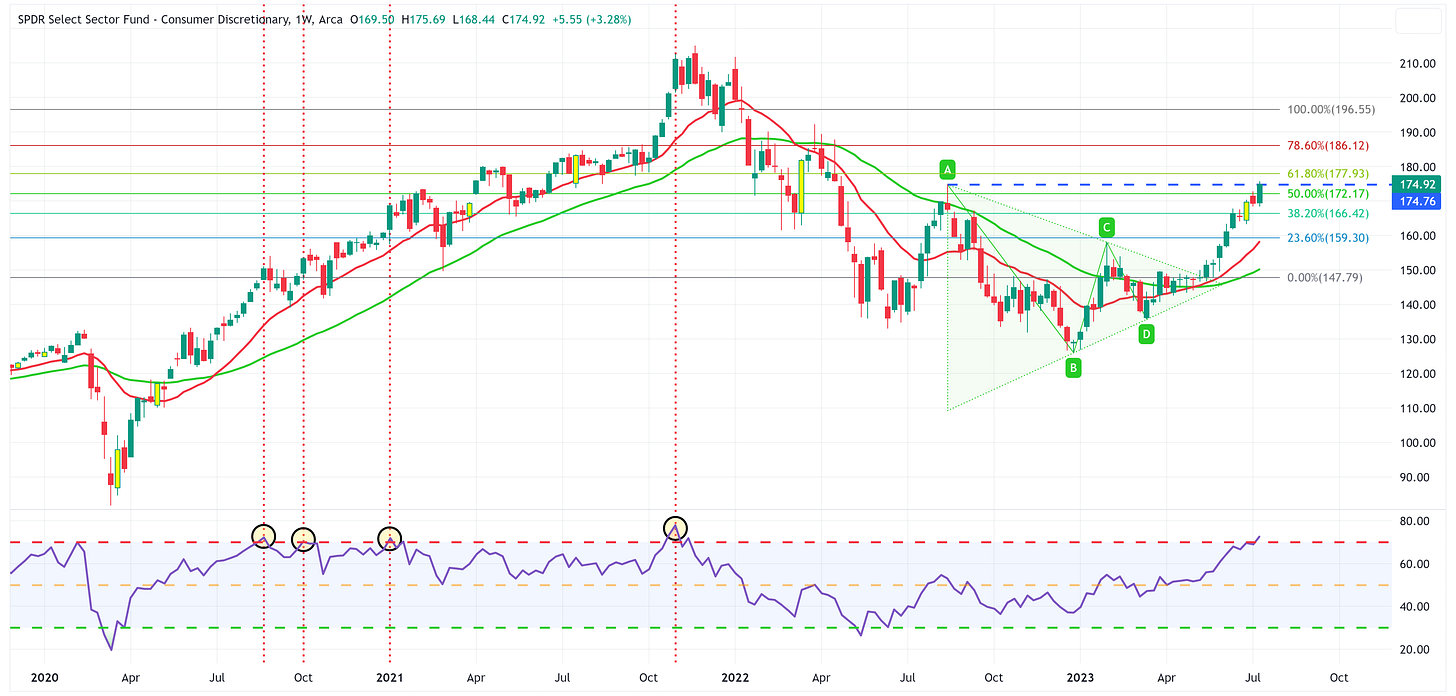
The symmetrical triangle target of 196.55 remains in place.
The 21-week and 55-week moving averages remain positively sloped and the 21-week continues to extend itself further above the 55-week.
Negative:
RSI is above 70 and therefore quite extended.
Note the high from August ‘22 (blue horizontal dashed line). Last week, XLY traded right up to that level but could not move beyond it. This will be a level of resistance until proven otherwise.
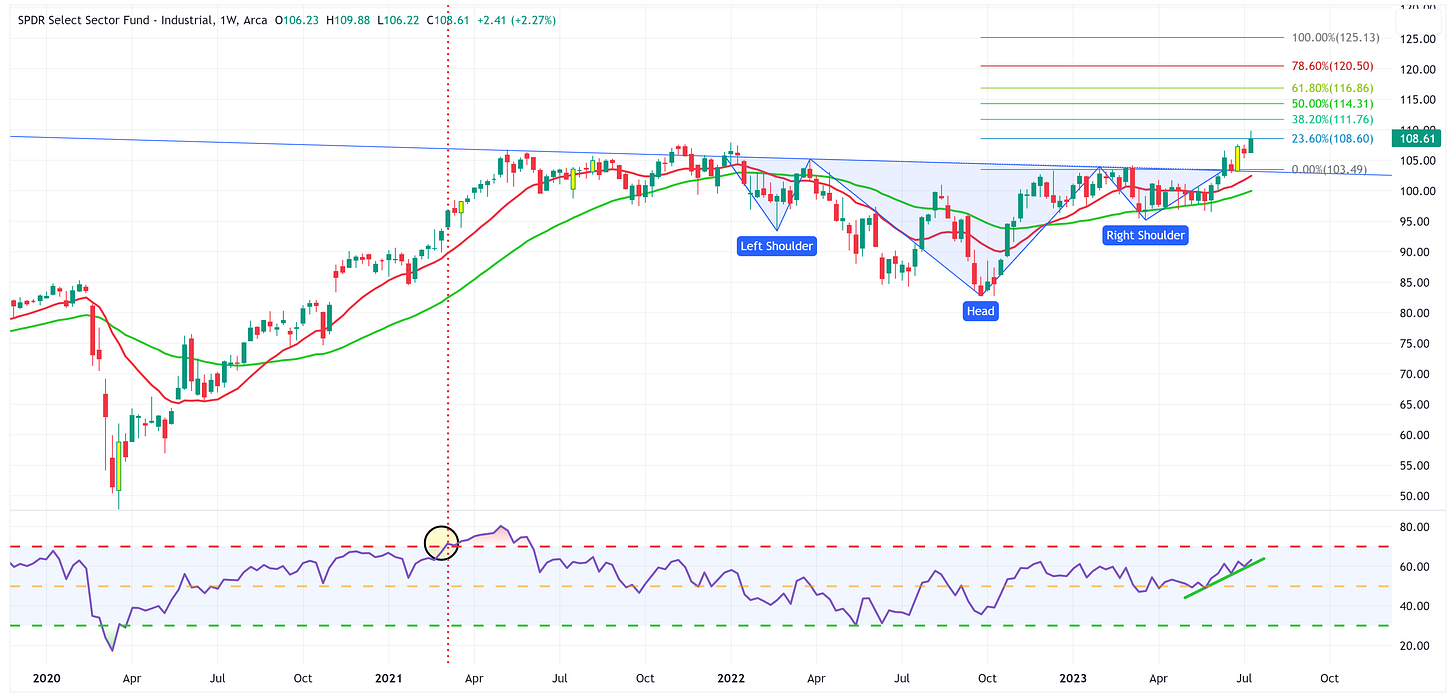
Industrials
Positive:
The inverse Head & Shoulders pattern remains in place with a target of 125.13.
The 21-week moving average remains above the 55-week moving average and positively sloped.
RSI uptrend remains intact with room to run.
Negative:
Note that last week closed at exactly the 23.6% Fibonacci level after trading above it earlier in the week. This would suggest that the 23.6% Fib is providing some resistance to the move higher.
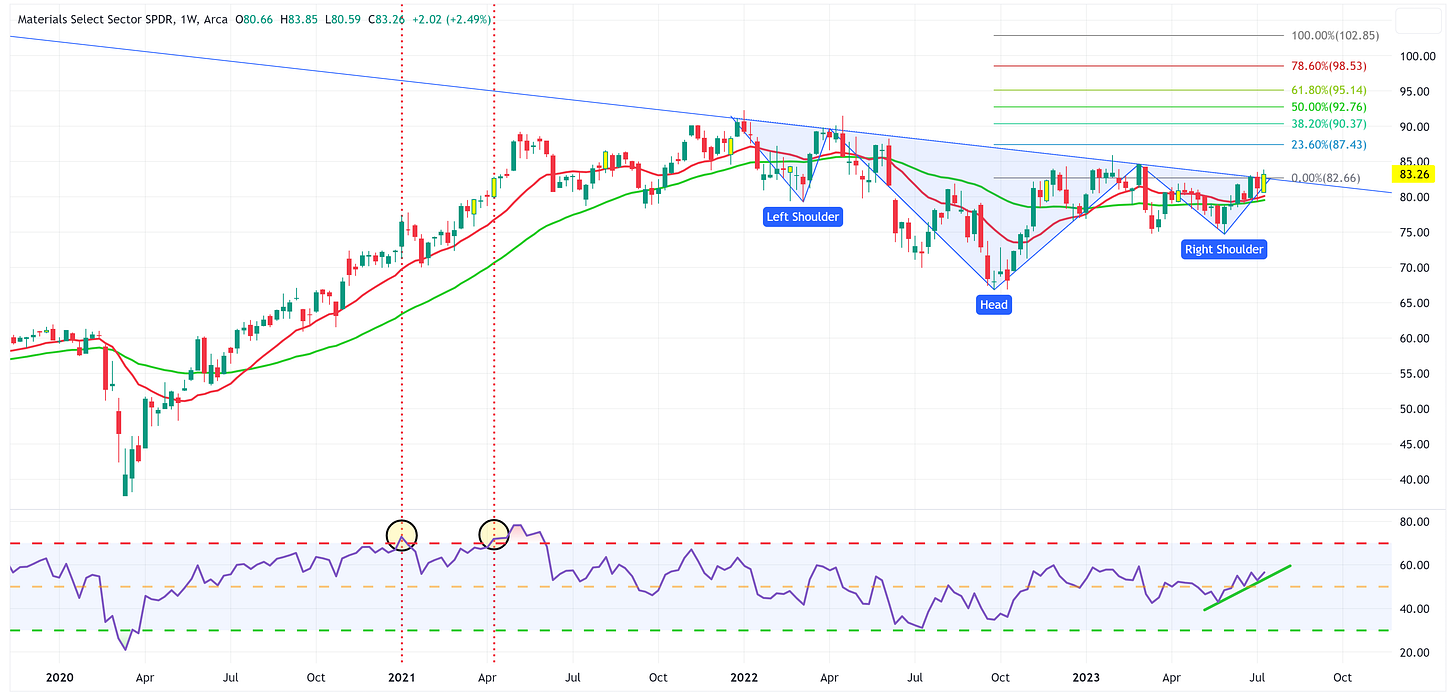
Materials
Positive:
RSI remains in an uptrend and above the midline threshold.
Last week’s price action created a bullish engulfing candle.
An inverse Head & Shoulders pattern appears to be in place if the price action can definitively cross the neckline.
Negative:
Moving averages are effectively moving sideways, I would prefer to see a more positive slope.
Thus far, XLB has not been able to cross the neckline to give the inverse H&S pattern a chance to take off.
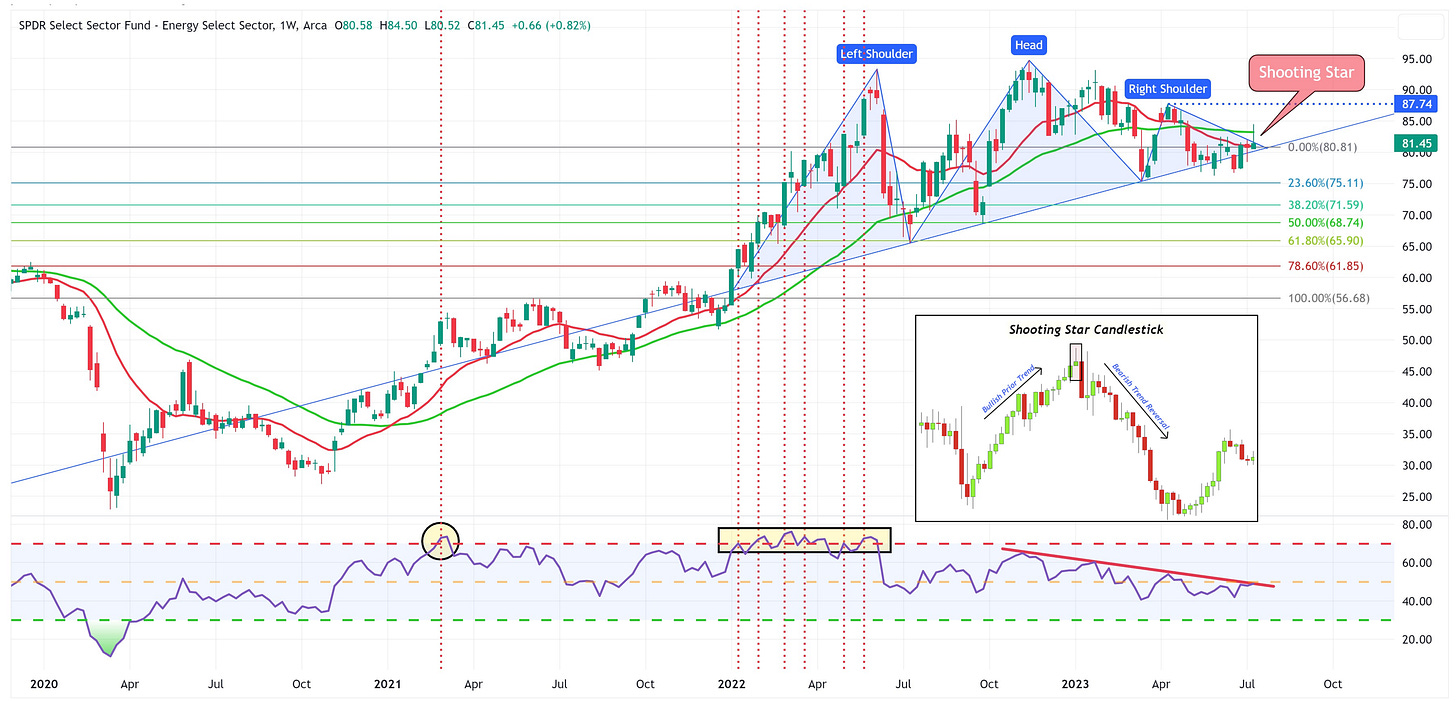
Energy
Positive:
XLE had a positive week despite a fairly ugly chart.
Thus far, XLE has resisted meaningfully breaking down and through the Head & Shoulders neckline.
Negative:
21-week moving average is below the 55-week moving average.
RSI remains in a downtrend and hasn’t been able to break through overhead resistance.
Last week’s candle created a “shooting star” pattern (see insert) which typically indicates a topping pattern.
If the neckline is definitively broken, the target becomes 56.68.
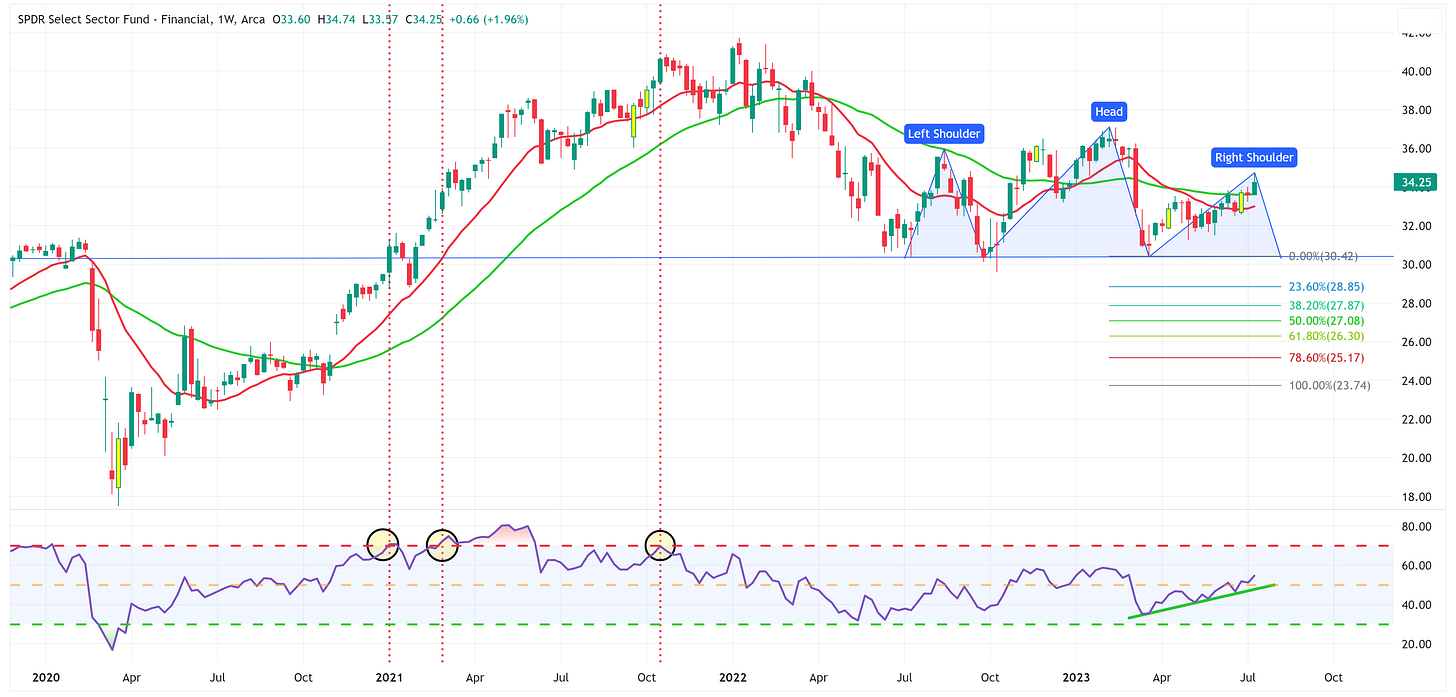
Financials
Positive:
RSI remains in an uptrend and is now above the midline.
The right shoulder of a potential Head & Shoulders pattern continues to fail to form thus suggesting it may not be a topping pattern and could go on to rally further from here.
Negative:
21-week moving average is below the 55-week moving average.
While it has not formed yet, a Head & Shoulders pattern seems like a possible candidate.
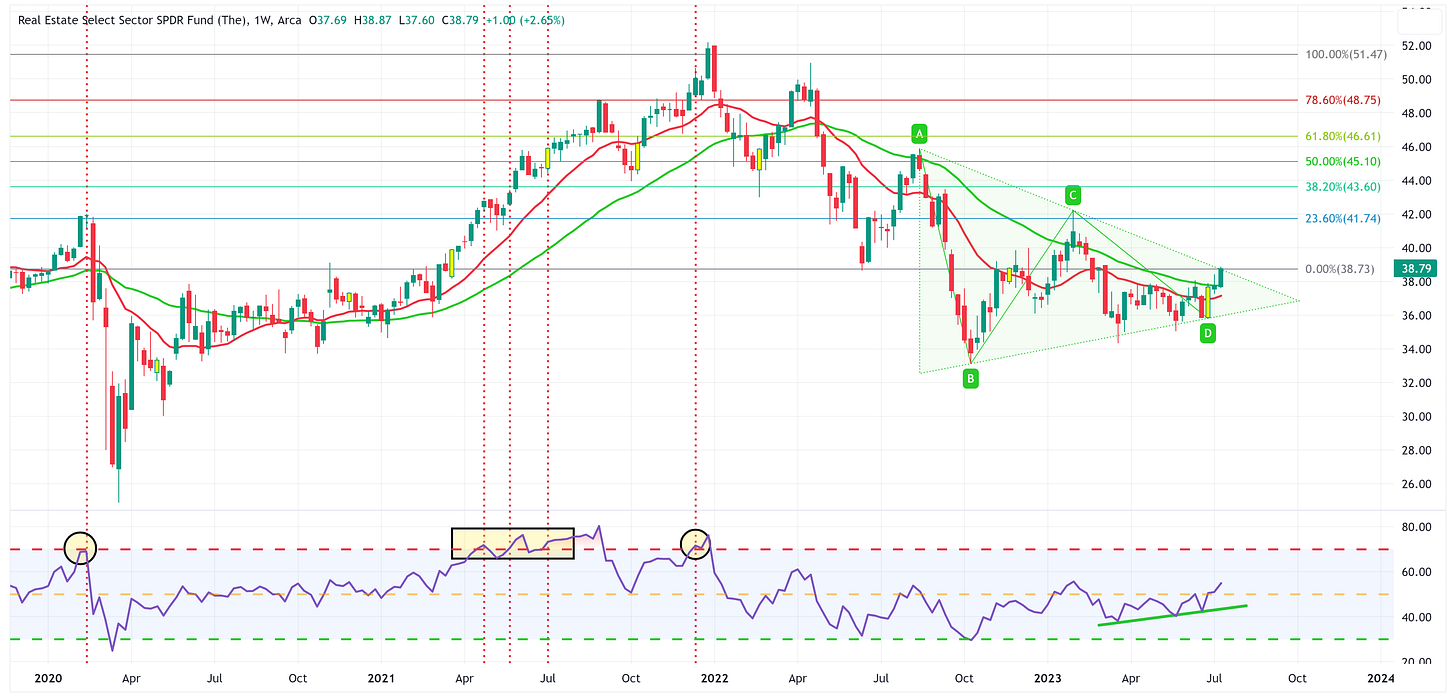
Real Estate
Positive:
RSI remains in an uptrend and is now above the midline.
The triangle pattern has yet to officially break out; however, if it breaks out to the upside, the target becomes 51.47.
Negative:
21-week moving average remains below the 55-week moving average.
Last week’s price action took XLRE to the top of the triangle pattern which proved to be resistance.
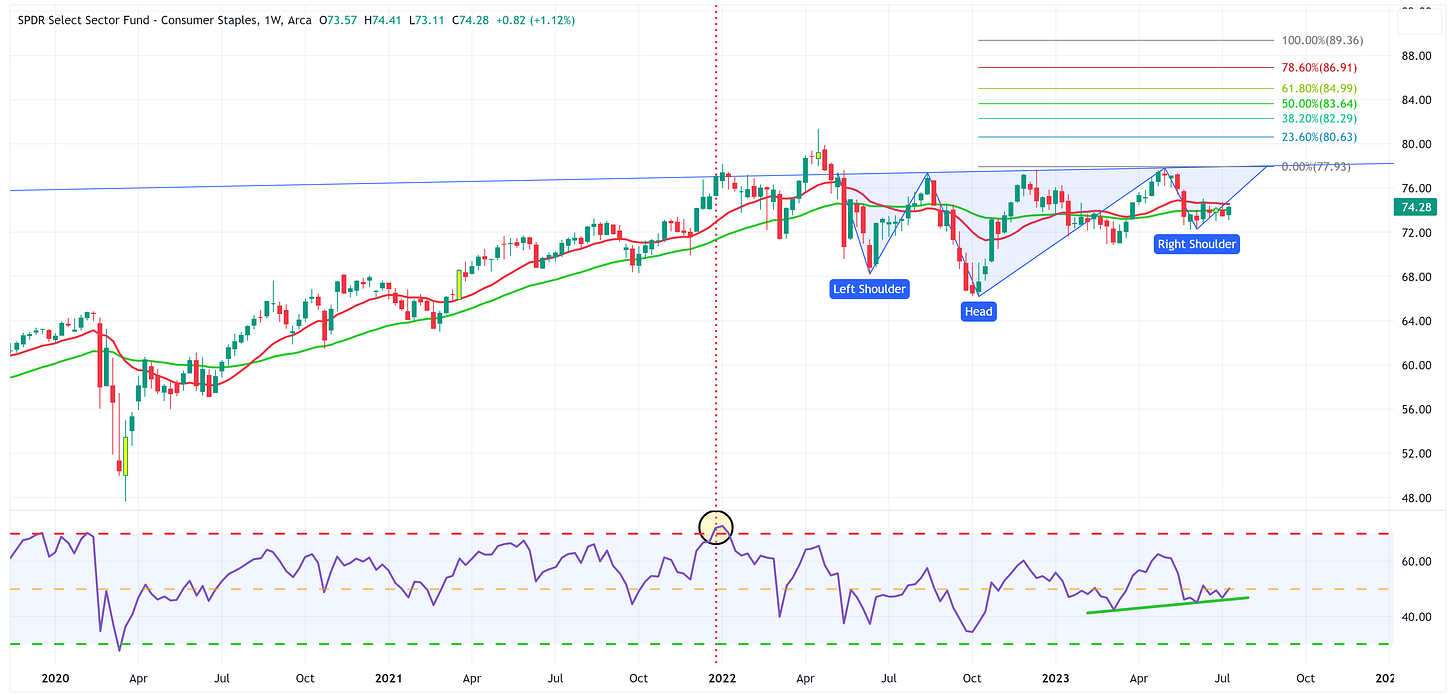
Consumer Staples
Positive:
The potential for an inverse Head & Shoulders pattern remains.
RSI continues to hang in there and is trying to get above the midline.
Negative:
XLP has effectively moved sideways for the last year (look at the moving averages).
21-week moving average has remained above the 55-week moving average for all of 2023 but can’t seem to generate any sustained positive momentum.
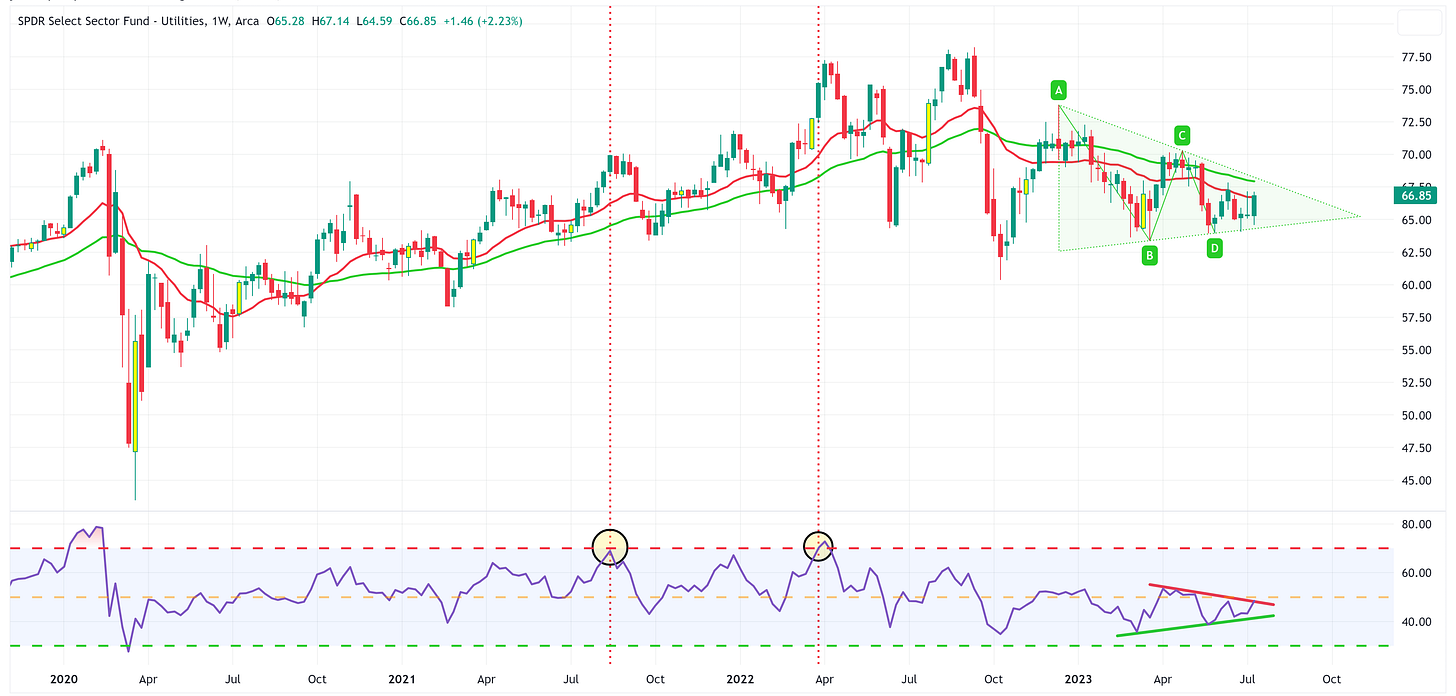
Utilities
Positive:
The triangle pattern still has the potential to break to the high side.
Negative:
The 21-week moving average remains below the 55-week moving average and both have a negative slope.
The 21-week moving average has more recently become a level of resistance.
RSI having trouble getting above the midline.
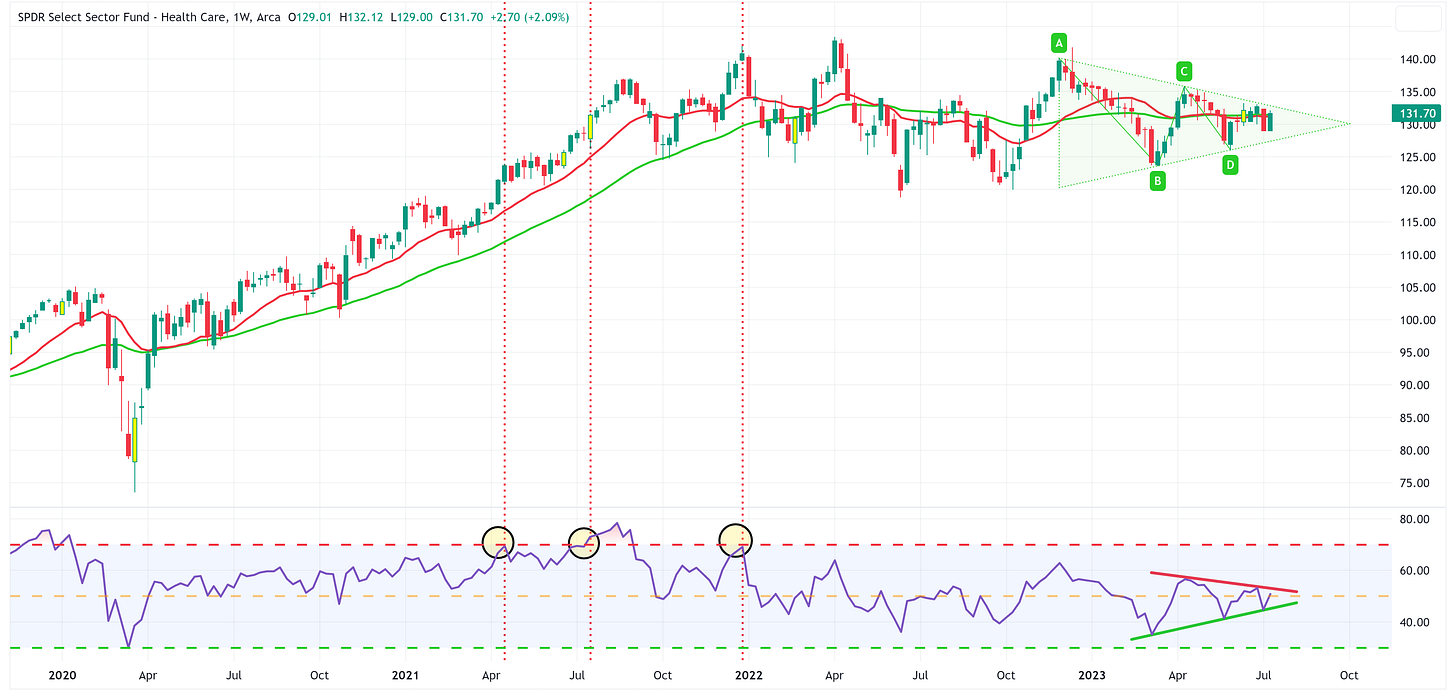
Health Care
Positive:
RSI is attempting to get above the midline.
The triangle pattern still has the potential to break to the upside.
Negative:
XLV has effectively moved sideways for the last year.
Moving averages are right on top of one another as they continue to move sideways.
Summary
Overall, an outstanding week for equities! With that said, I believe a lot of last week’s positive price action was based on CPI and PPI coming in softer than expected and the belief that the FOMC may have only one additional rate hike in this cycle. If the market begins to think (or is encouraged to think) otherwise (i.e., more than one hike remaining), we could see rates and equities reverse course.
If the FOMC believes the market is misinterpreting its intentions, they will attempt to reshape the narrative. The best opportunity to do this will be at the press conference following the next FOMC meeting on July 25-26.
With the meeting coming up in a week and a half, the FOMC has officially entered its “blackout period” which restricts Fed officials from speaking publicly about FOMC policy. In the interim, if the FOMC needs to “get a message” to the market, they will send out their unofficial spokesperson, Nick Timiraos of the Wall Street Journal, so be on the lookout for anything he publishes between now and July 26th.
For now, there’s a lot to like about the S&P 500’s setup so ride this trend while you can but do so with the knowledge of how extended we are so be sure to have the proper stops in place.
Until next week…



Like the pos/neg commentary - lucid, succinct, very helpful!
Thanks. Excellent info and commentary!