

Hey everyone, it’s Jim.
I hope you had a great weekend!
A quick programming note:
We’ve had a number of new subscribers to our newsletter over the last several weeks, so I thought it might be a good opportunity to level-set on a few items:
The “Weekly Chart Review” is published every Monday at 7:45 am ET.
There is both a free and paid version of the newsletter.
This week, I will publish the entire newsletter to both free and paid subscribers so that free subscribers can see what they’ve been missing behind the paywall.
I love your feedback! I read and respond to every comment each week.
Many subscribers also reach out to me directly each week by replying to this email. I encourage you to do the same. We are building a community, and the more discussion, the better.
If you find this newsletter valuable, please share it with friends, family, and other colleagues by clicking on the button below.
Okay, with that out of the way, let’s jump right into this week’s newsletter.
In this week’s newsletter:
Stay Informed
Key Macro Events From Last Week (ICYMI)
Key Macro Events To Watch This Week
The Market Map
S&P 500
S&P 500 Fair Value Model
The Market Map - Extended Analysis
Major US Indices
11 Major US Equity Sectors
US Treasuries
Currencies
Commodities
Fixed Income
Stay Informed
Key Macro Events From Last Week (ICYMI)
Last week was a relatively light week in terms of US economic data releases.
Tariff headlines largely drove the narrative as the July 9th tariff deadline approached (which we discussed in last week’s newsletter).
With that said, here are a few notables from last week:
🏛️ Tariff Announcements and Trade Tensions
President Trump unveiled a 35% tariff on Canadian goods (effective August 1), which knocked the S&P 500 off its record highs, while the Dow and Nasdaq also declined — Dow fell ~0.6%, S&P 500 ~0.3%, and Nasdaq ~0.2% on Friday, ending the week in the red. (Link)
Additional tariffs were proposed, including a 50% tariff on copper imports—a move poised to hit the U.S. auto industry hard, especially in EV production, potentially raising per-car costs by up to $5,700. (Link)
Trump announced a 50% tariff on Brazilian goods, along with up to 40% on countries like Algeria, Philippines, and more—further unsettling markets early in the week (later saw some backtracking on implementation). (Link)
📈 Market Reactions & Investor Sentiment
High-yield (“junk”) bond spreads over Treasuries dropped to their lowest since 2021, signalling investor confidence in the U.S. economy’s durability despite trade-related uncertainties. (Link)
JPMorgan CEO Jamie Dimon, speaking at an international event, warned that markets are underestimating the risk of further interest rate hikes—he put the probability of another Fed rate move at 40–50%, much higher than market expectations of ~20%. (Link)
🚀 Earnings and Sector Moves
Delta Air Lines delivered strong Q2 results and raised forward guidance, triggering a rally in airline stocks—Delta soared ~12%, and peers like United and American rose sharply, boosting equities mid‑week and helping push the S&P 500 and Nasdaq to fresh highs. (Link)
Other individual movers: WK Kellogg shares surged ~31% on acquisition news; AZZ rose ~5.5% after a solid earnings report, while Conagra and Helen of Troy underperformed on disappointing results. (Link)
⚙️ Strategic Developments & Broader Market Trends
U.S. banks—including JPMorgan, Goldman Sachs, Citigroup, Bank of America—are set for an estimated $26.4 billion trading revenue windfall in Q2, thanks to increased volatility and client activity around tariff moves. Earnings season will kick off this week. (Link)
The Department of Defense committed $400 million to MP Materials, operator of the only U.S. rare-earth mine, sending MP’s stock up ~45%. The push for onshore critical materials is gaining traction. (Link)
📊 Market Summary
Despite strong mid‑week earnings and broad investor optimism, stock indices finished modestly lower for the week:
Dow declined ~1%
S&P 500 lost ~0.3%
Nasdaq dropped ~0.1%
This ended multi-week winning streaks for the Dow and Nasdaq, and halted the S&P 500’s rise for the first time in three weeks. (Link)
🧭 Why It All Matters
Tariffs reinstated inflation fears and uncertainty around corporate margins—markets reacted by pricing in more risk, especially given threats of further expansion.
Earnings strength offered a lifeline, but were overshadowed by escalating trade risks.
Investor sentiment softened once upbeat bond-market signals contrasted with policy-driven market concerns.
Rising commodity prices, especially oil and copper, added pressure to the inflation narrative and the Fed outlook.
Key Macro Events To Watch This Week
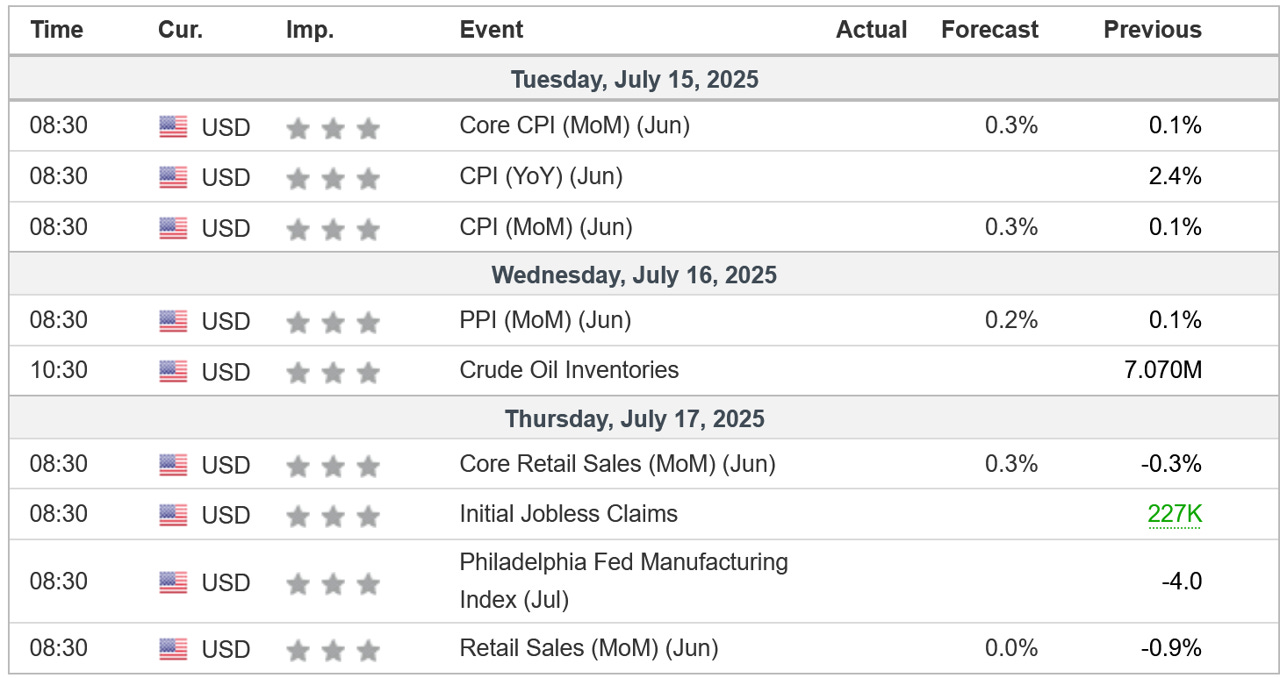
The US economic calendar gets back into gear this week.
All eyes will be on CPI and PPI to gauge the inflation outlook.
Additionally, pay attention to retail sales as it may provide clues into the perceived health of the US consumer.
The Market Map - S&P 500
We use this section each week to “Map the Market” using our proprietary, systematic methodology to gauge a) the current trend of the market and b) where the market may be heading over the medium term.
Most of our readers are longer-term investors, so we focus on the weekly charts; however, our methodology can be used on any timeframe.
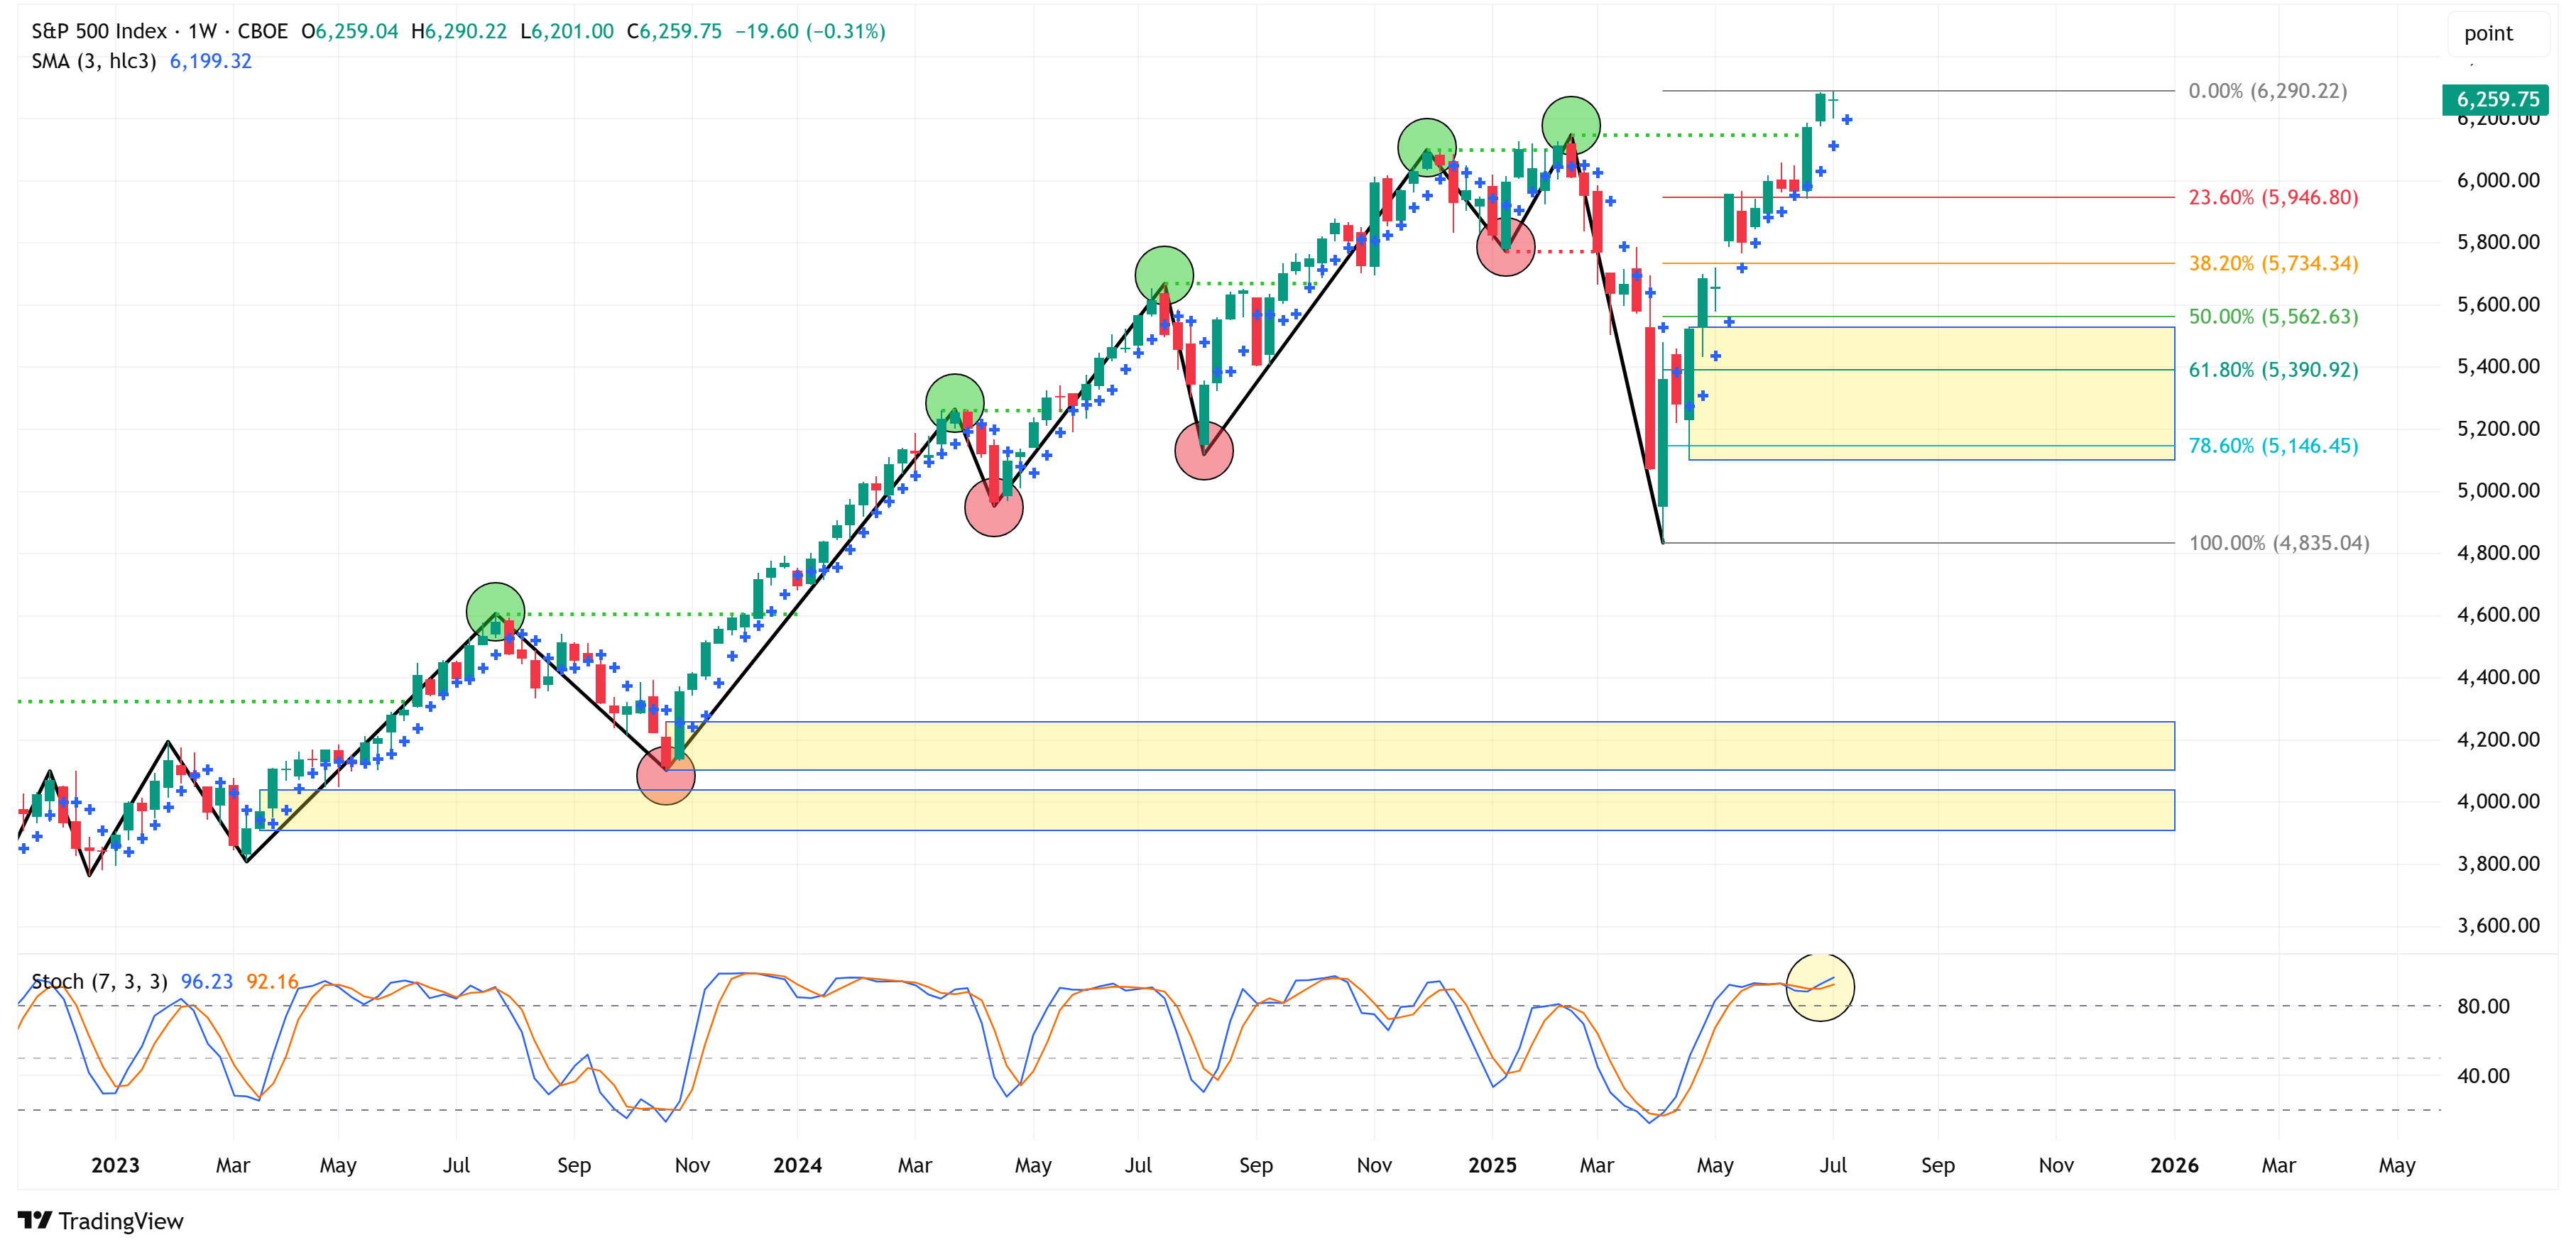
As always, let’s start by looking at the weekly chart.
The S&P 500 ended the week lower by -0.31% after trading at new all-time highs intra-week.
The weekly chart remains bullish.
The first sign of perceived weakness will be when we see a weekly close “below the dot” (i.e., the blue cross mark noted on the chart). So far, that hasn’t happened in this most recent bull run.

Let’s turn now to the 4-hour chart to see if we can get an early look at any possible trend changes.
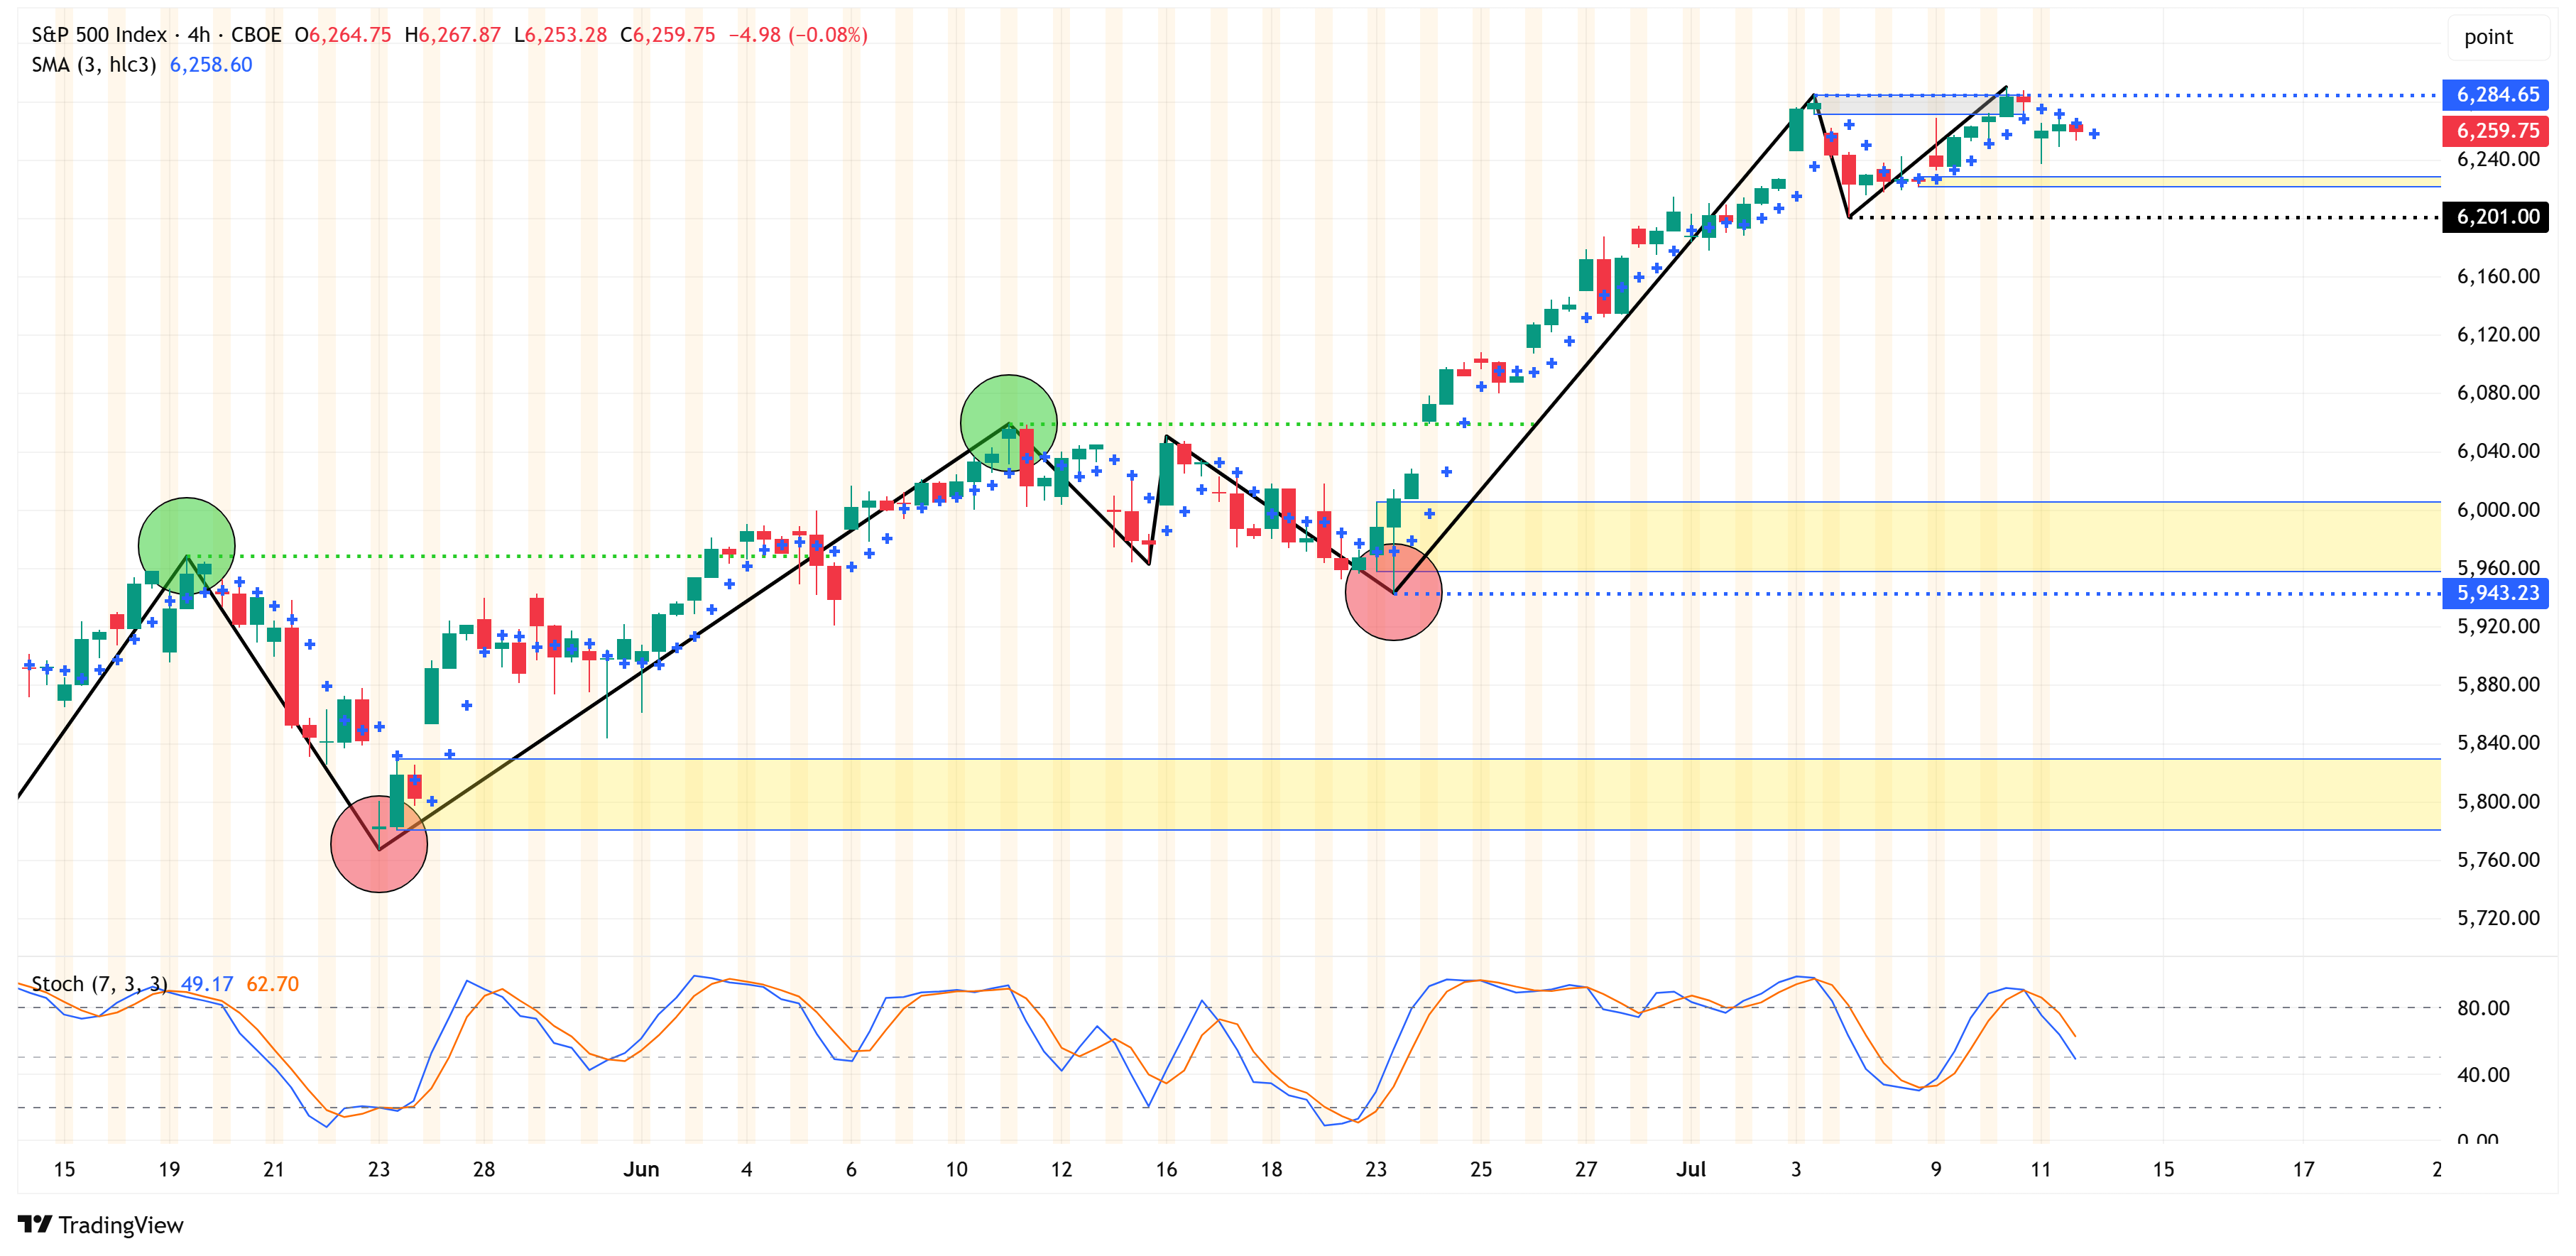
The 4-hour chart provides some interesting insight this week.
The 4-hour chart remains bullish; however, it is interesting to note that it tried twice to close above 6,284.65 but was unable to do so.
This doesn’t negate the bullish call, but it does suggest some of the momentum is slowing. We can also see this by looking at the stochastic indicator in the bottom panel.
As it stands right now, we want to see a close above 6,284.65 on the 4-hour chart for the bullish narrative to continue.
A close below 6,201.00 would be your first sign that things are beginning to weaken, and a close below 5,943.23 would shift the 4-hour chart from bullish to bearish.
A bearish turn on the 4-hour chart has the potential to lead to a bearish turn on the weekly chart; however, remember that on the weekly chart, we’re focused on a weekly close “below the dot,” which is currently 6,199.32.
To summarize, the S&P 500 remains bullish, but the momentum is slowing. If the S&P 500 starts to roll over, the initial target is the yellow box, which has a price range of 5,528.11 to 5,101.63.
The following sections are for paid subscribers only.
In these sections, we will discuss our proprietary:
S&P 500 Fair Value Model
This model provides a guide for:
a) How far the S&P 500 could decline in the next recession.
b) When to get back into the market after it has declined.
The Market Map - Extended Analysis
We will call out specific price objectives (up trends vs. down trends, targets, stop losses, etc.) on the following:
Major US Indices
11 Major US Equity Sectors
US Treasuries
Currencies
Commodities
Fixed Income
If you would like exclusive access to the proprietary data below, please become a paid subscriber today! Use the button below for a “15% Discount” for life!
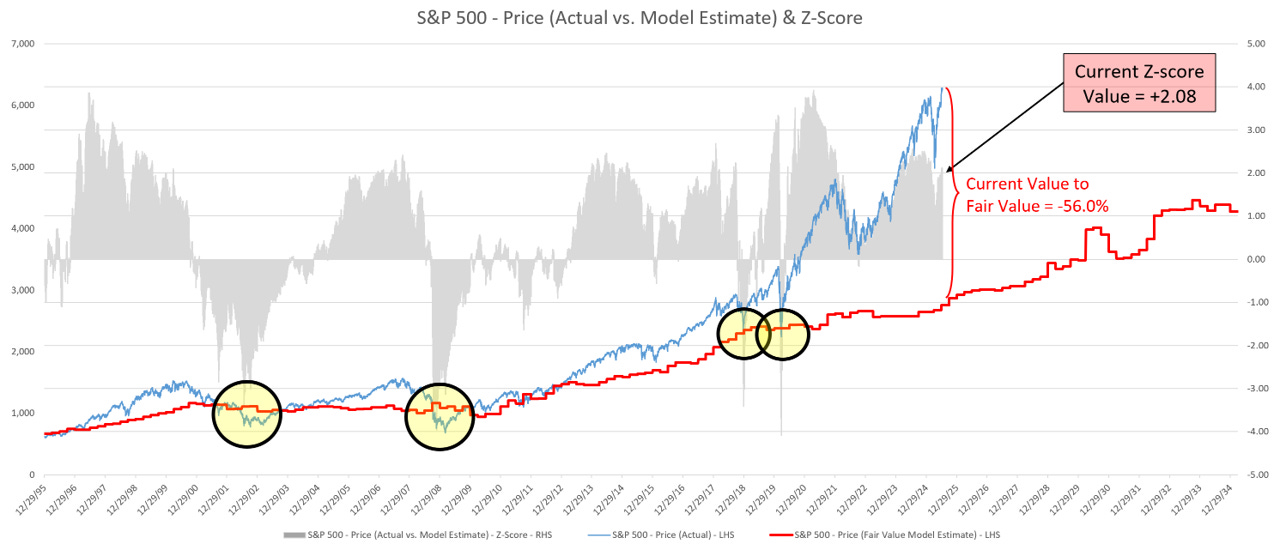
S&P 500 Fair Value Model
Here are the updated results from our proprietary S&P 500 fair value model.
The red line in the chart below is the fair value we have constructed for the S&P 500. Based on our model, the current fair value for the S&P 500 is 2,752.34.
Friday’s close on the S&P 500 was 6,259.74.
This means it would take a decline of -56.0% from the S&P 500’s current value to achieve our model-derived fair value.
Note: The market can remain well above fair value for extended periods. However, in deeper corrections (i.e., 2002, 2008, 2018, 2020, and in previous historical periods not shown on the chart below), the market always corrects back to the fair value line and often well below the fair value line (i.e., 2002, 2008, etc).
The Market Map - Extended Analysis
The following charts use the weekly time frame. Therefore, price targets and/or stop losses are expected to be achieved over the medium (3 months) to longer (12 months) term.
Note: The content of this newsletter is for educational purposes only. Price targets and/or stop losses should not be considered a recommendation to buy or sell any security. Please do your research and consult with a professional before making any investment decisions.
Chart Notes:
📈📉Trend = Structural bias of the market.
⬆️ = the market is currently in a bullish trend and therefore should move higher over the medium term.
⬇️ = the market is currently in a bearish trend and therefore should move lower over the medium term.
🎯 Target = the price we believe (although not guaranteed) the market will achieve over the medium term.
“Undefined (see 4-hour timeframe)” = we use this description when markets close at new all-time highs and we do not have a valid reference point for a target. The path of least resistance is likely higher; however, you should reference the 4-hour timeframe to identify potential turning points.
🛑 Stop Loss = the price at which our target price objective has been negated, and we need to reassess the structural trend bias of the market.
🟨 Yellow Boxes = supply/demand zones that price should gravitate towards over time.
Indices:
S&P 500
📈 Trend = ⬆️ / 🎯 Target = 6,290 / 🛑 Stop Loss = 4,835
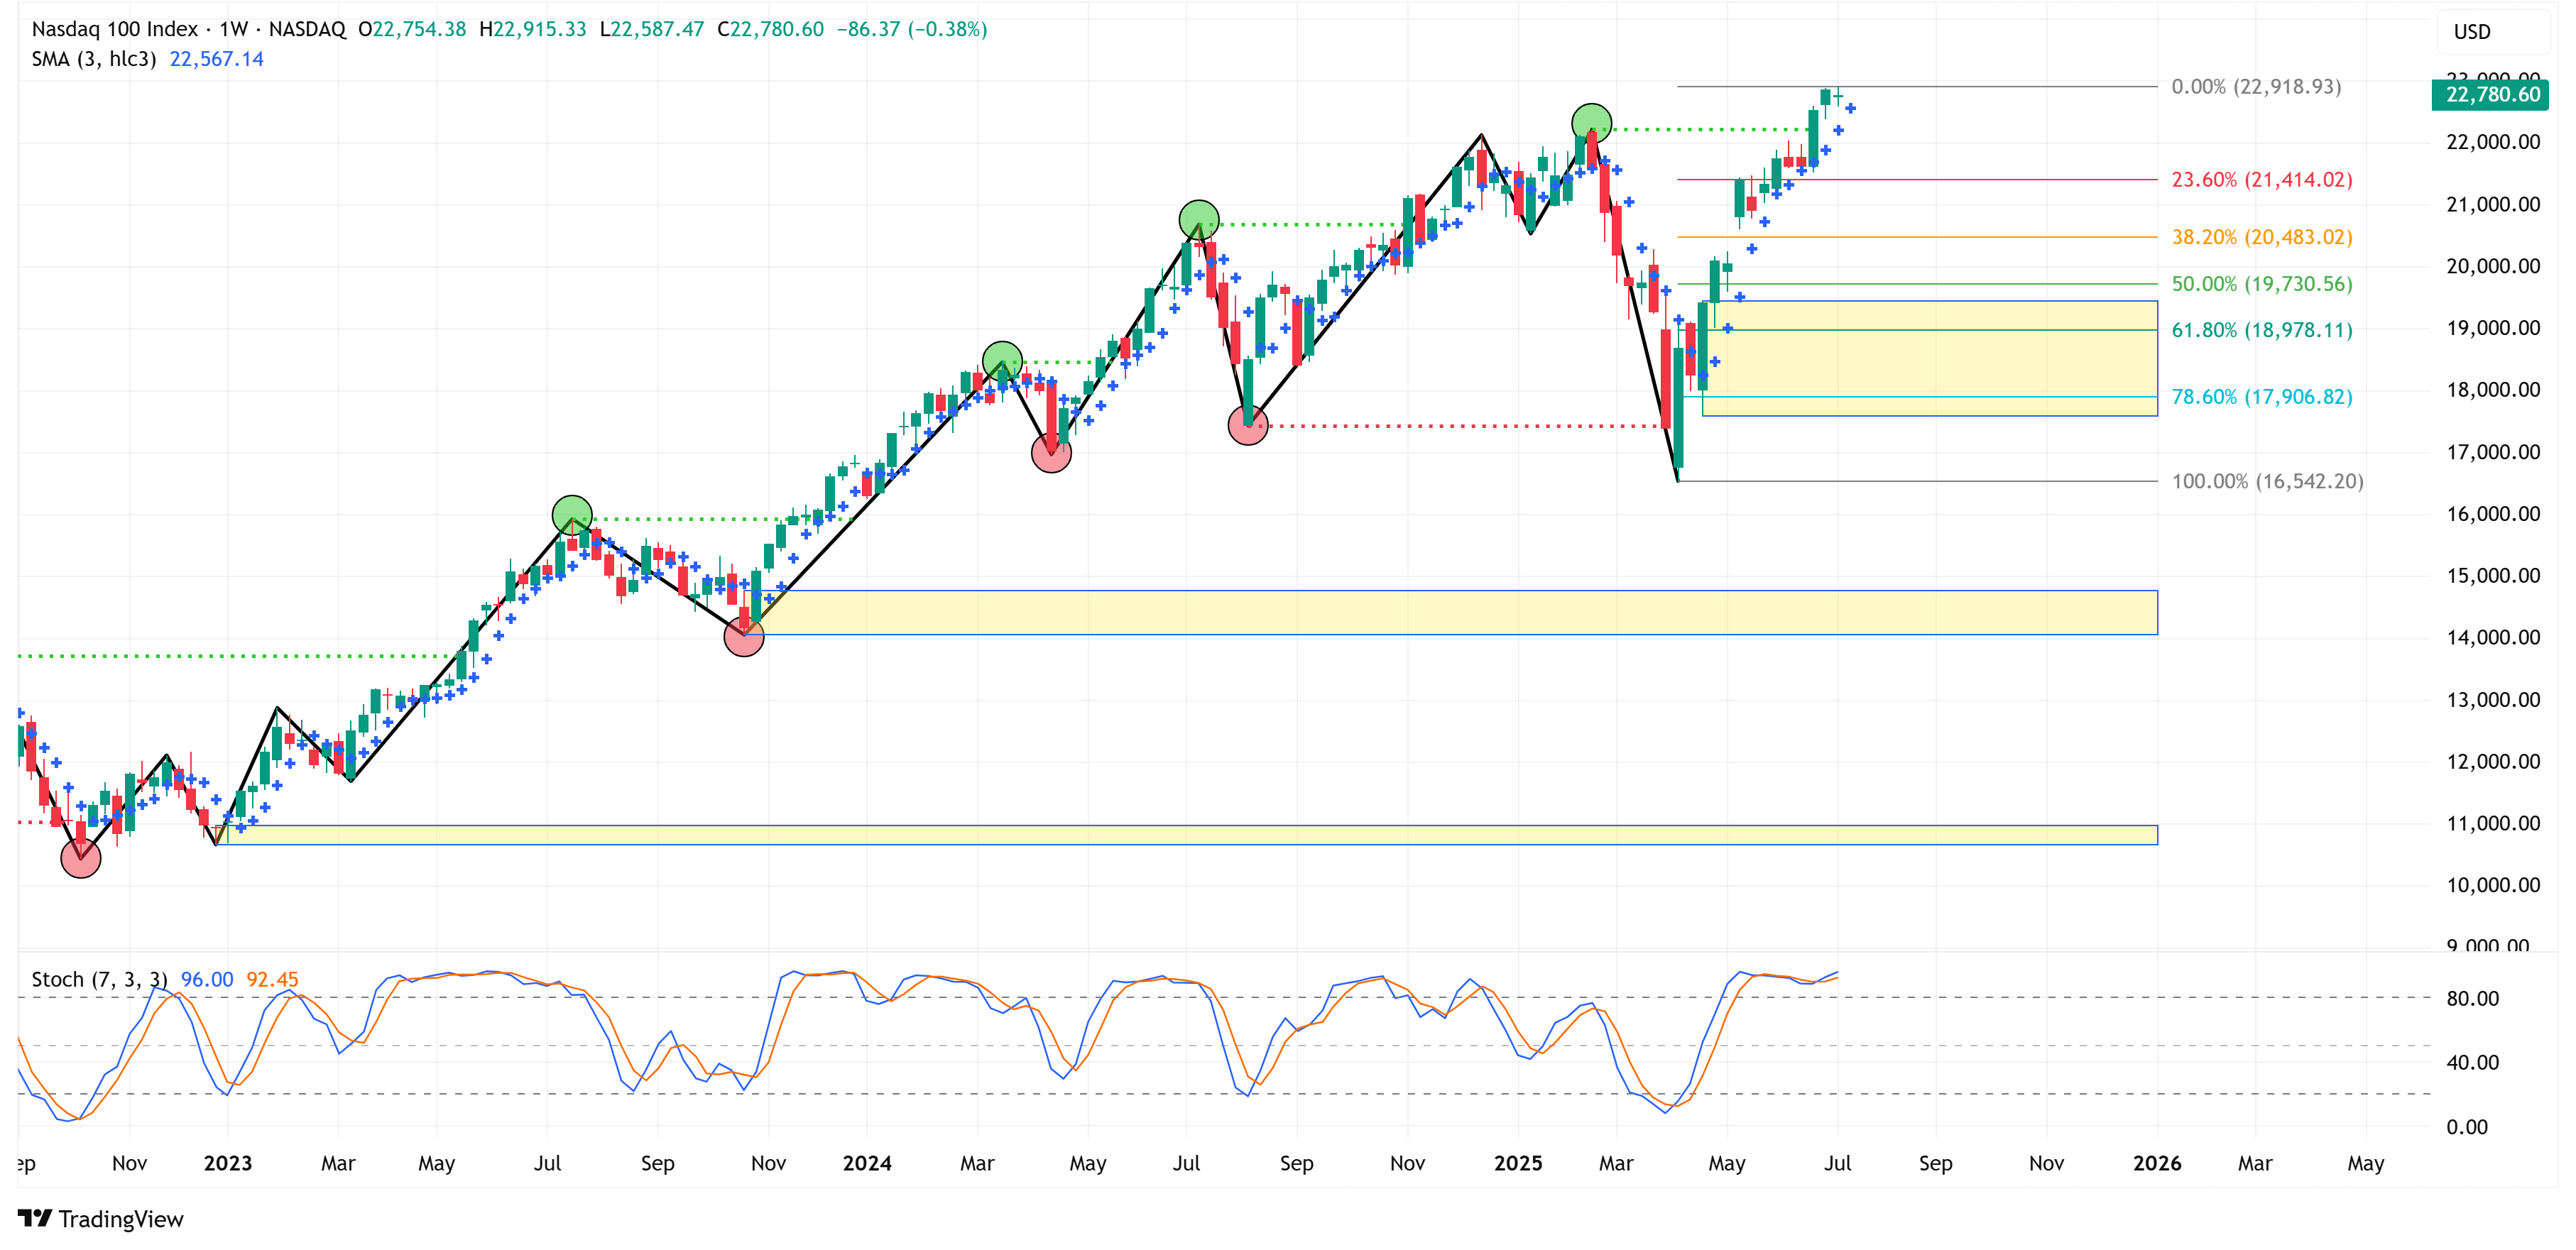
NASDAQ 100
📈 Trend = ⬆️ / 🎯 Target = 22,919 / 🛑 Stop Loss = 16,542
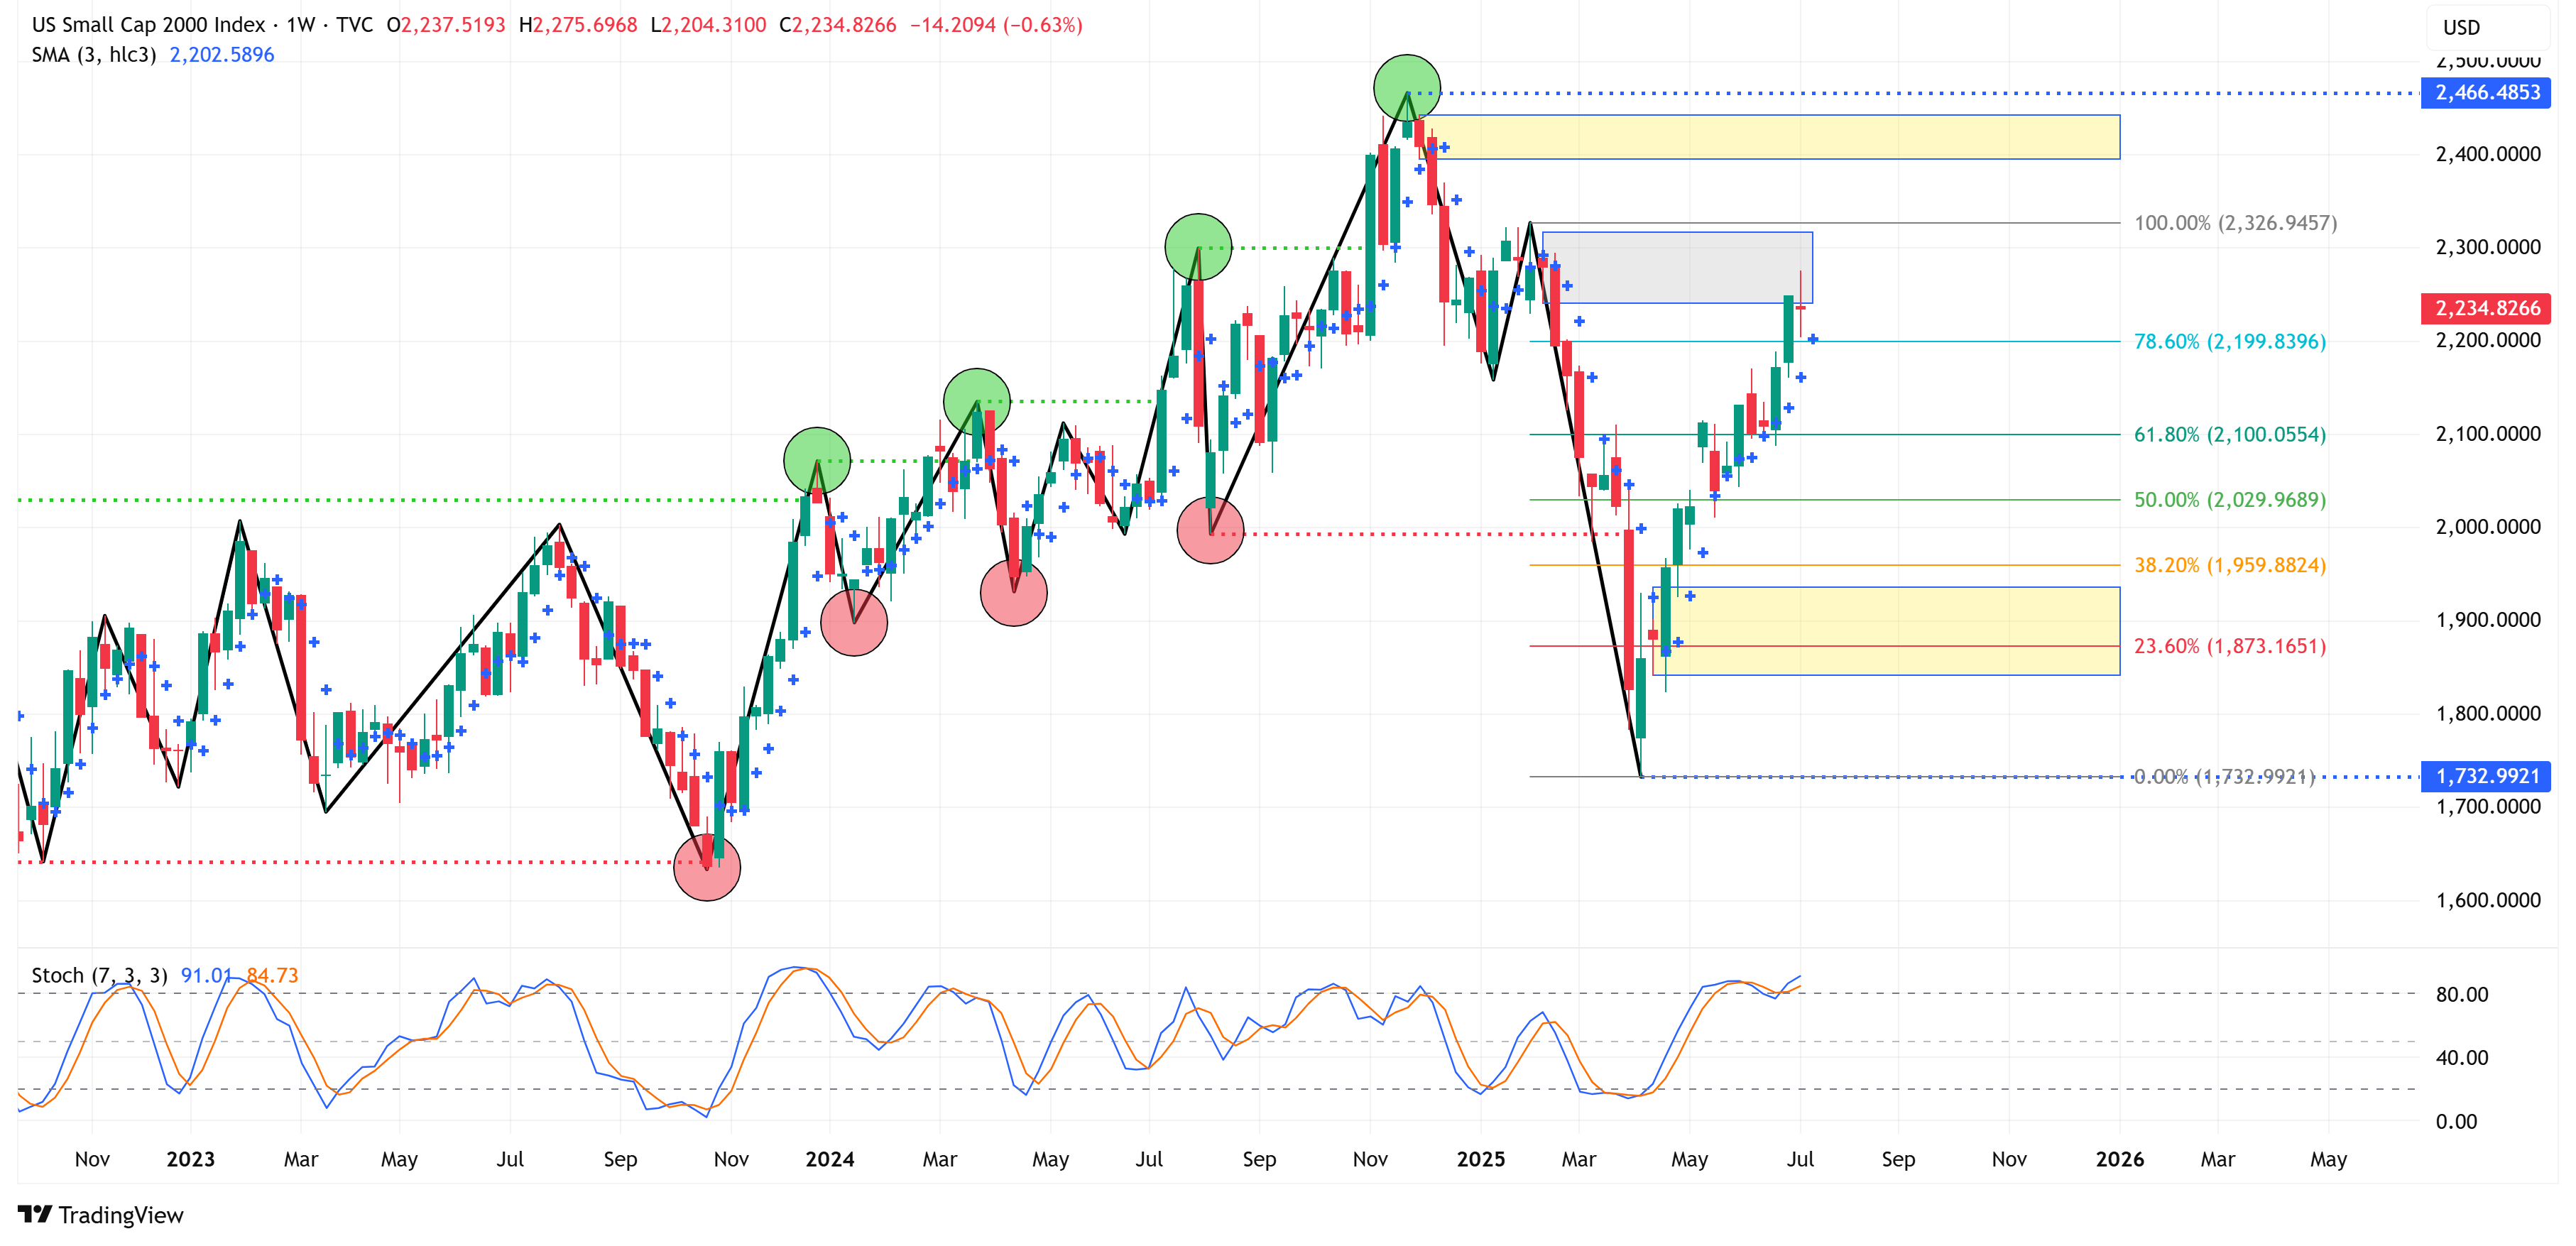
Russell 2000
📉 Trend = ⬇️ / 🎯 Target = 1,733 / 🛑 Stop Loss = 2,466
Sectors:
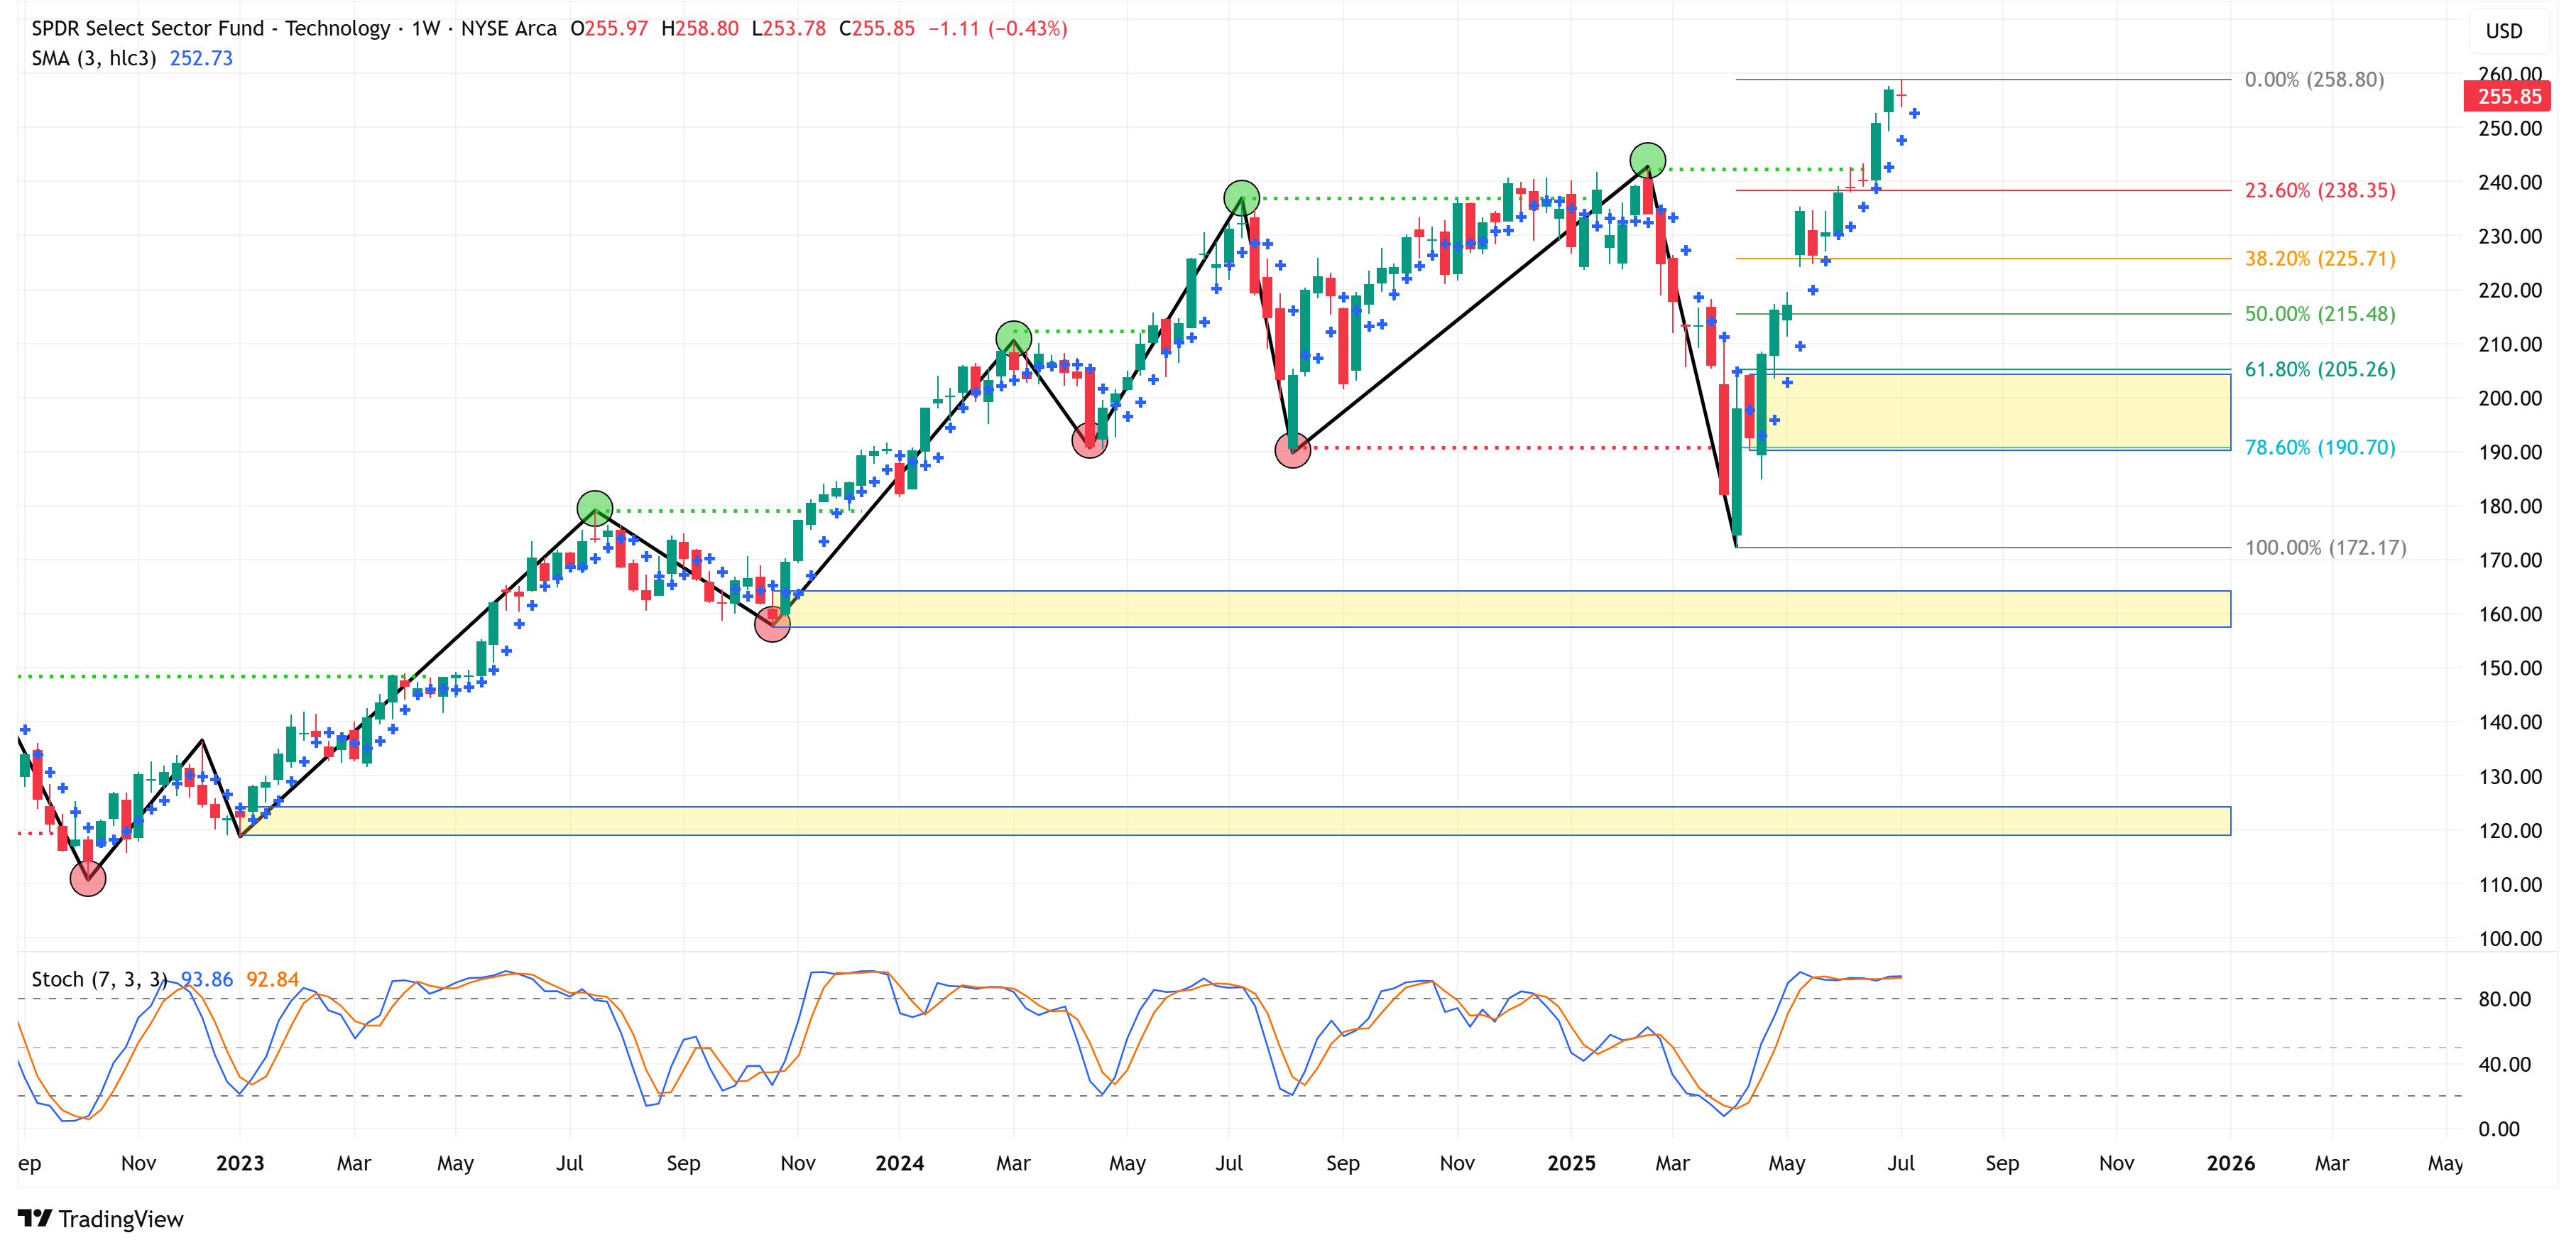
Technology
📈 Trend = ⬆️ / 🎯Target = 258.80 / 🛑Stop Loss = 172.17
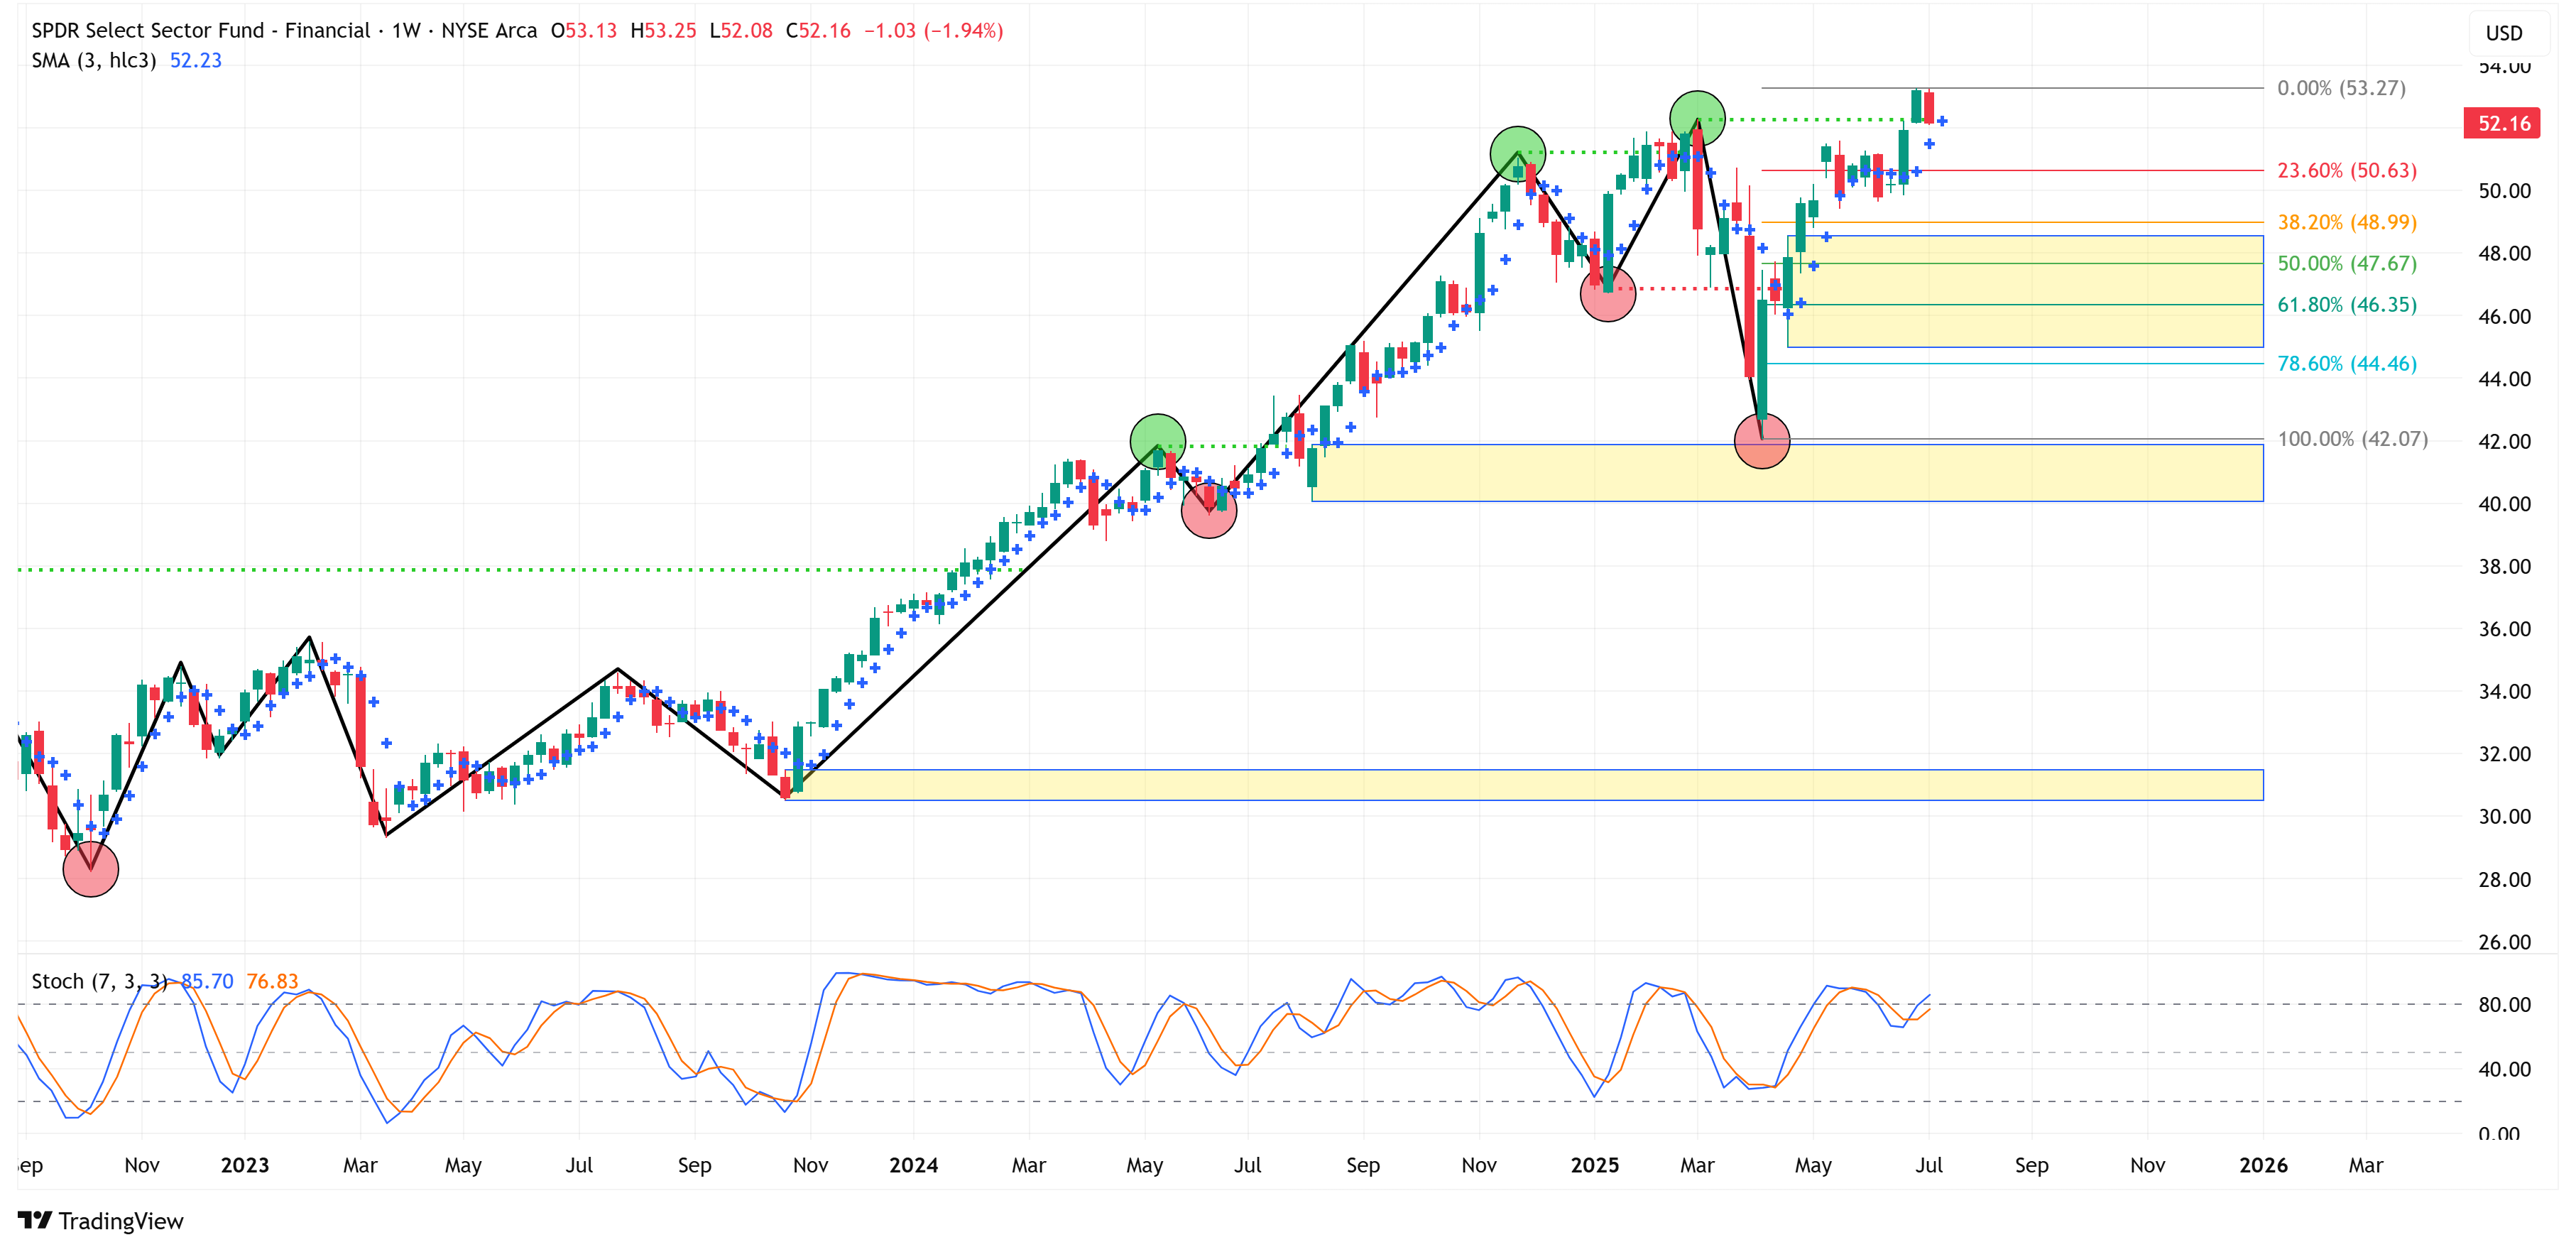
Financial
📈 Trend = ⬆️ / 🎯 Target = 53.27 / 🛑 Stop Loss = 42.07
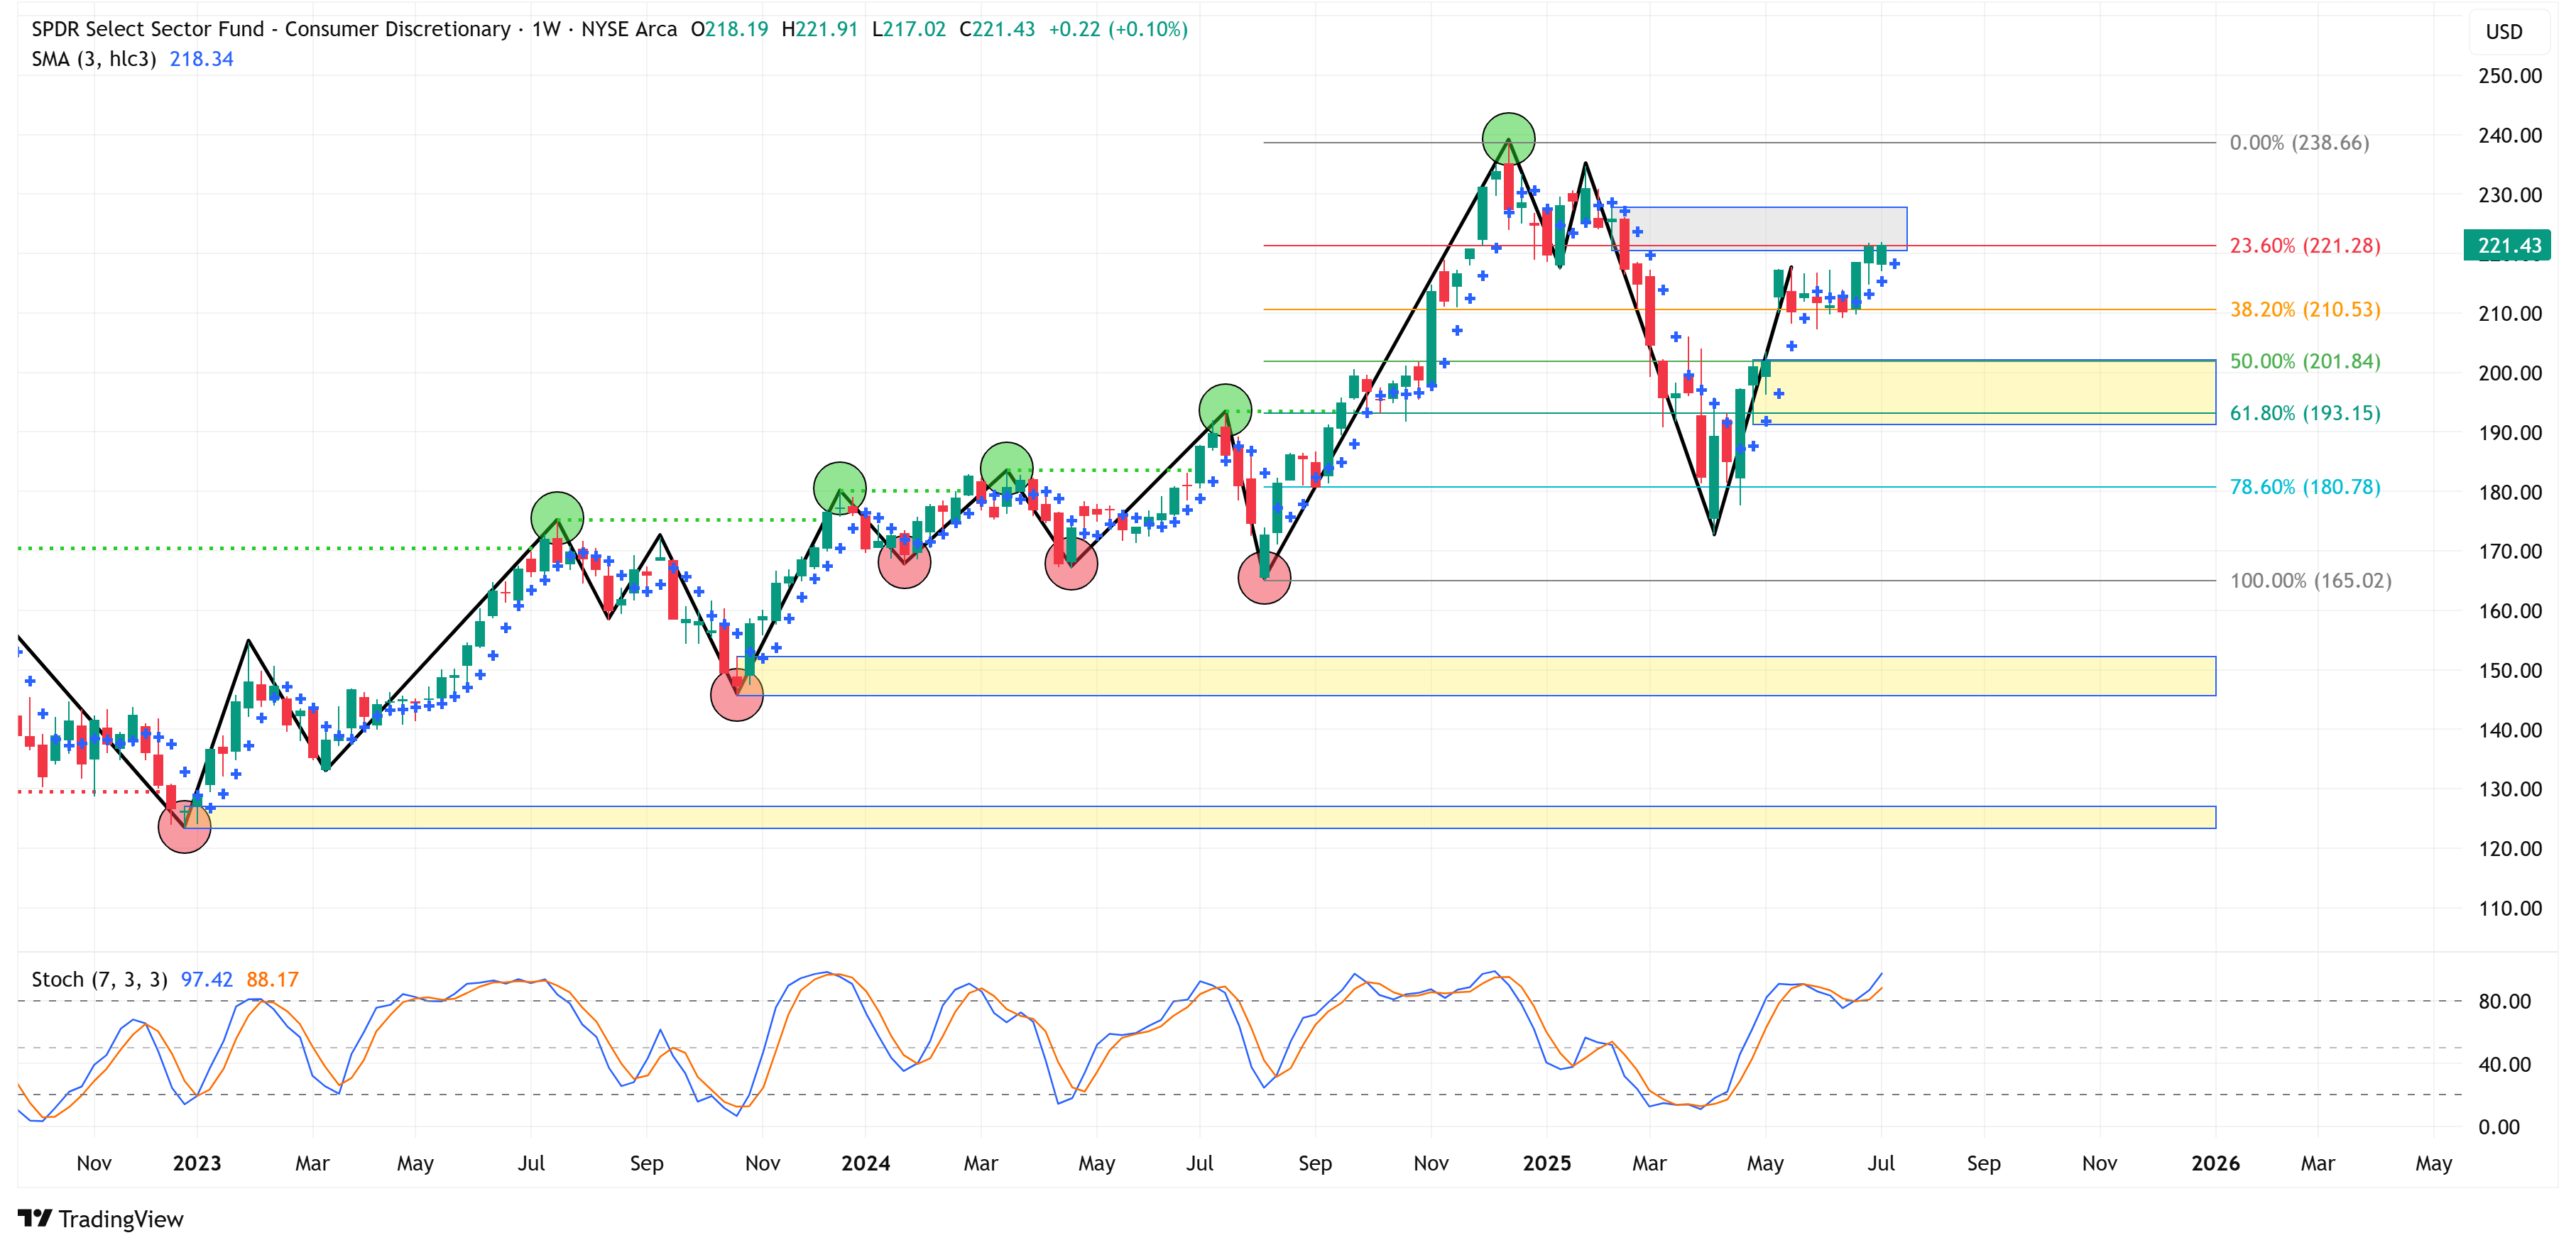
Consumer Discretionary
📈 Trend = ⬆️ / 🎯 Target = 238.66 / 🛑 Stop Loss = 165.02
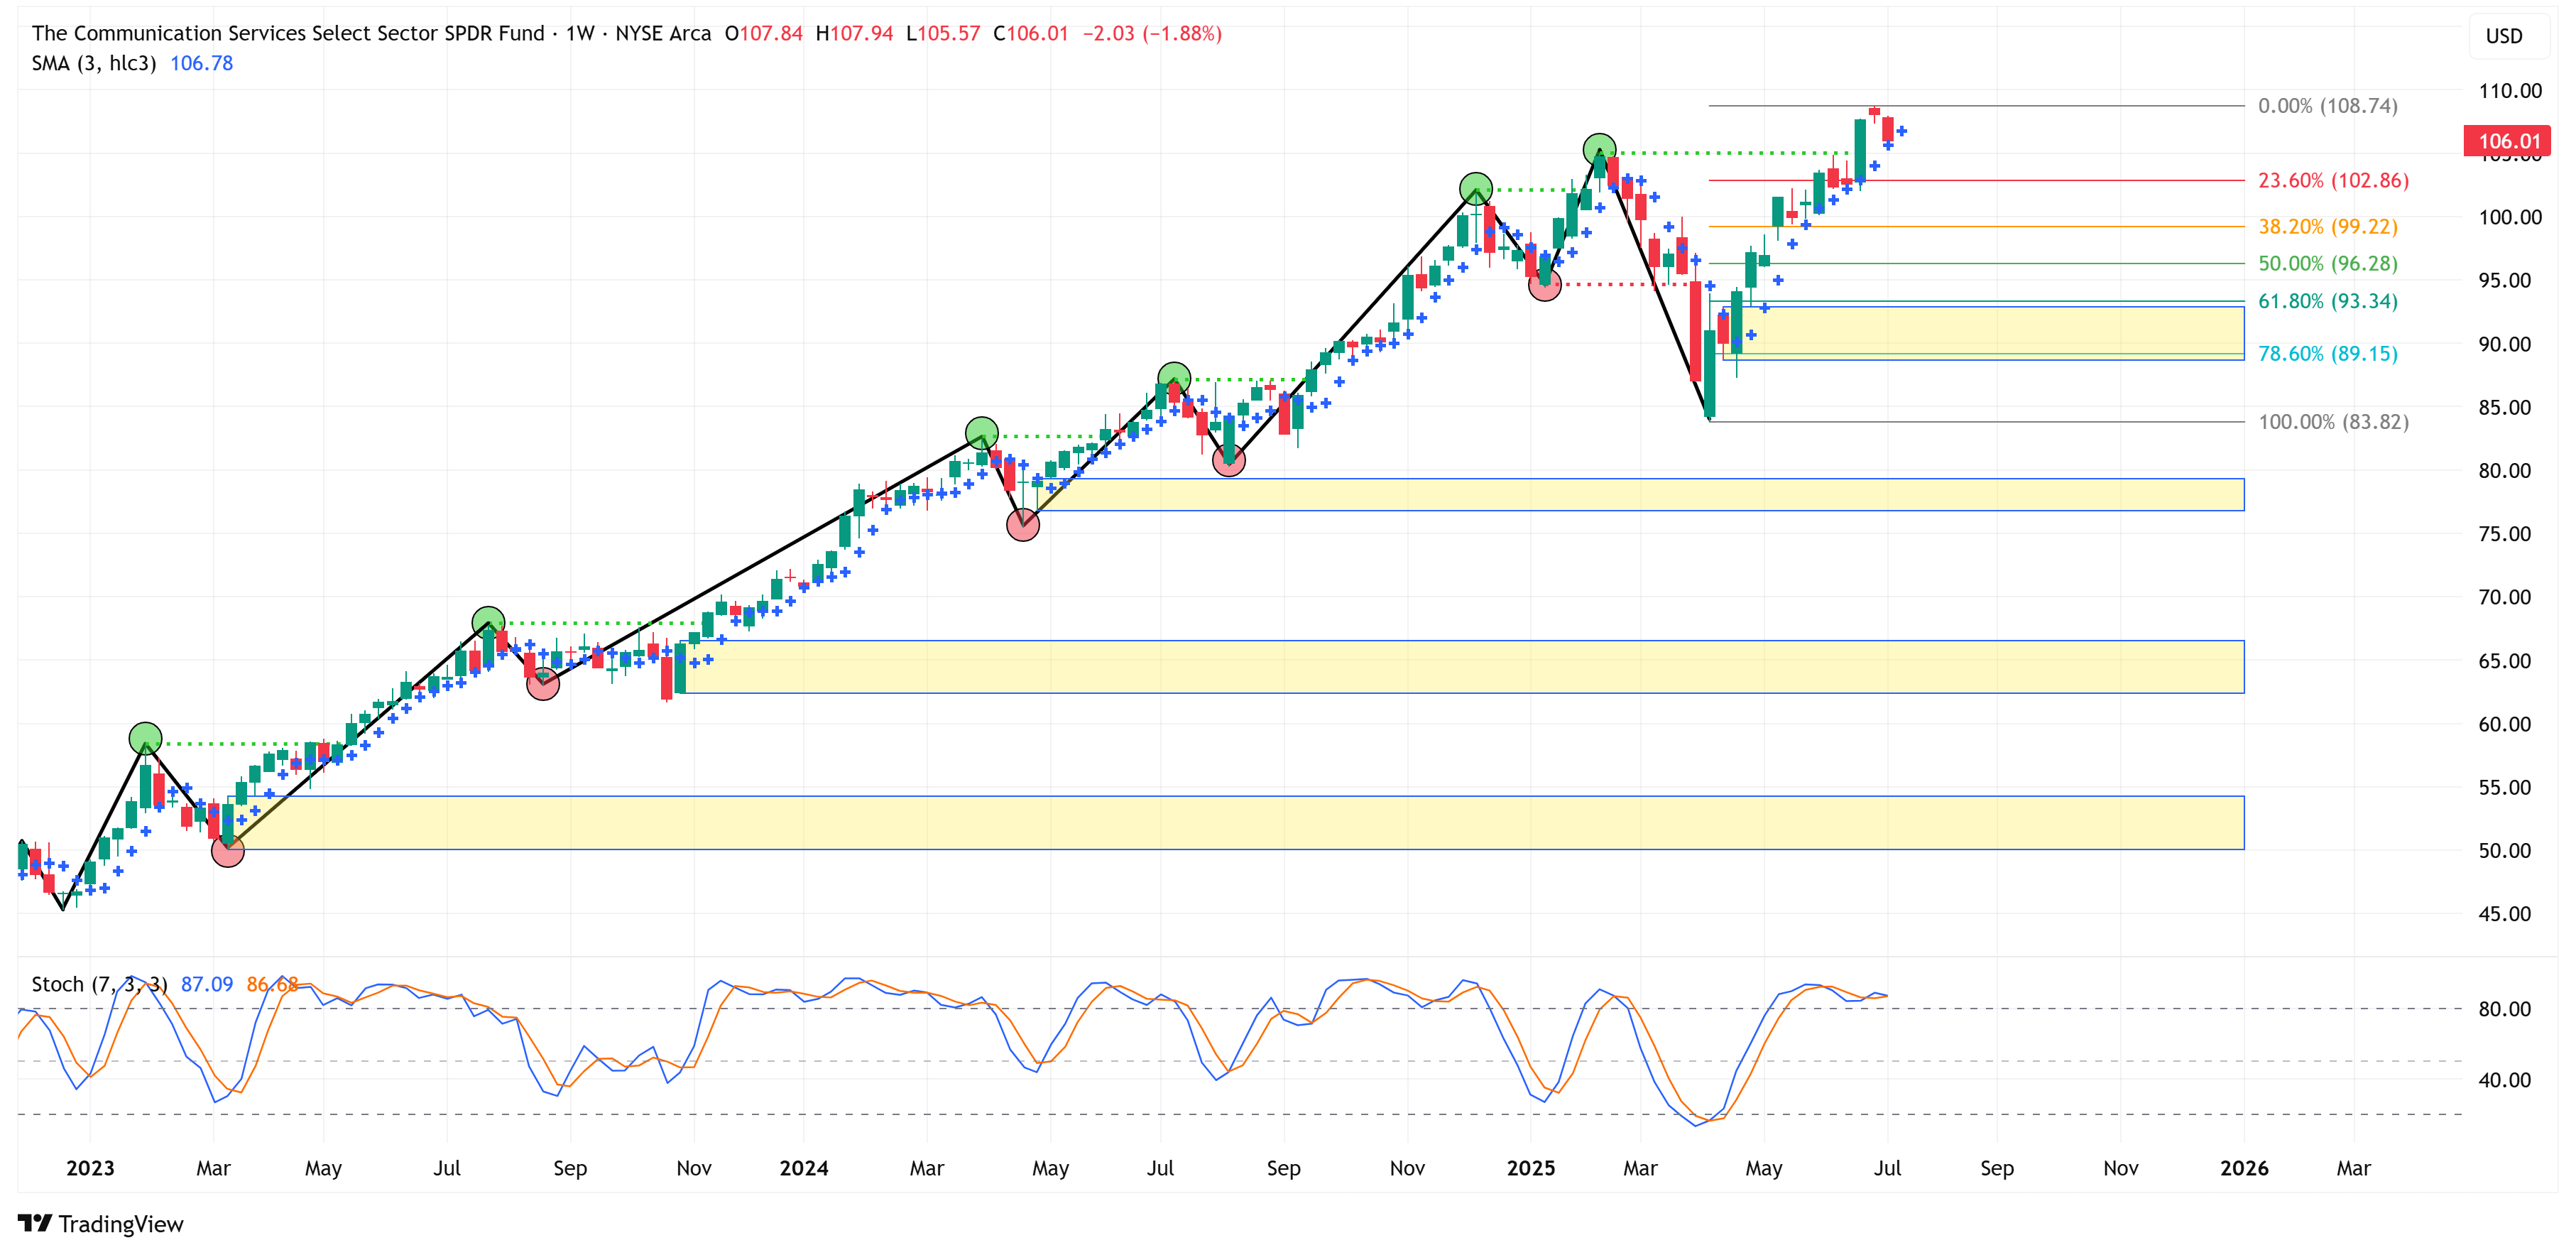
Communication Services
📈 Trend = ⬆️ / 🎯 Target = 108.74 / 🛑 Stop Loss = 83.82
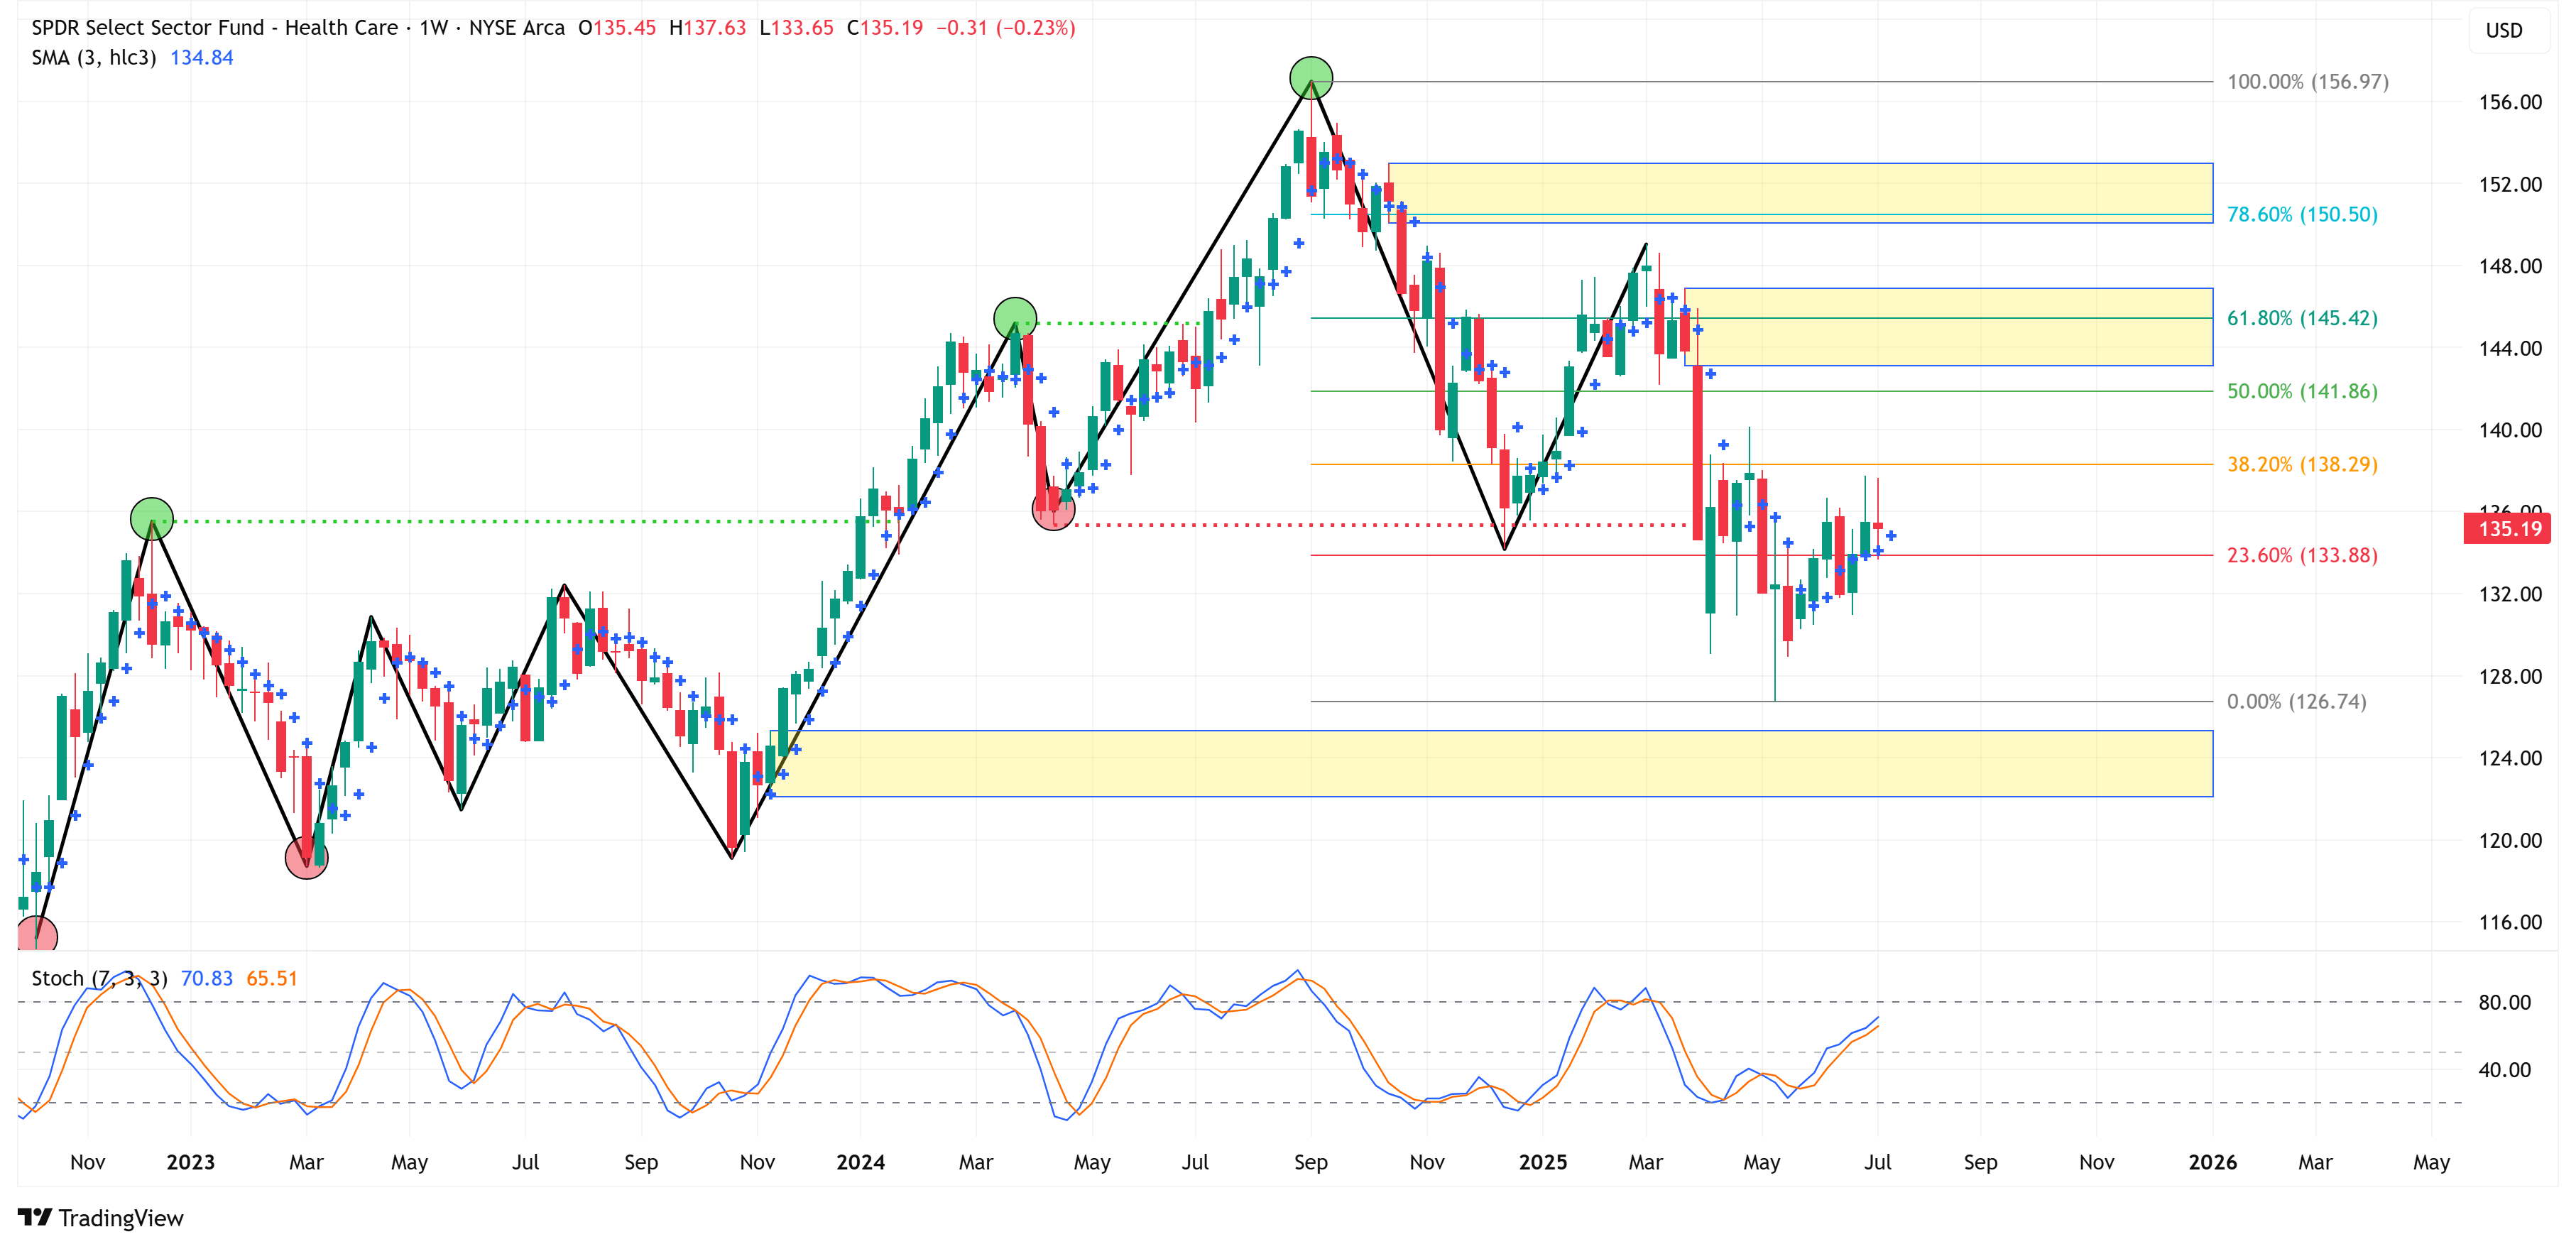
Health Care
📉 Trend = ⬇️ / 🎯 Target = 126.74 / 🛑 Stop Loss = 156.97
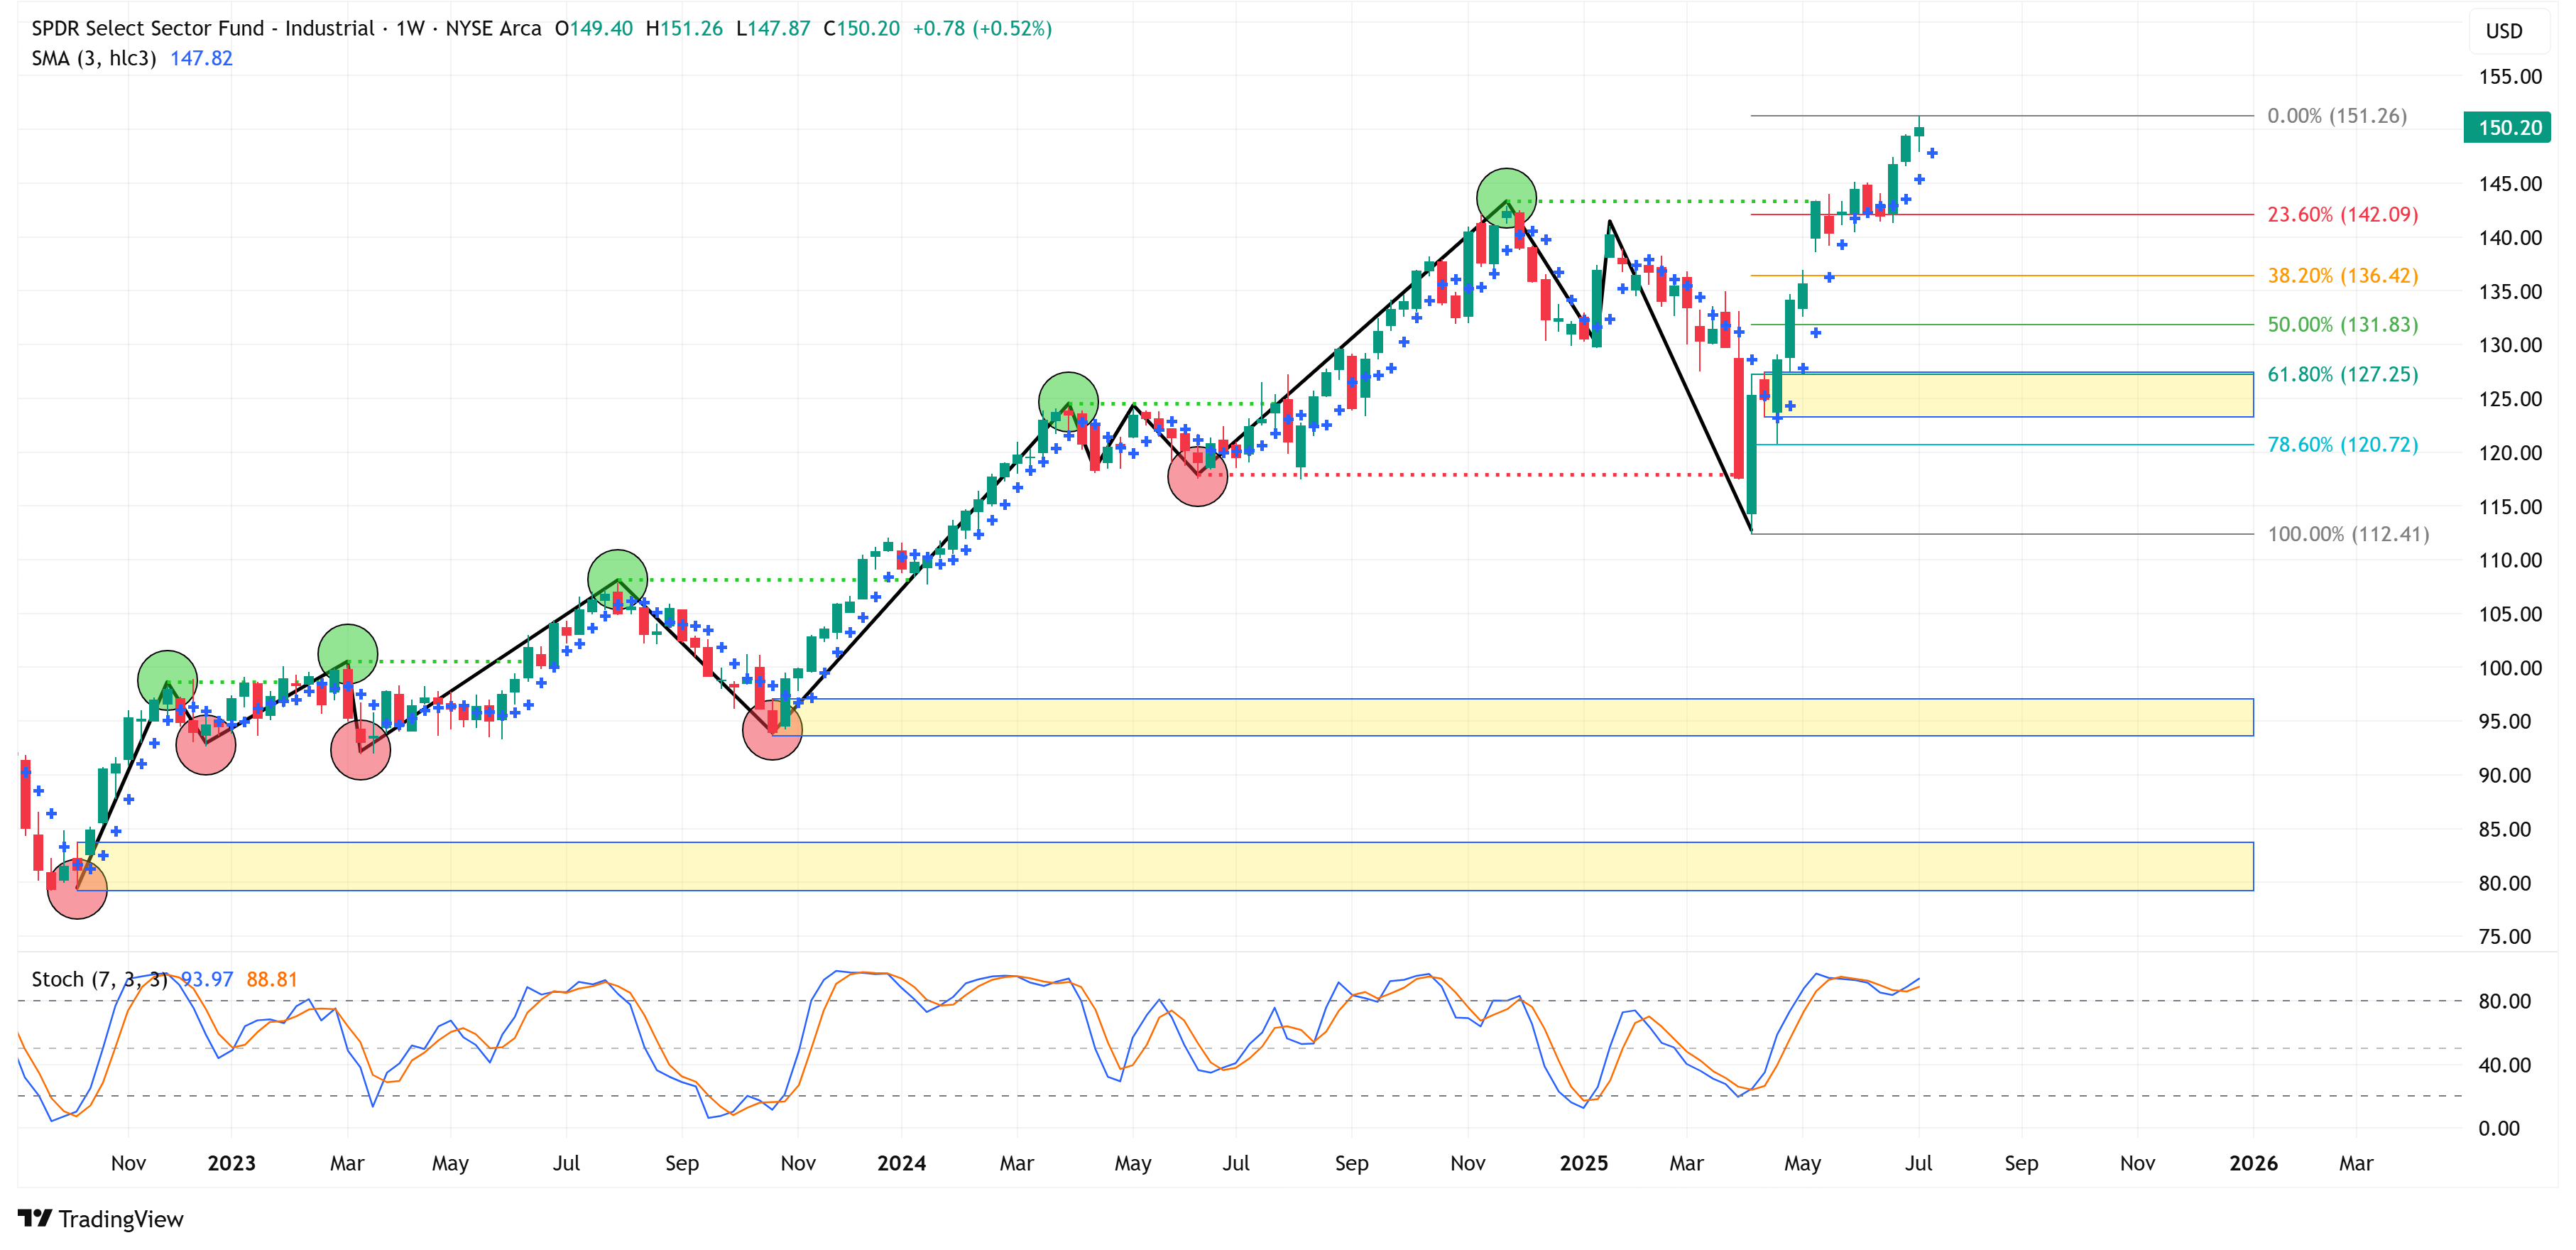
Industrials
📈 Trend = ⬆️ / 🎯 Target = 151.26 / 🛑 Stop Loss = 112.41
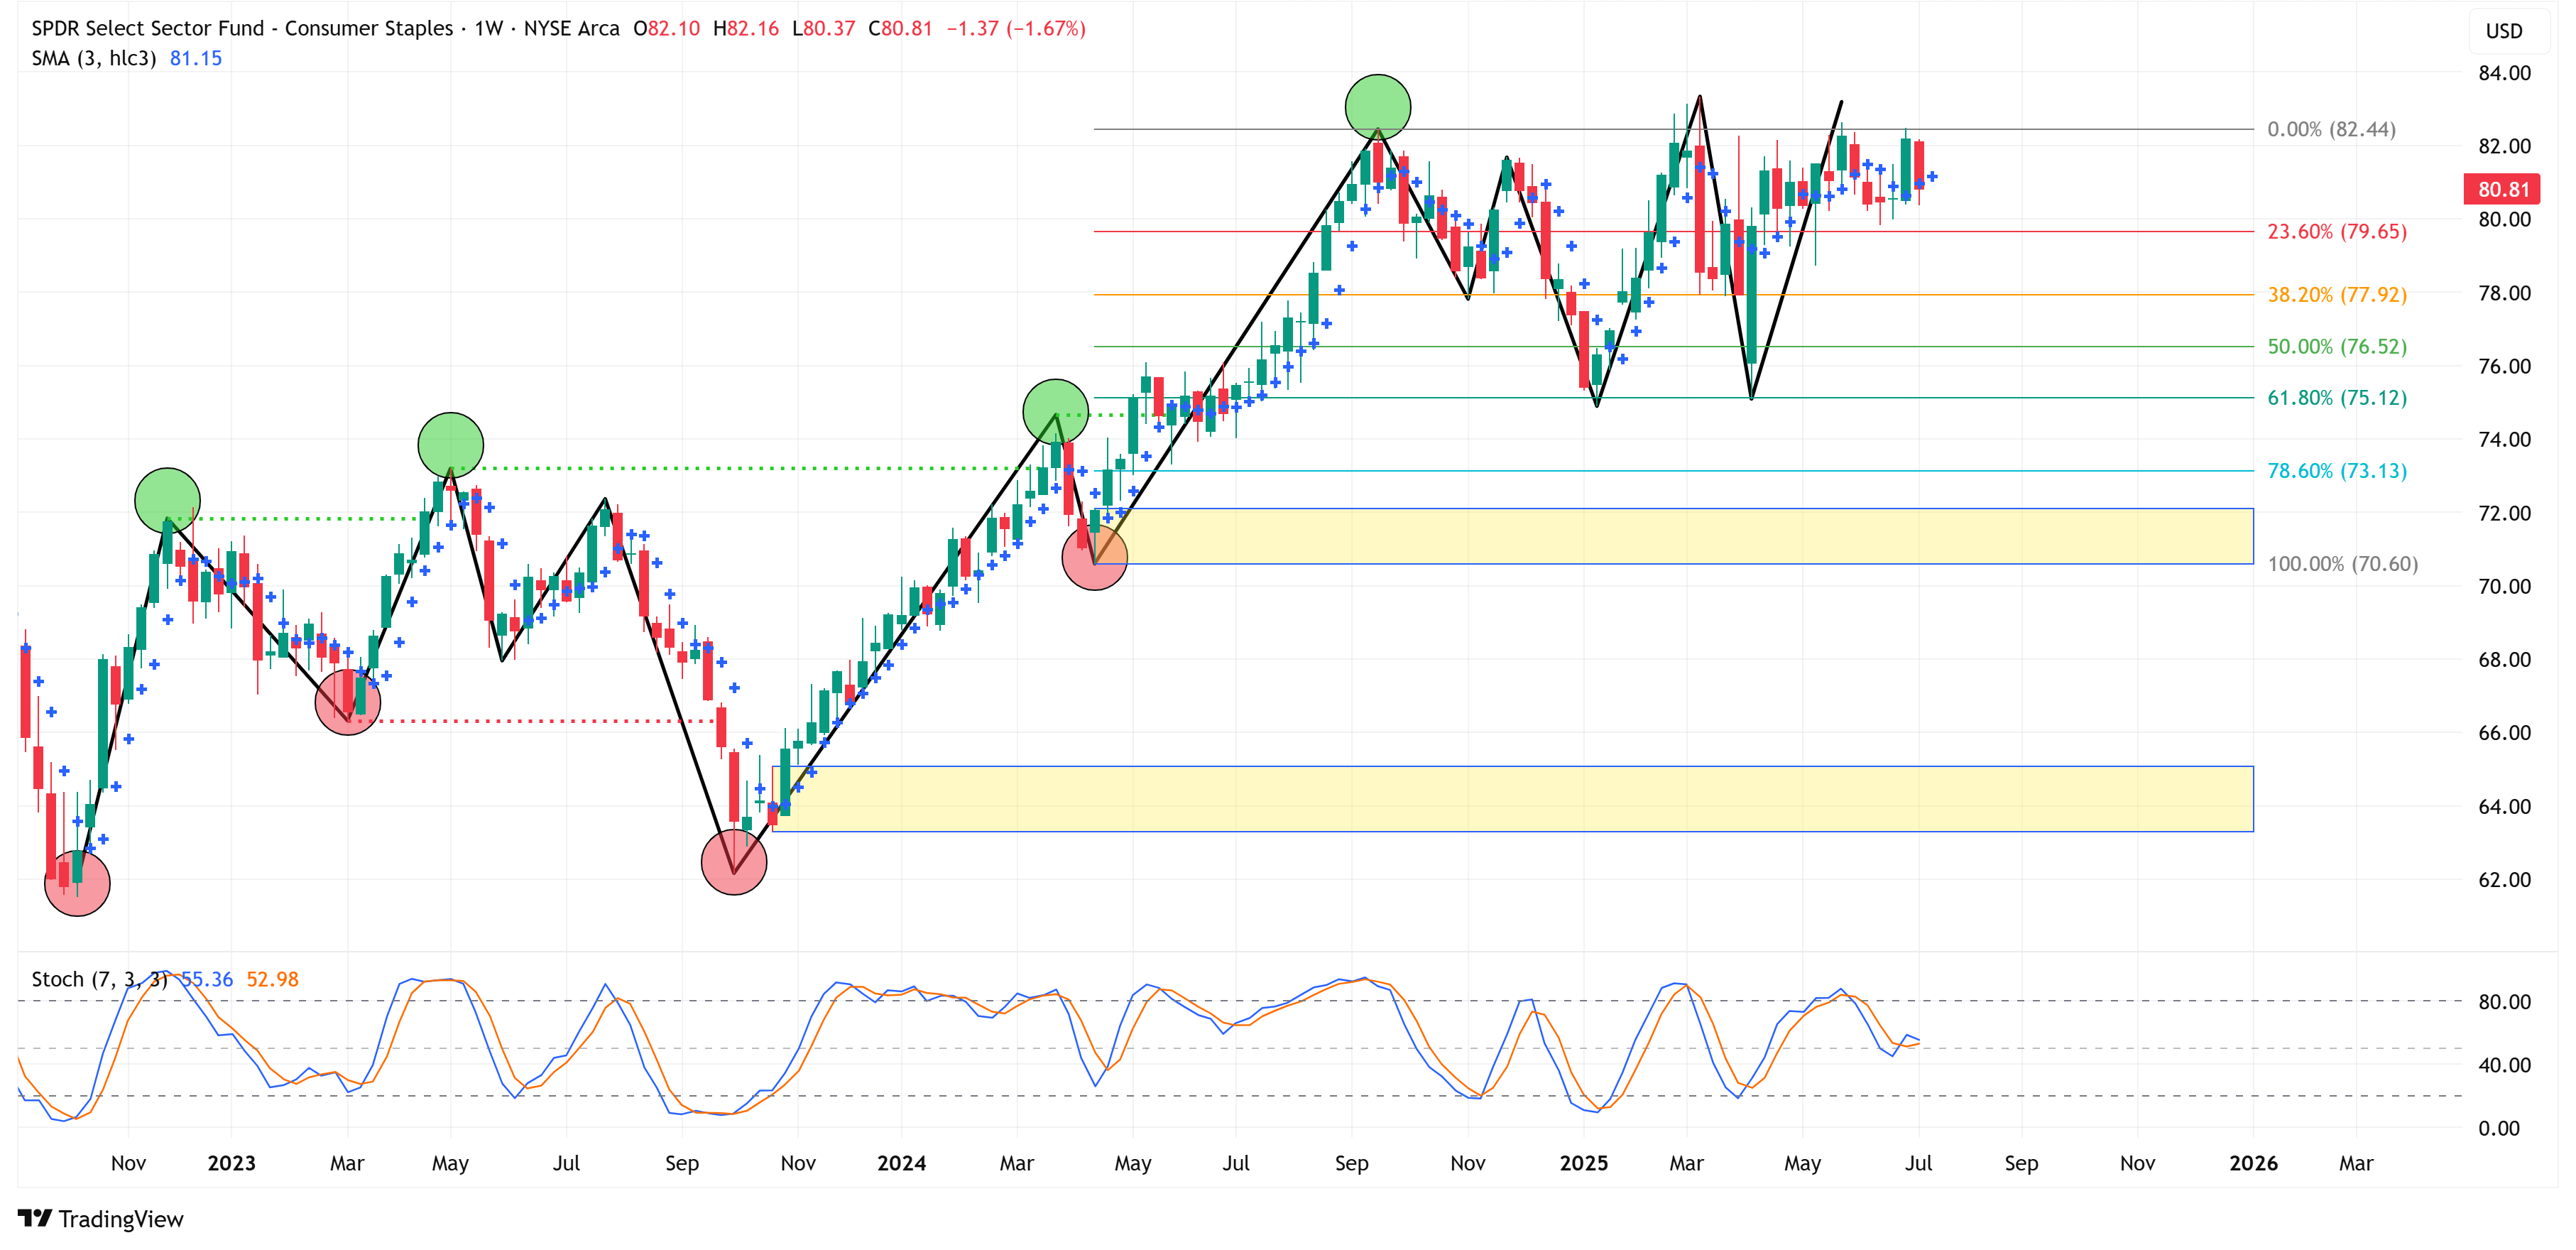
Consumer Staples
📈 Trend = ⬆️ / 🎯 Target = 82.44 / 🛑 Stop Loss = 70.60
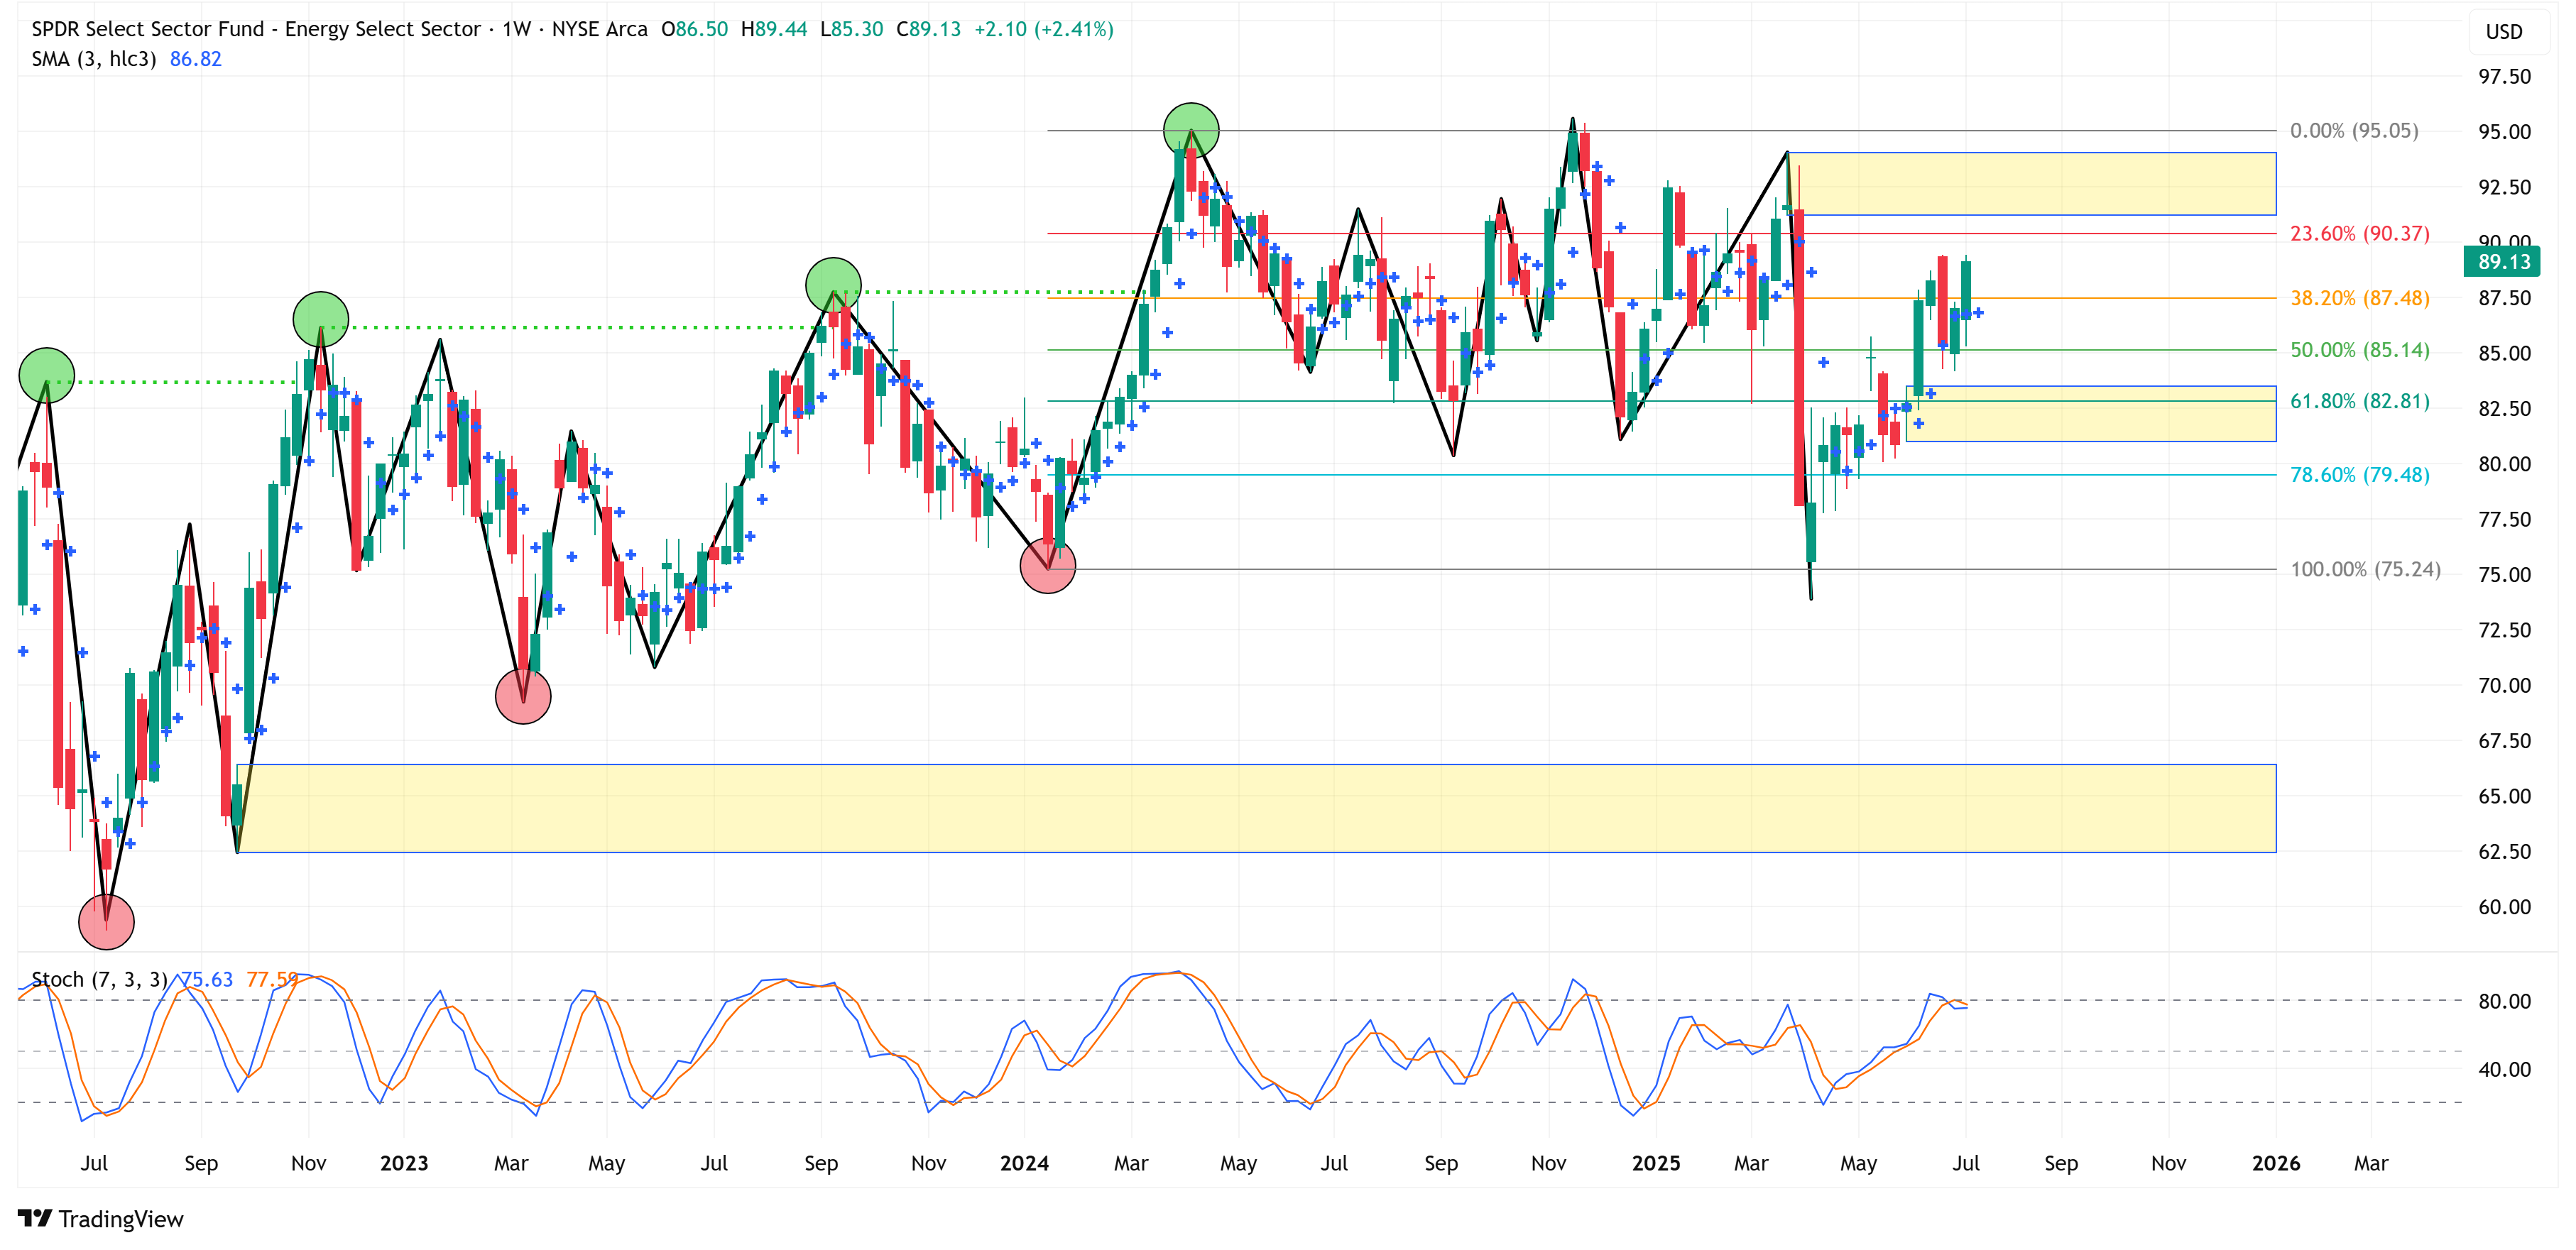
Energy
📈 Trend = ⬆️ / 🎯 Target = 95.05 / 🛑 Stop Loss = 75.24
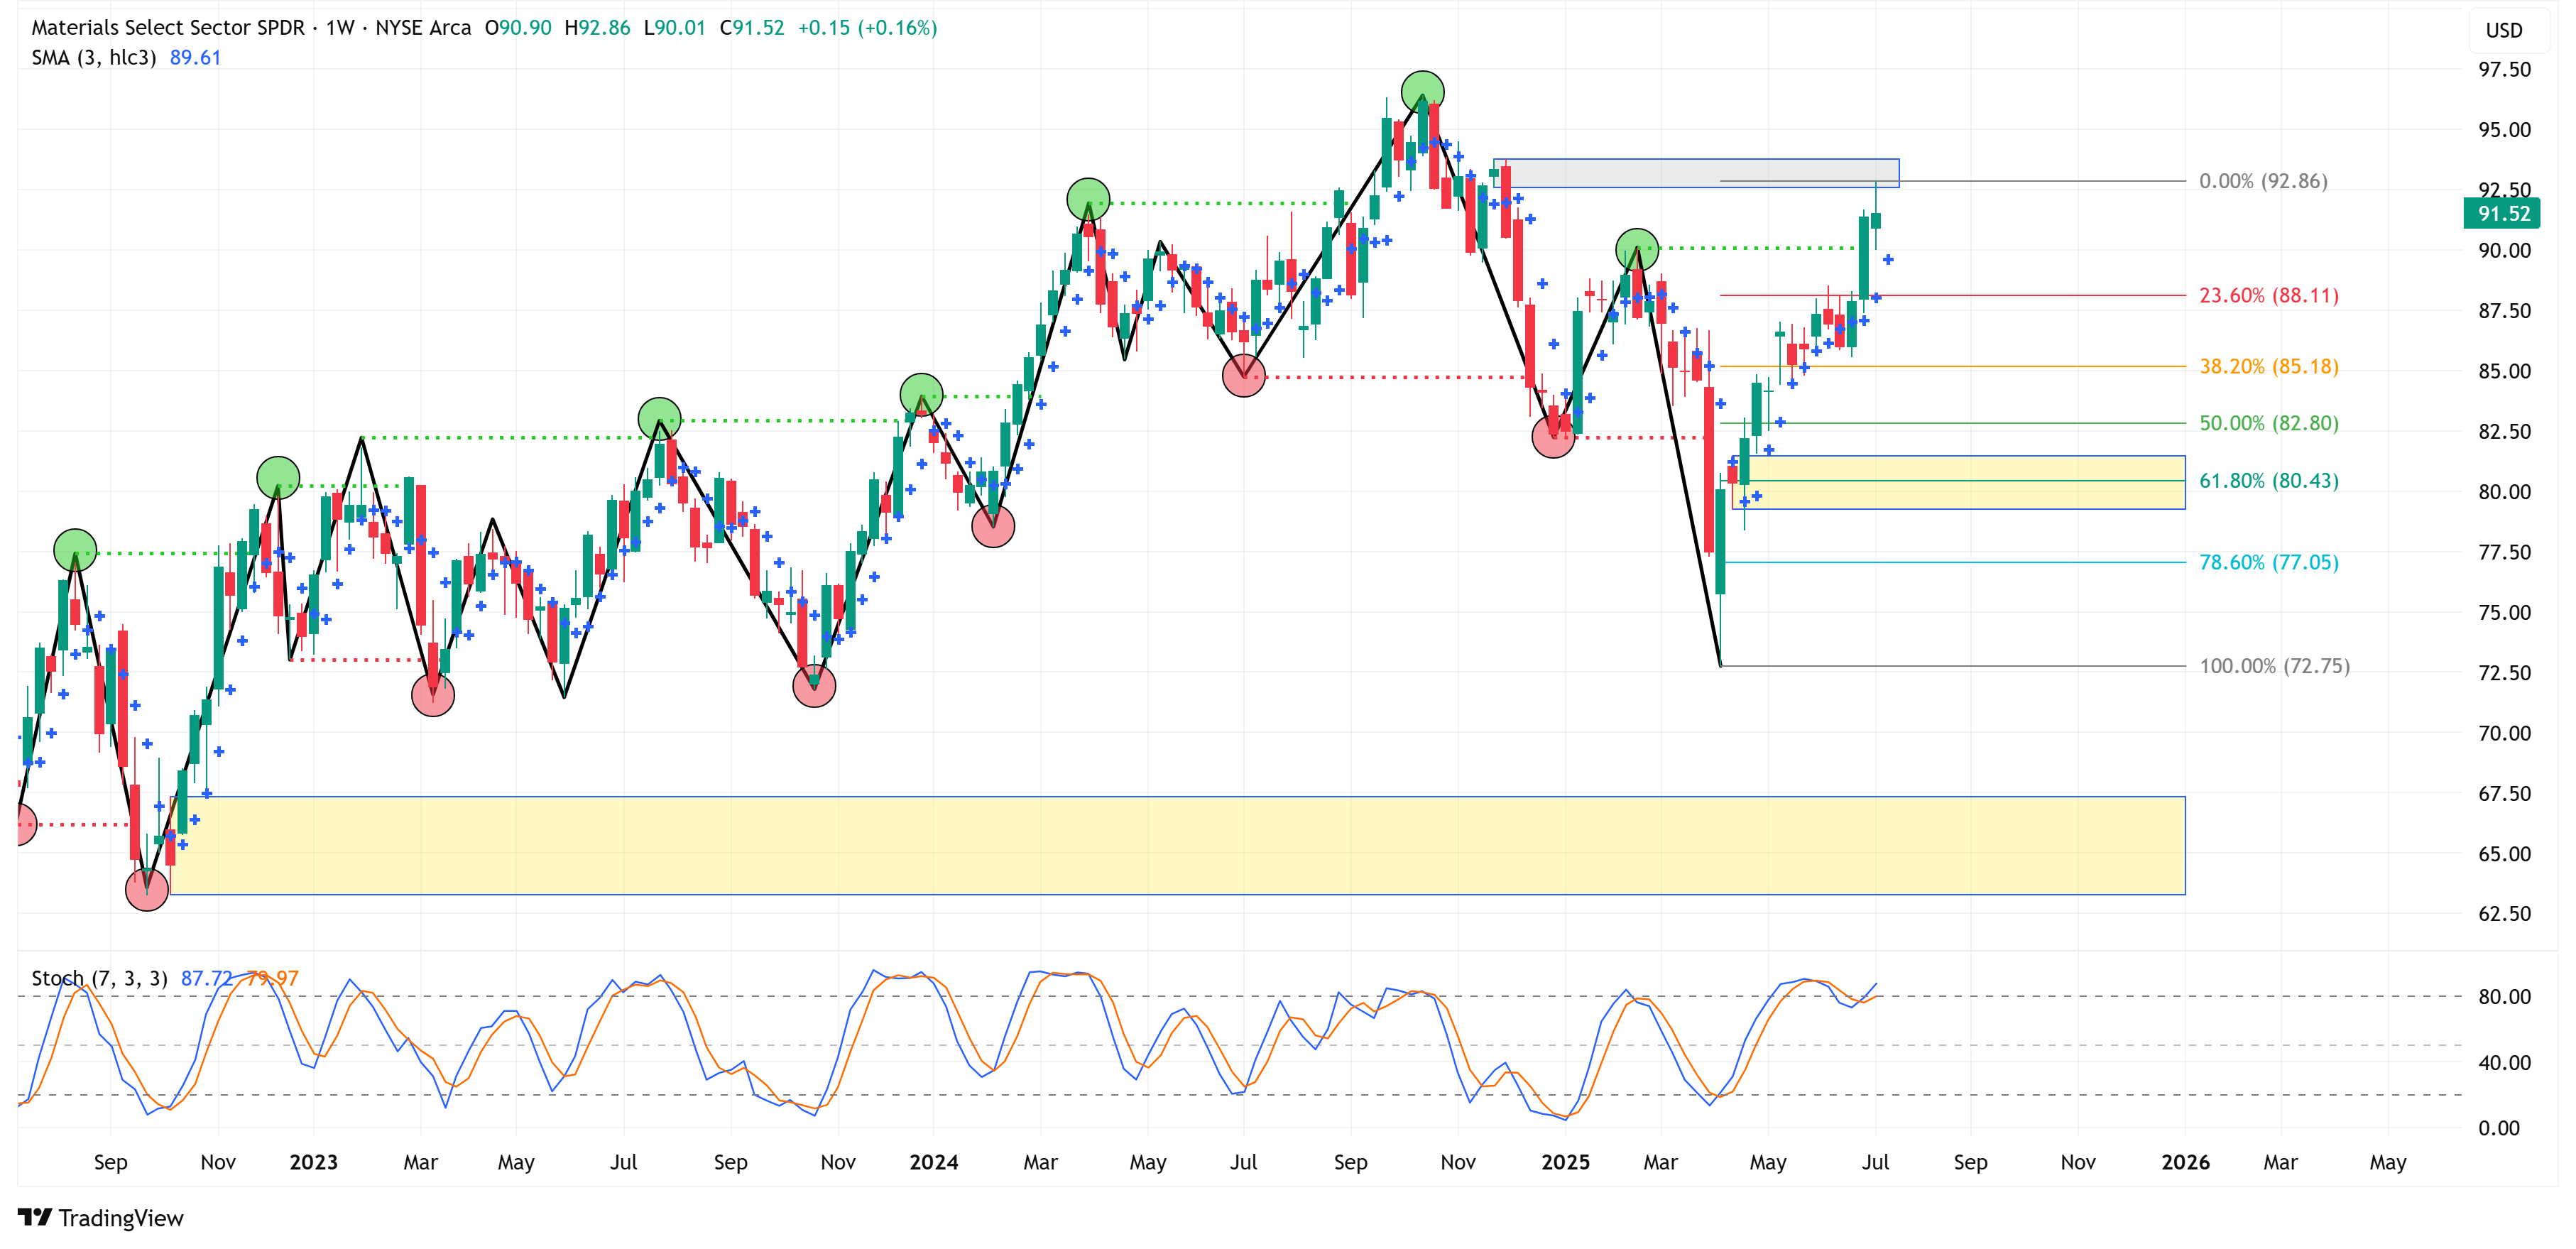
Materials
📈 Trend = ⬆️ / 🎯 Target = 92.86 / 🛑 Stop Loss = 72.75
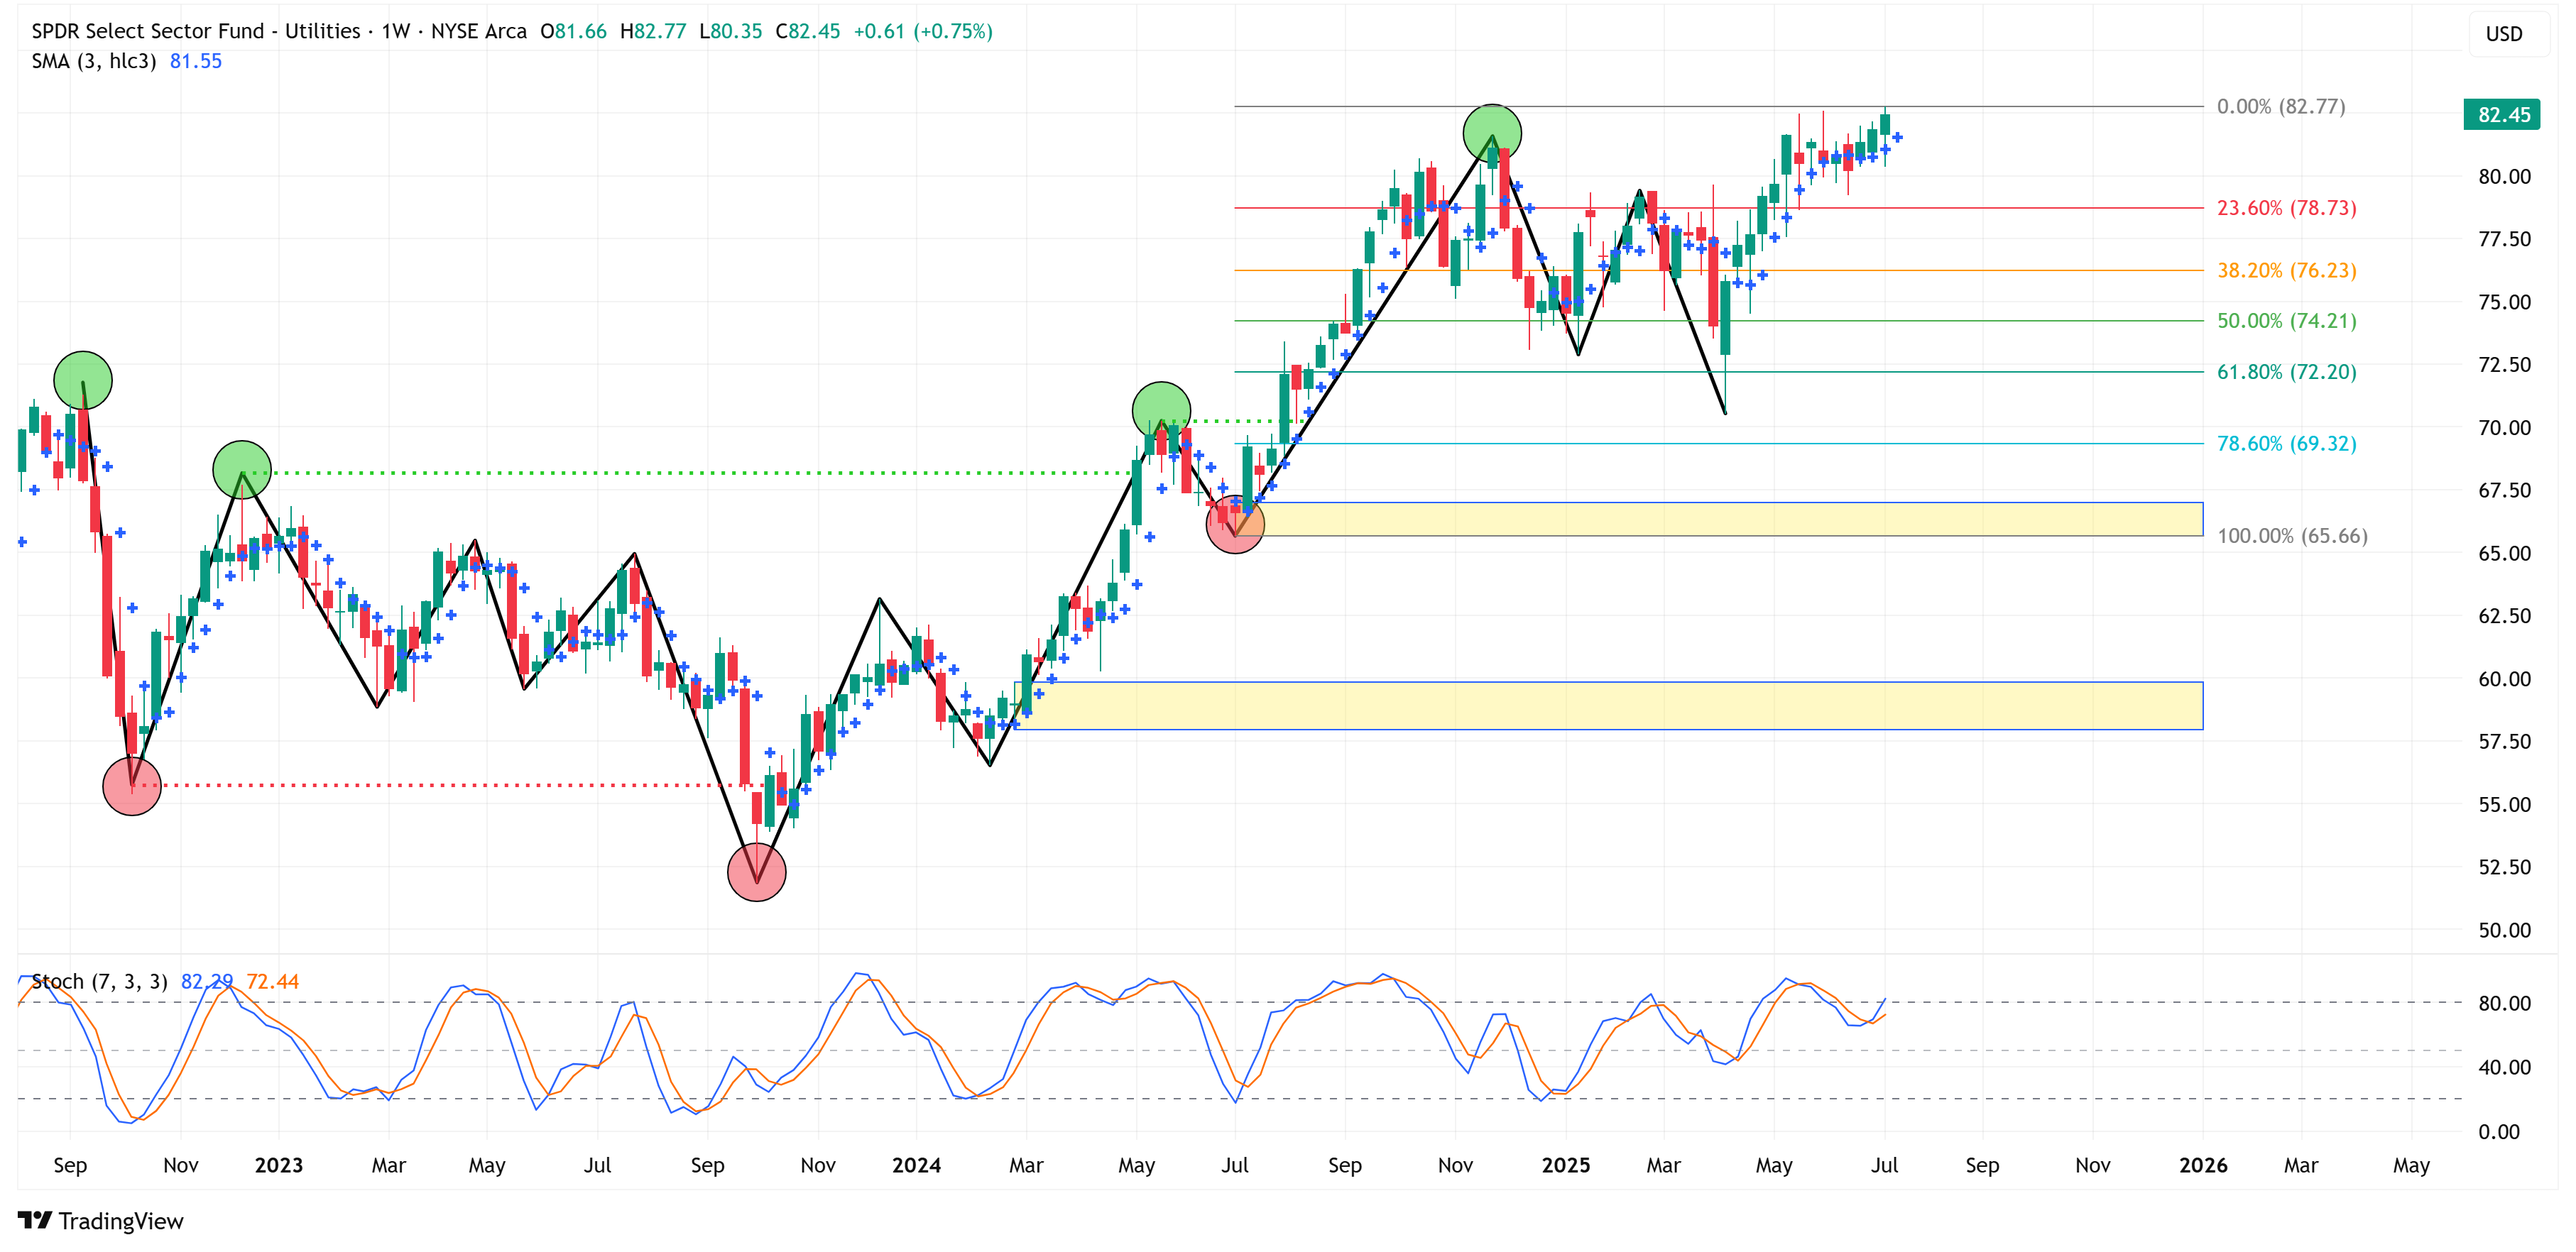
Utilities
📈 Trend = ⬆️ / 🎯 Target = 82.77 / 🛑 Stop Loss = 65.66
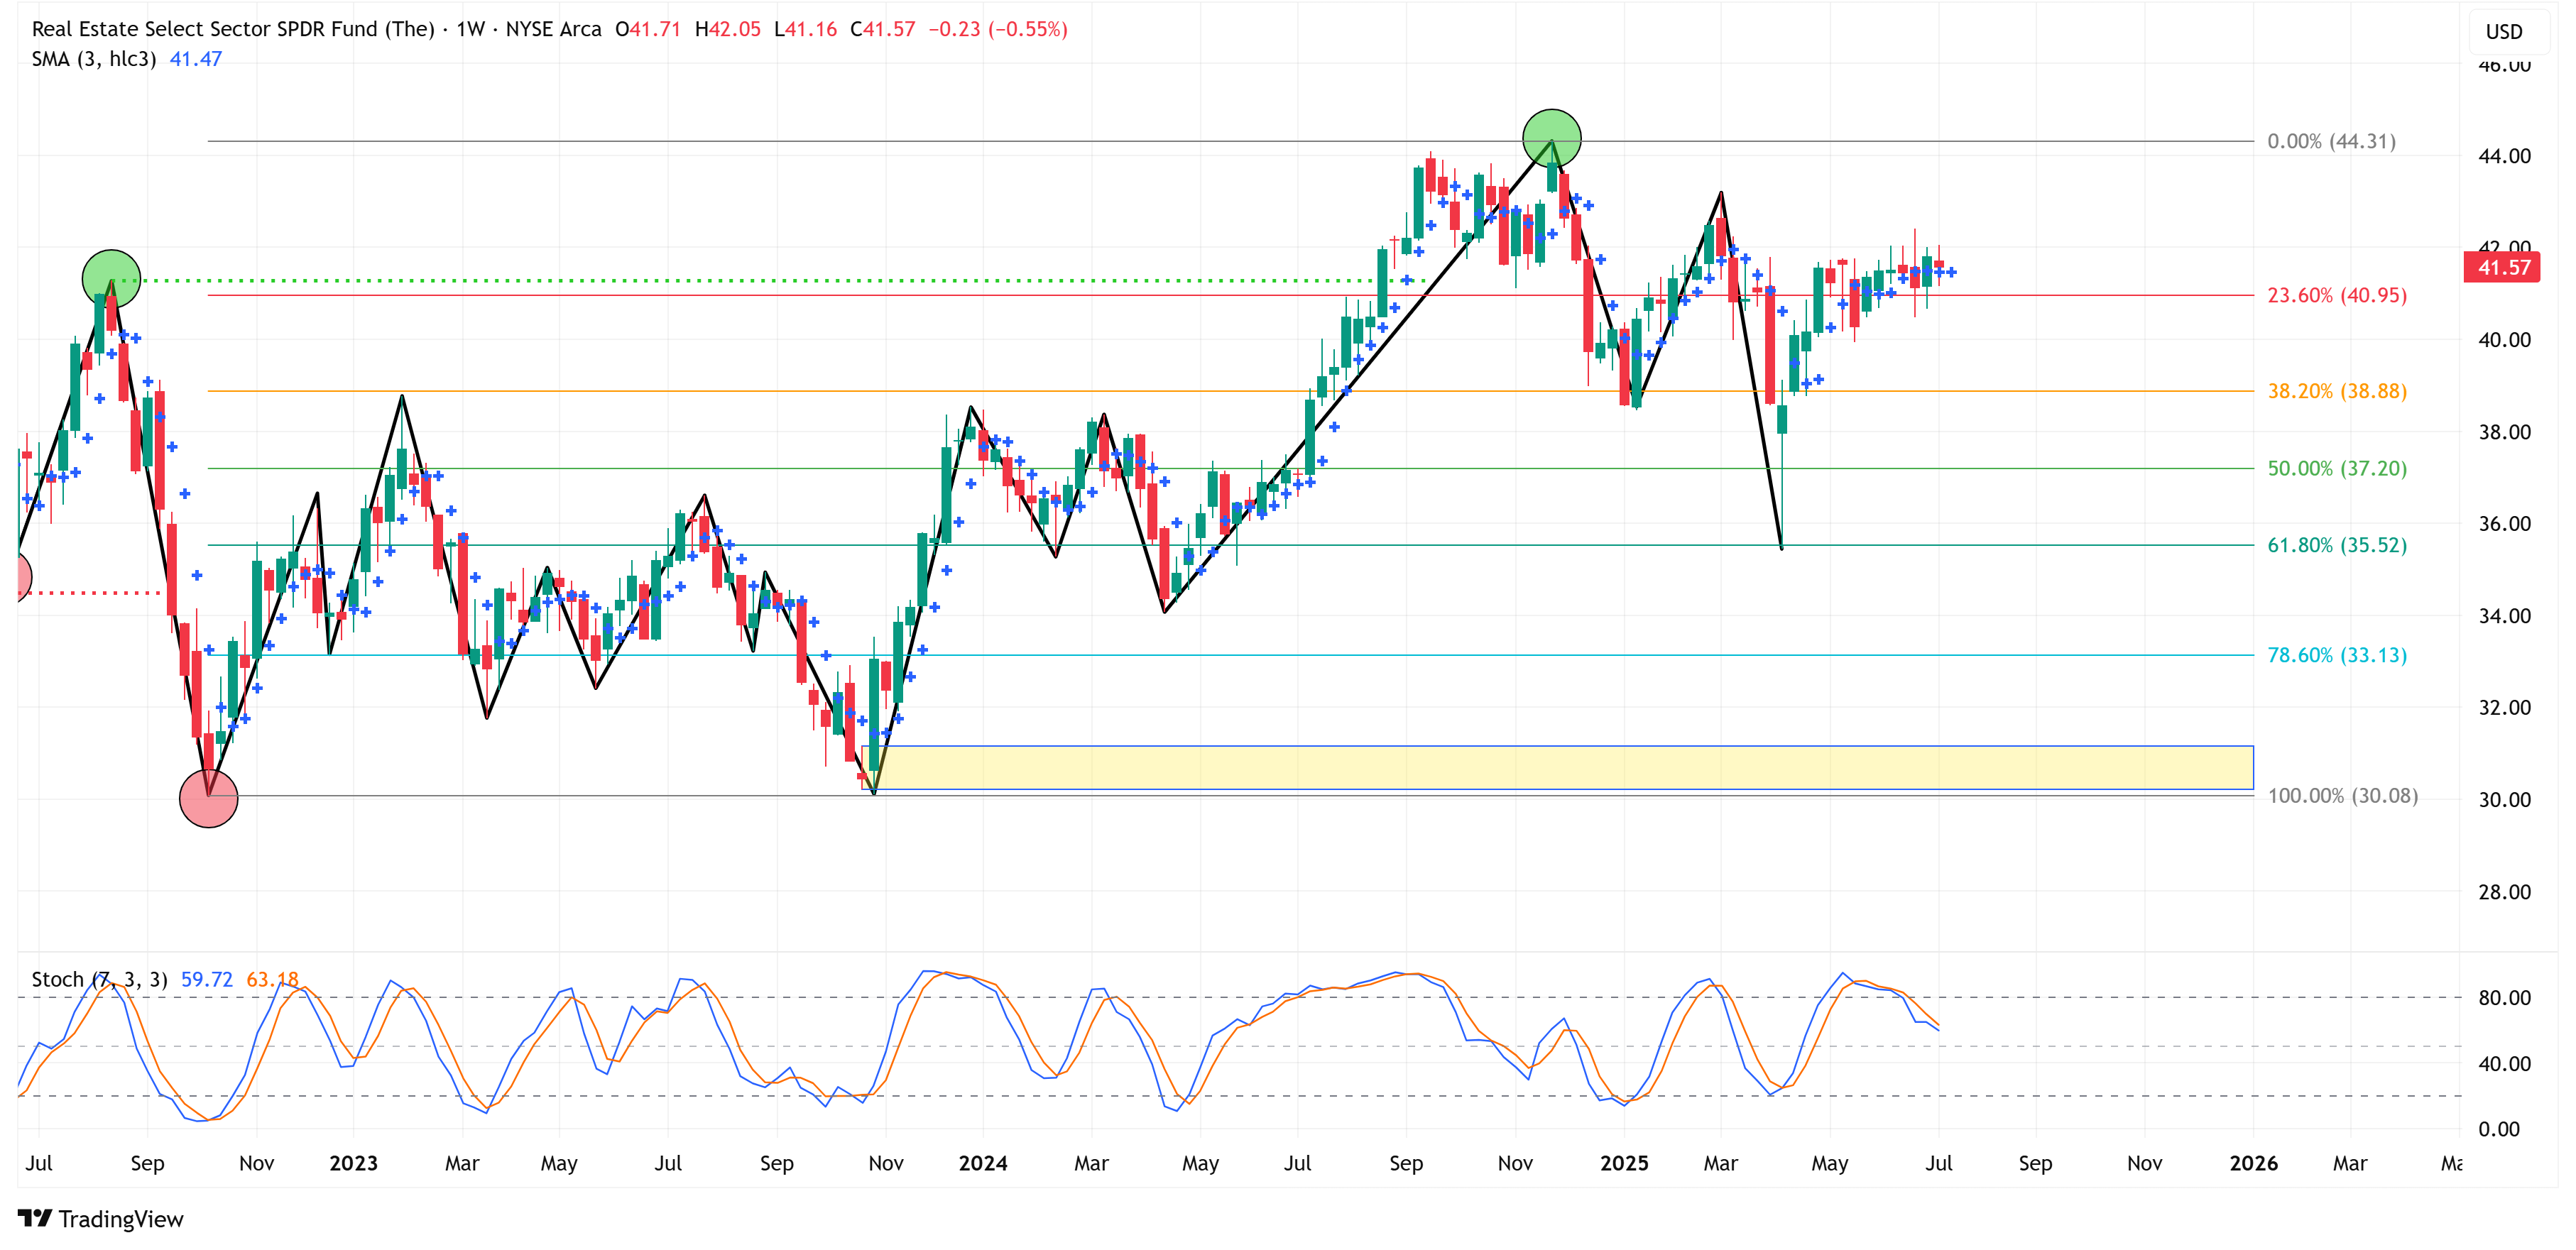
Real Estate
📈 Trend = ⬆️ / 🎯 Target = 44.31 / 🛑 Stop Loss = 30.08
US Treasuries:
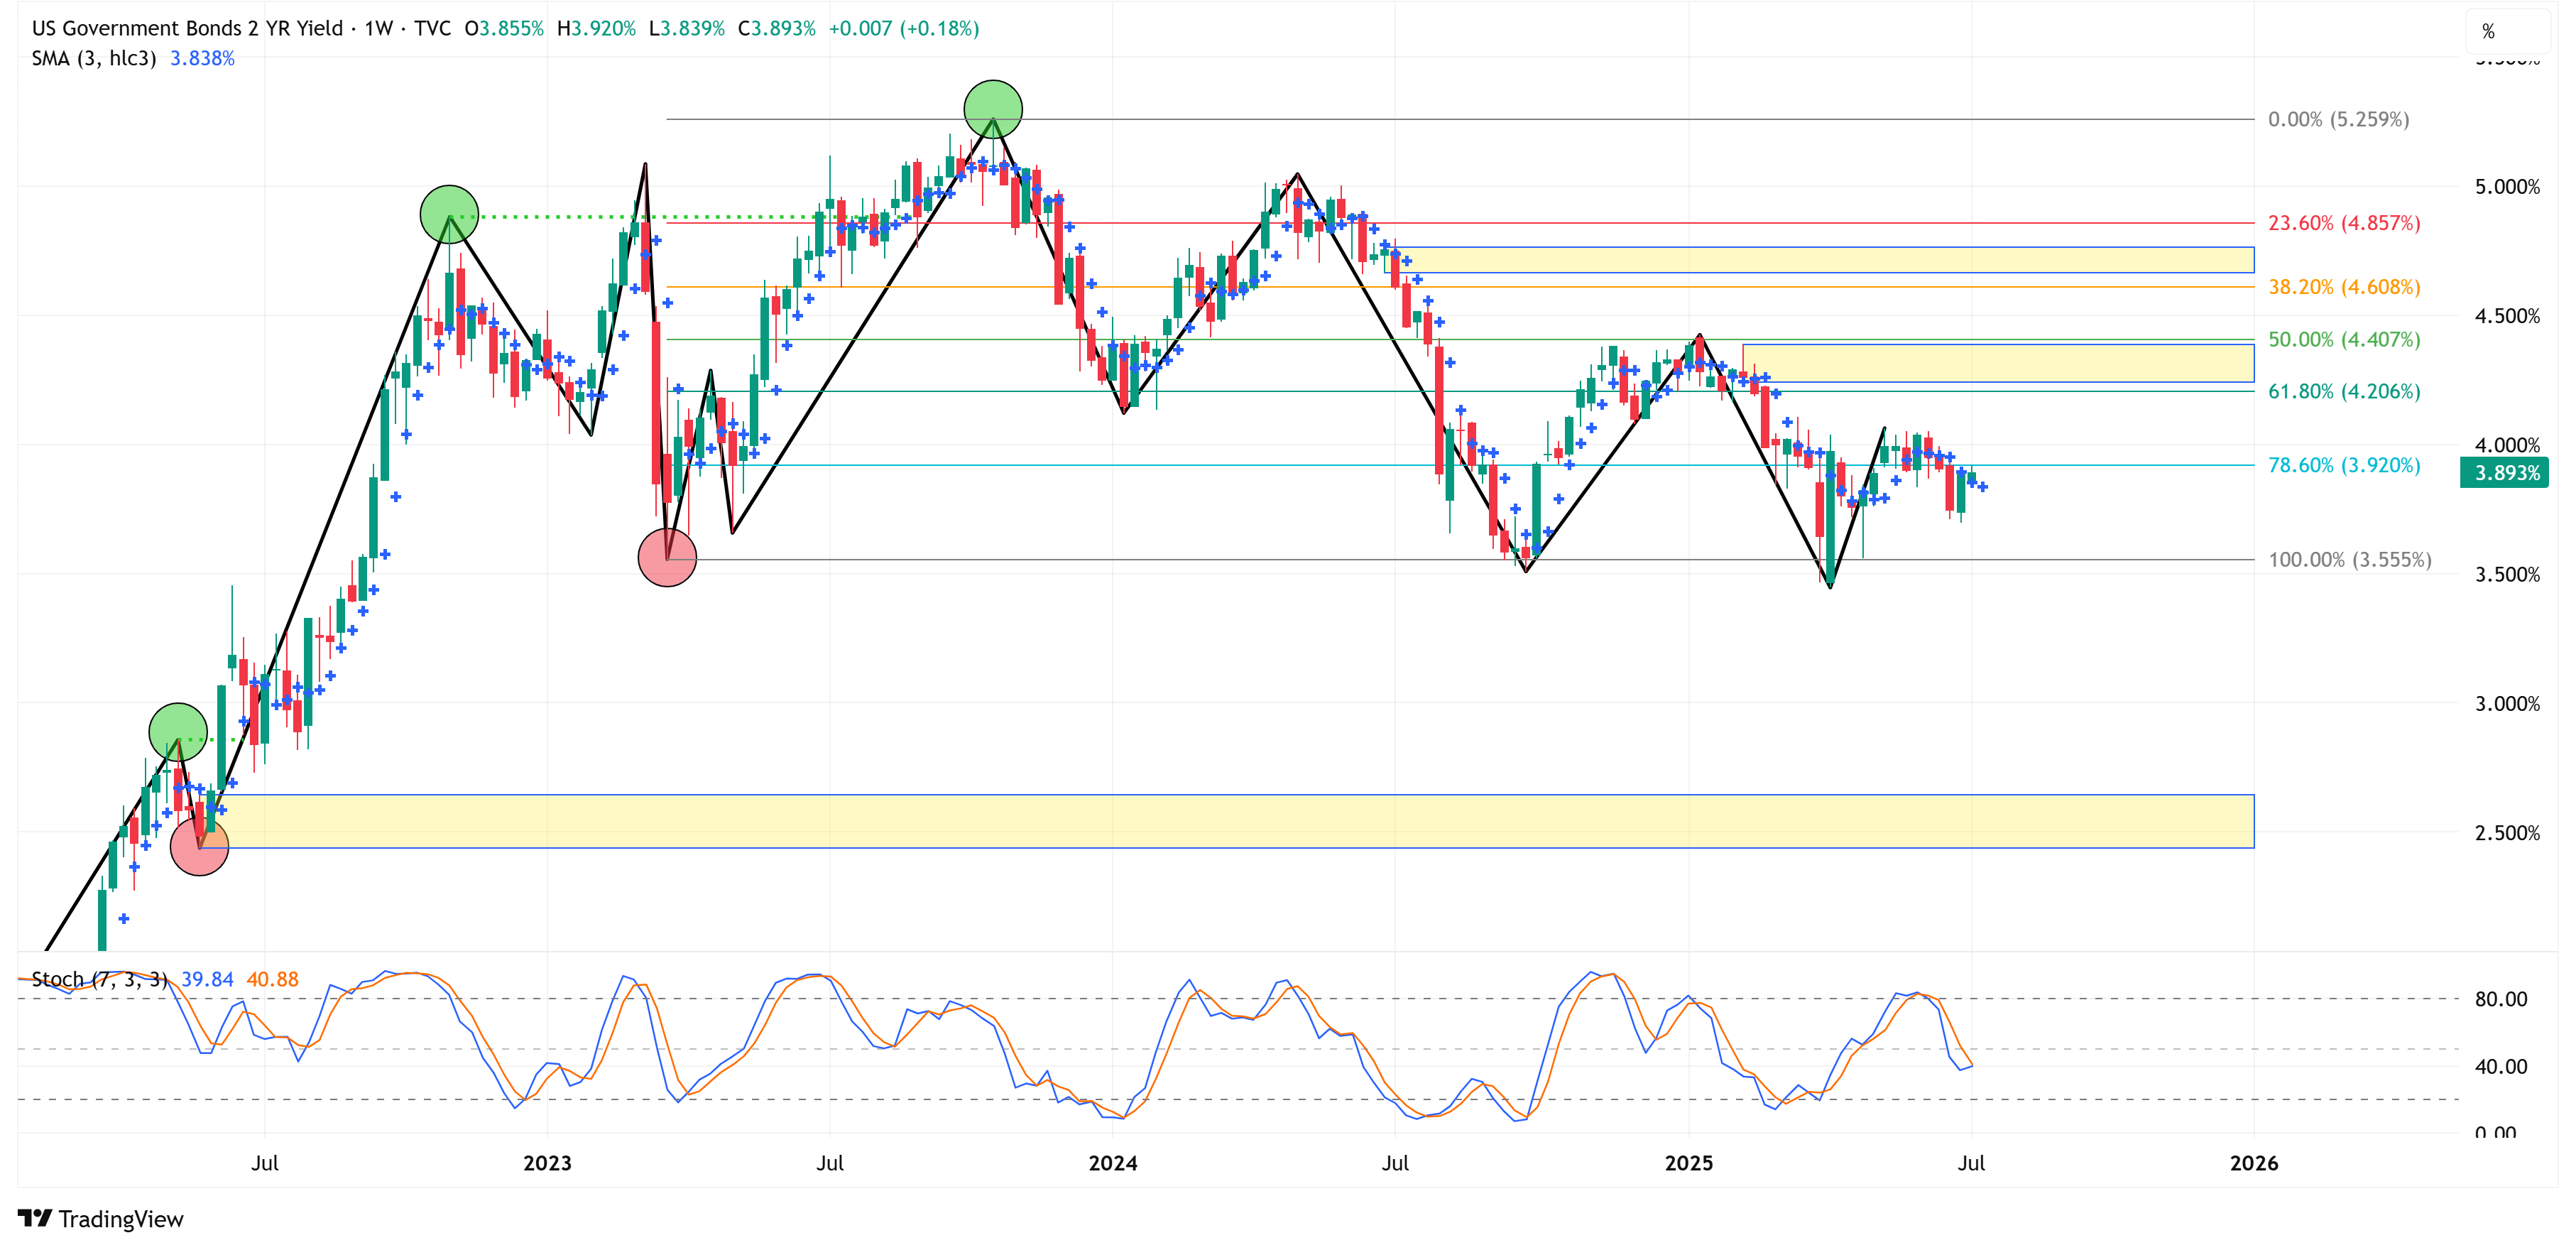
UST 2Y Yield
📈 Trend = ⬆️ / 🎯 Target = 5.259% / 🛑 Stop Loss = 3.555%
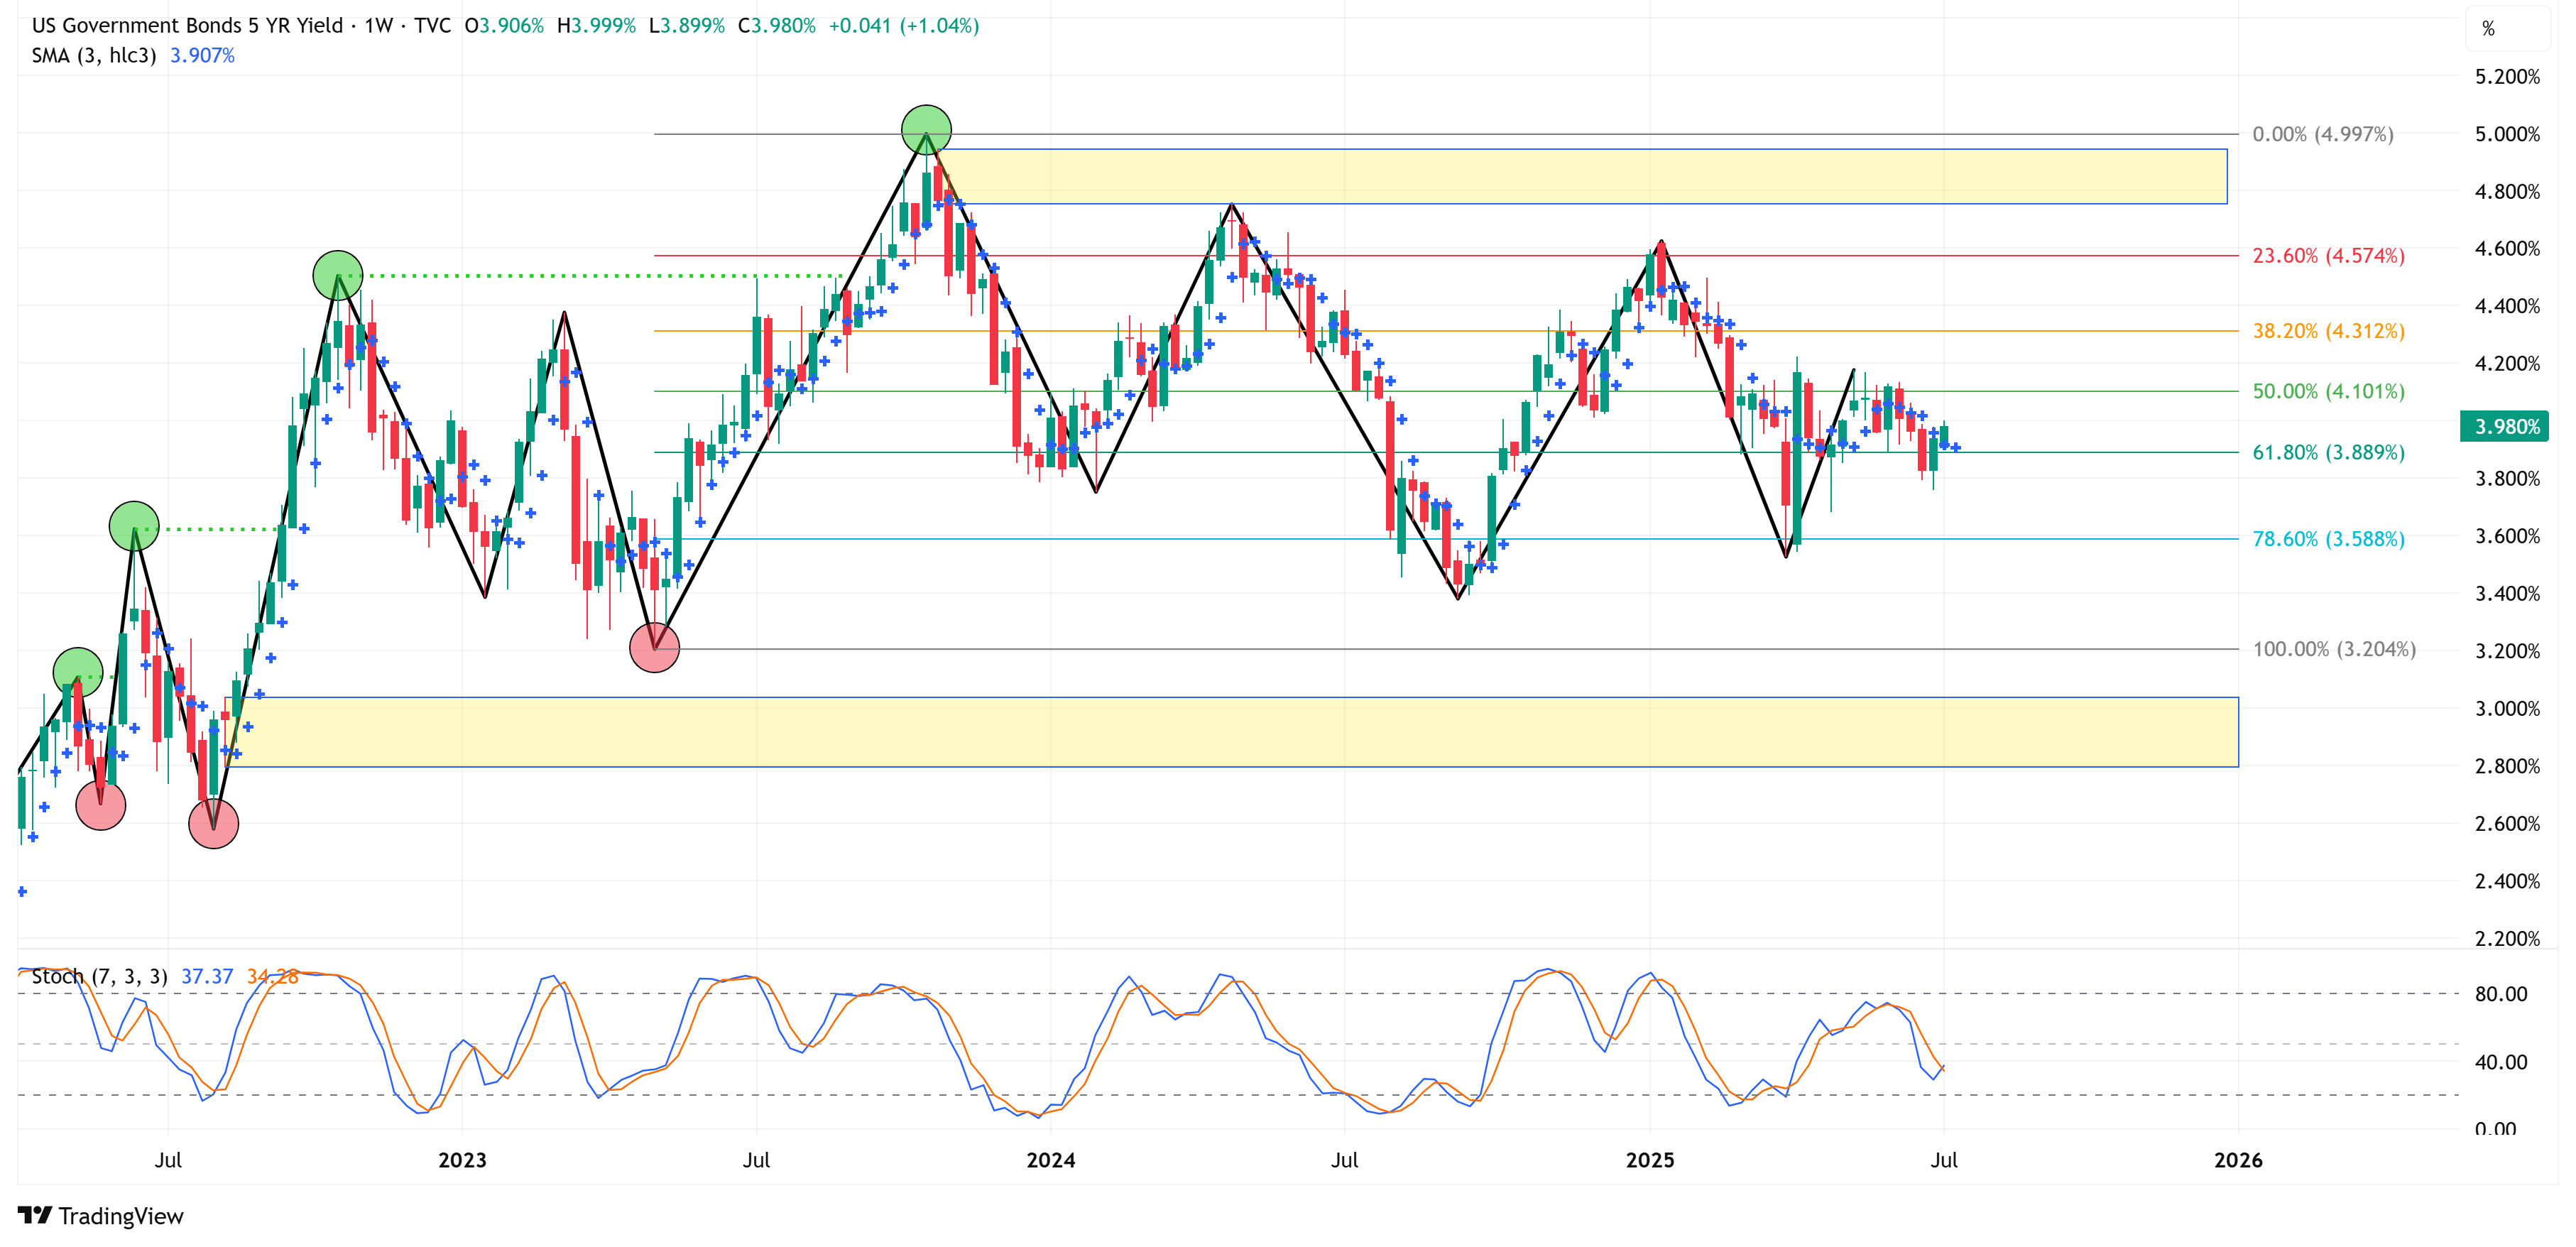
UST 5Y Yield
📈 Trend = ⬆️ / 🎯 Target = 4.997% / 🛑 Stop Loss = 3.204%
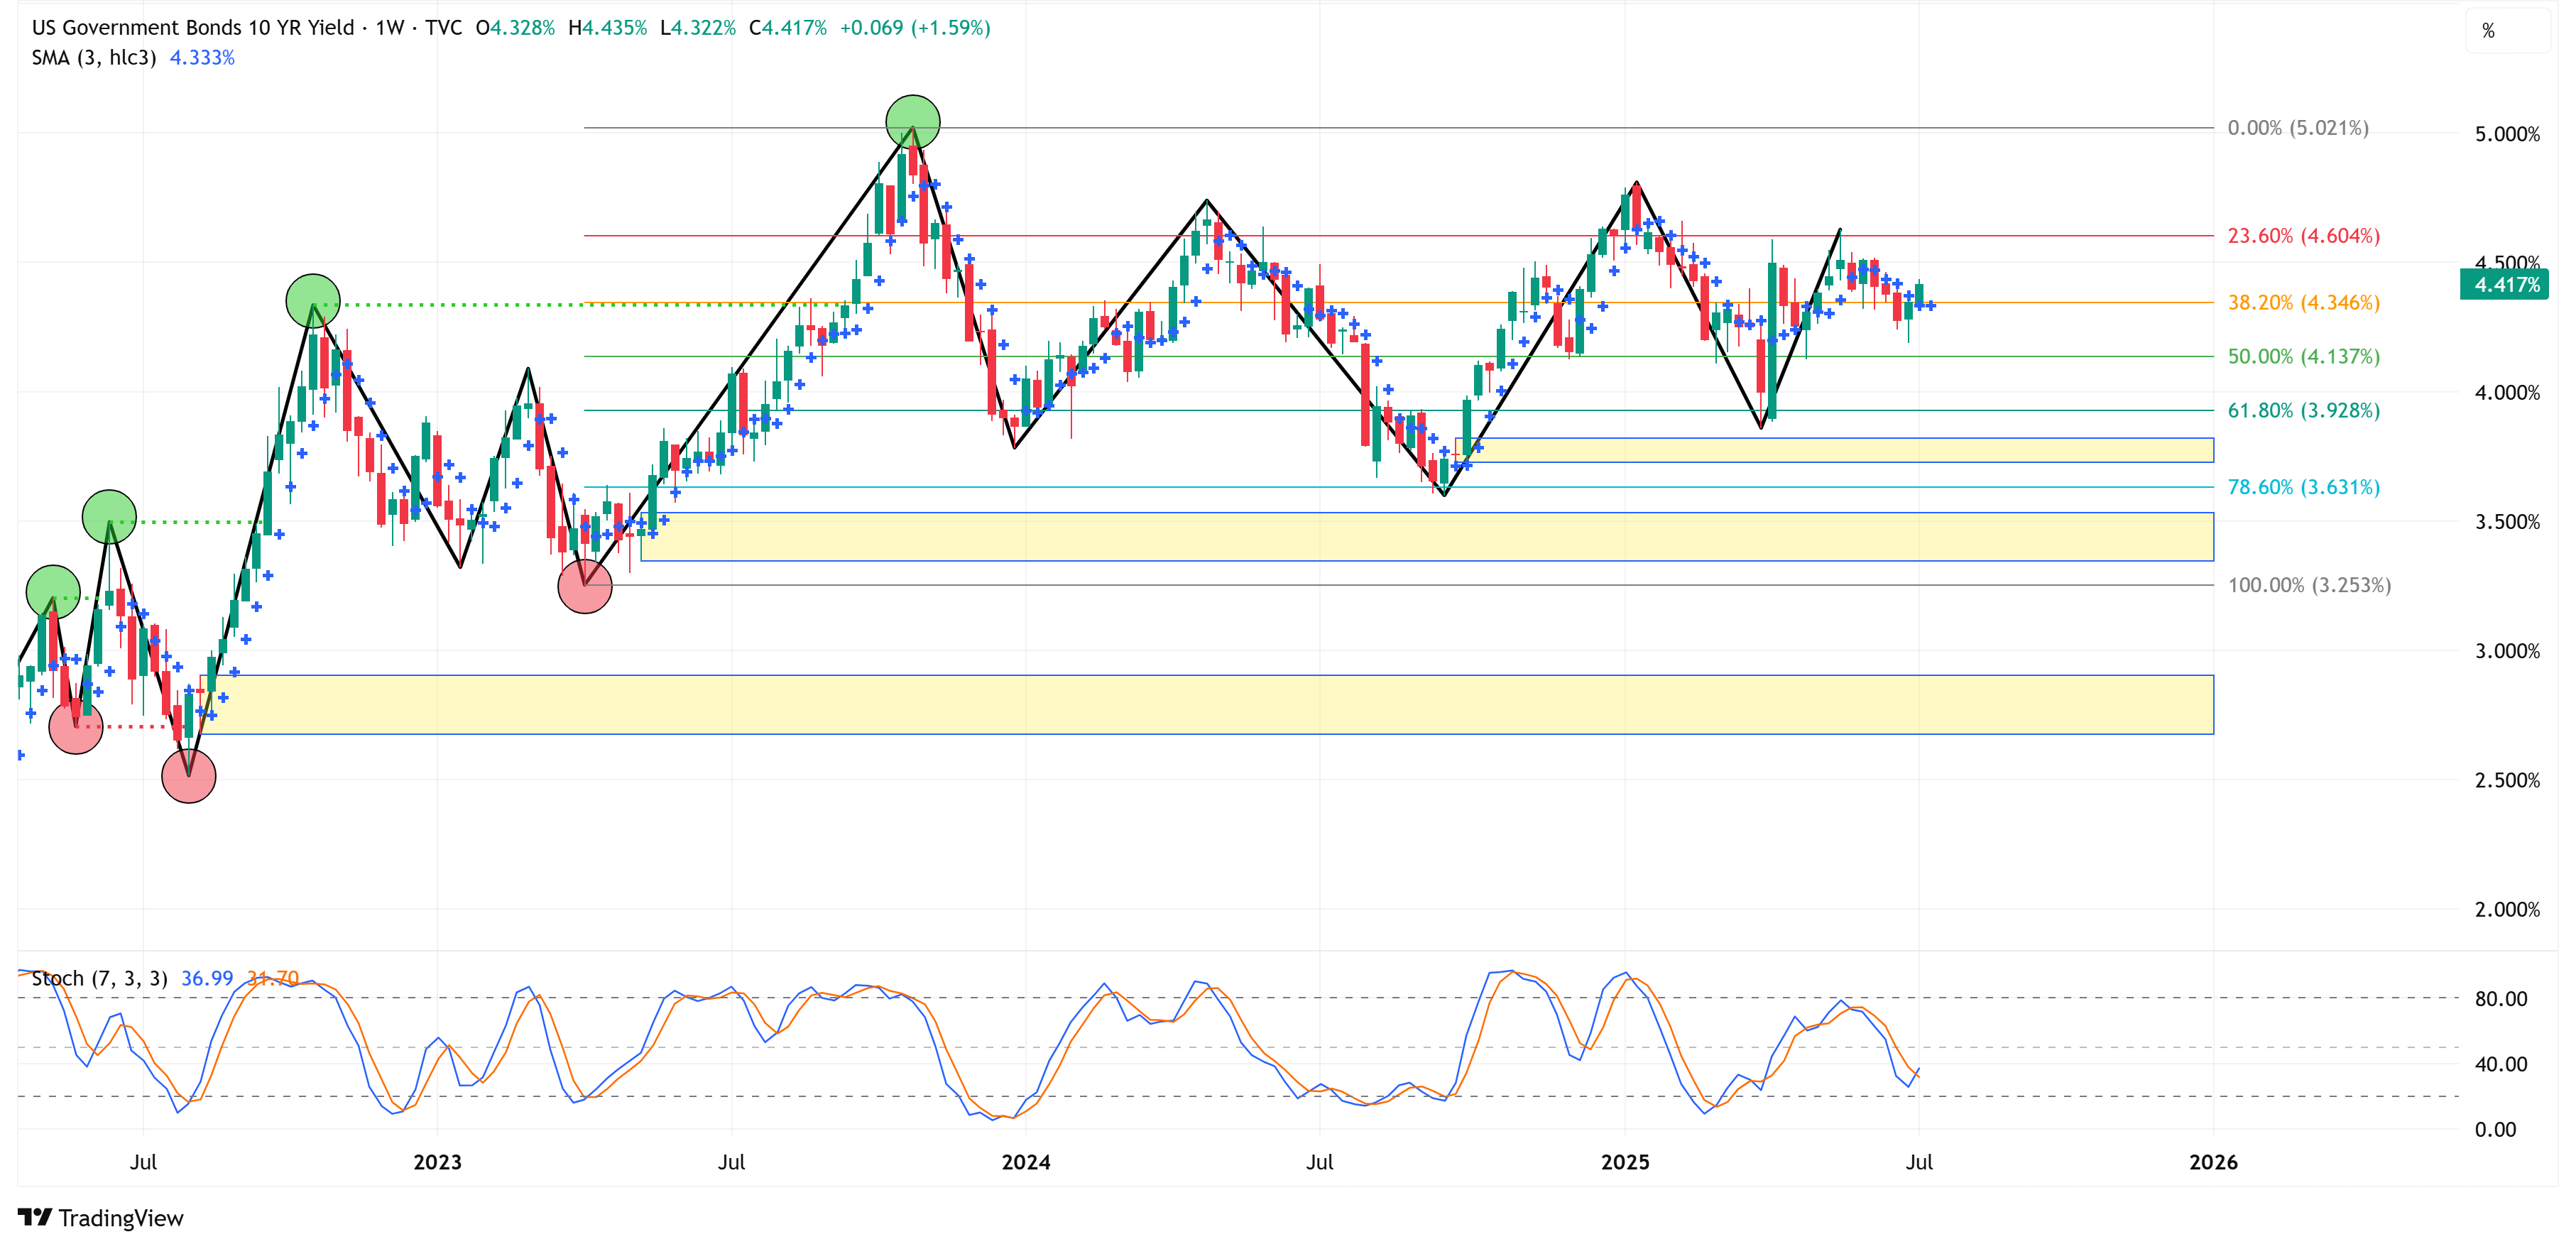
UST 10Y Yield
📈 Trend = ⬆️ / 🎯 Target = 5.021% / 🛑 Stop Loss = 3.253%
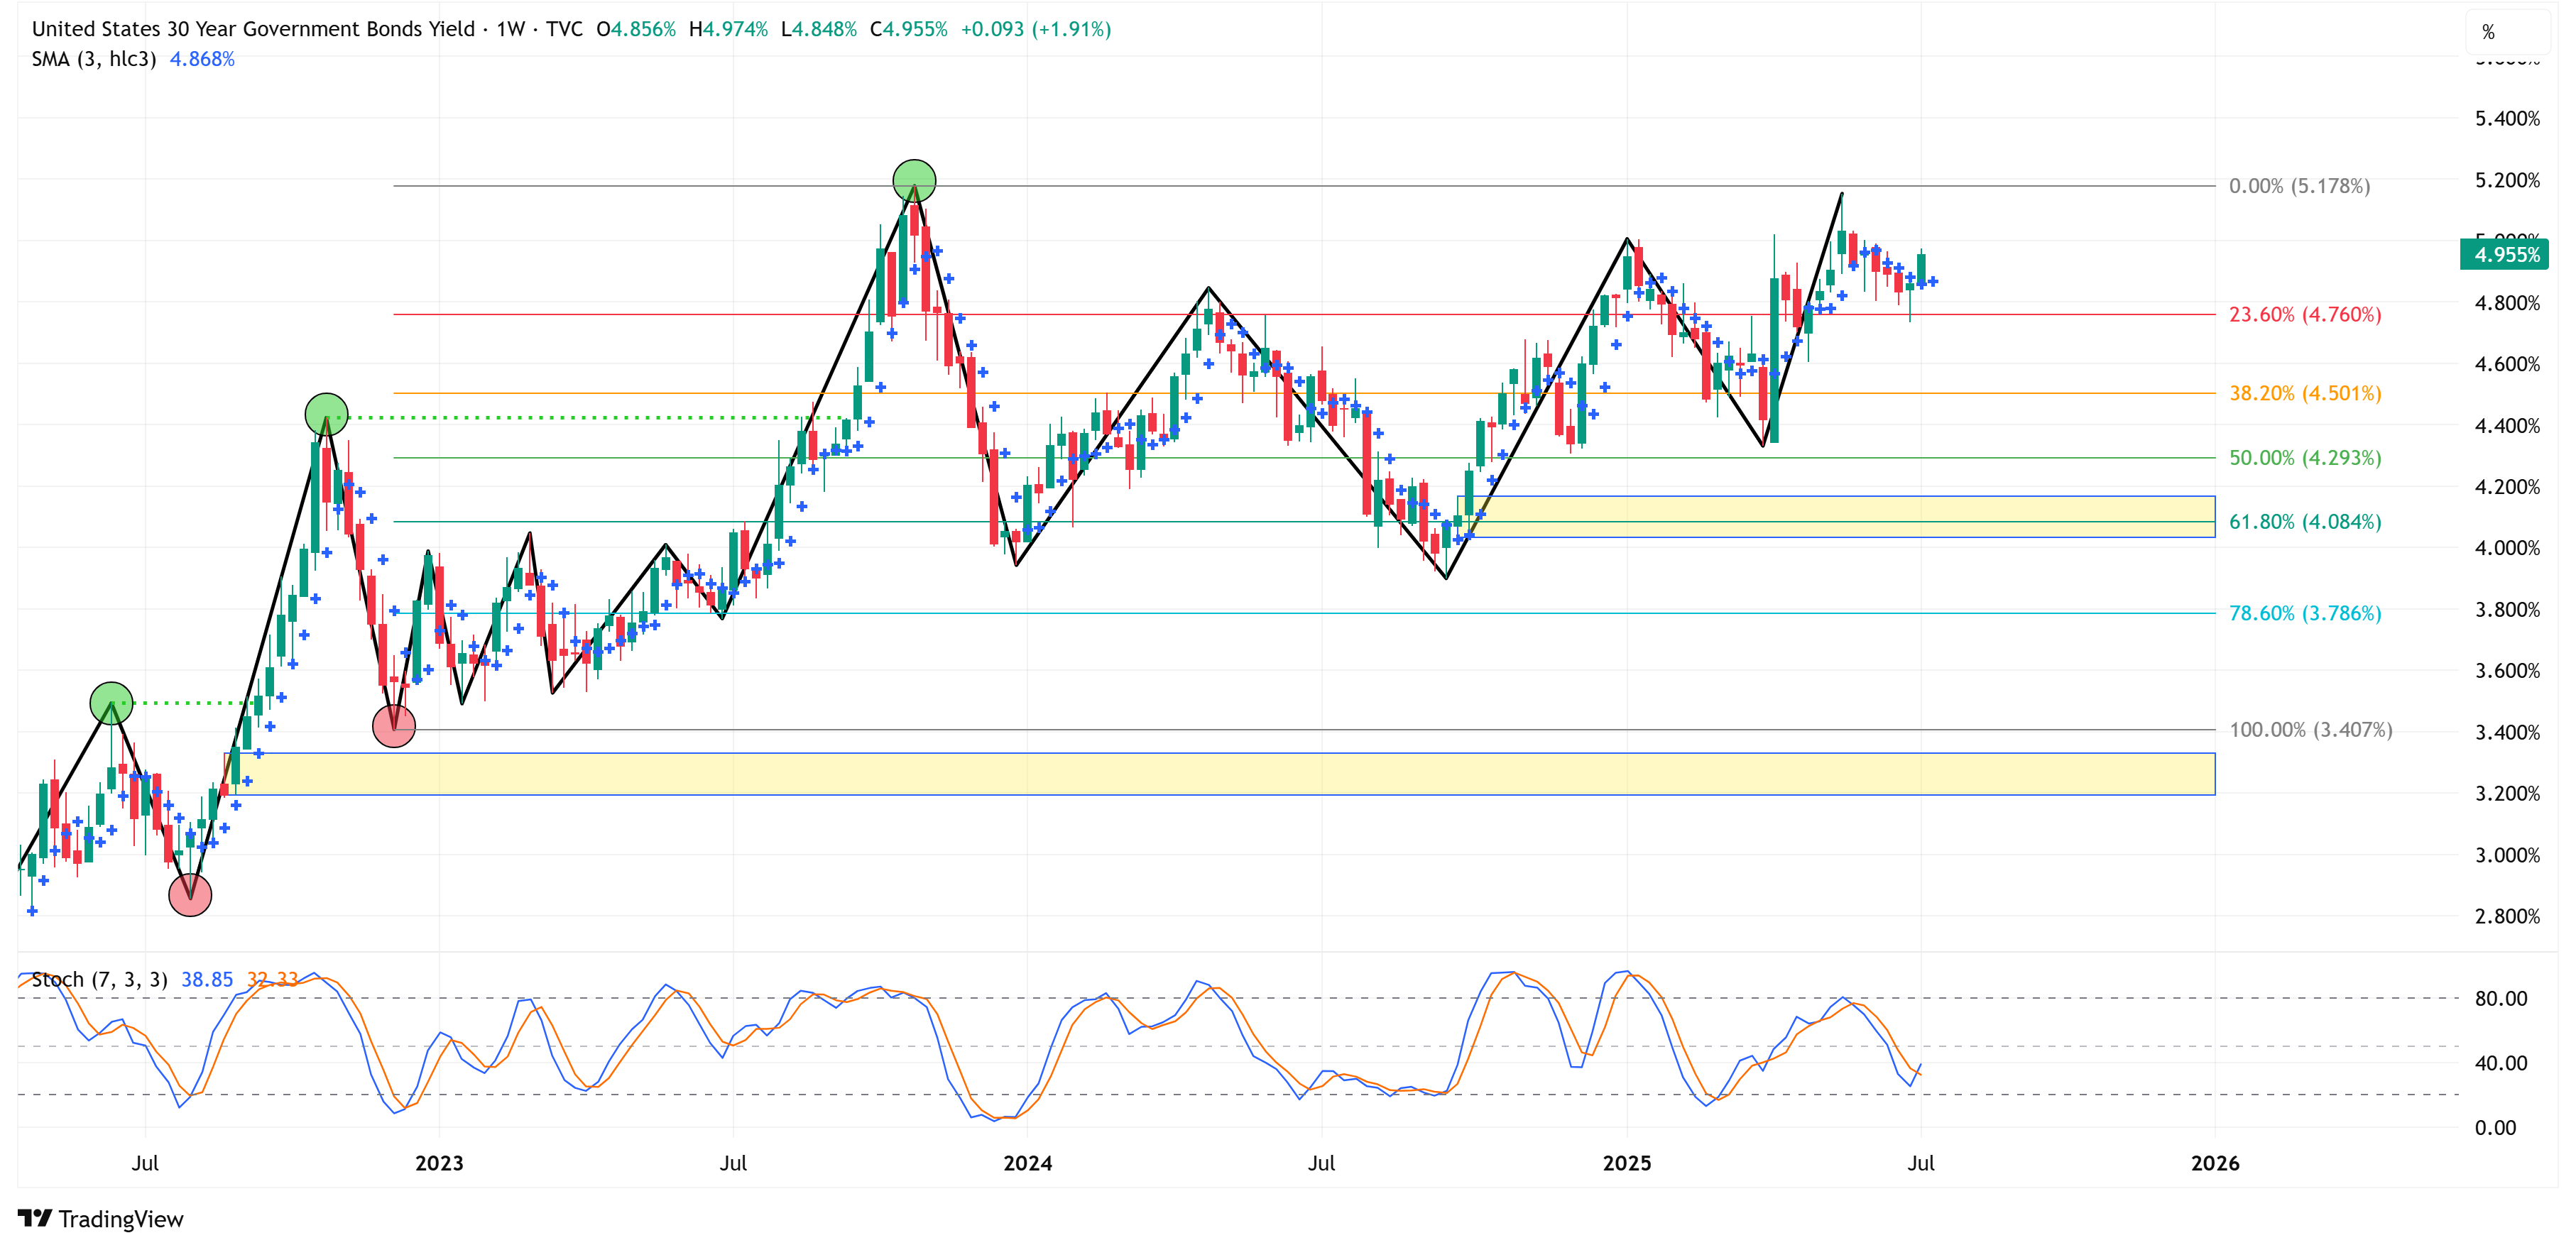
UST 30Y Yield
📈 Trend = ⬆️ / 🎯 Target = 5.178% / 🛑 Stop Loss = 3.407%
Currencies:
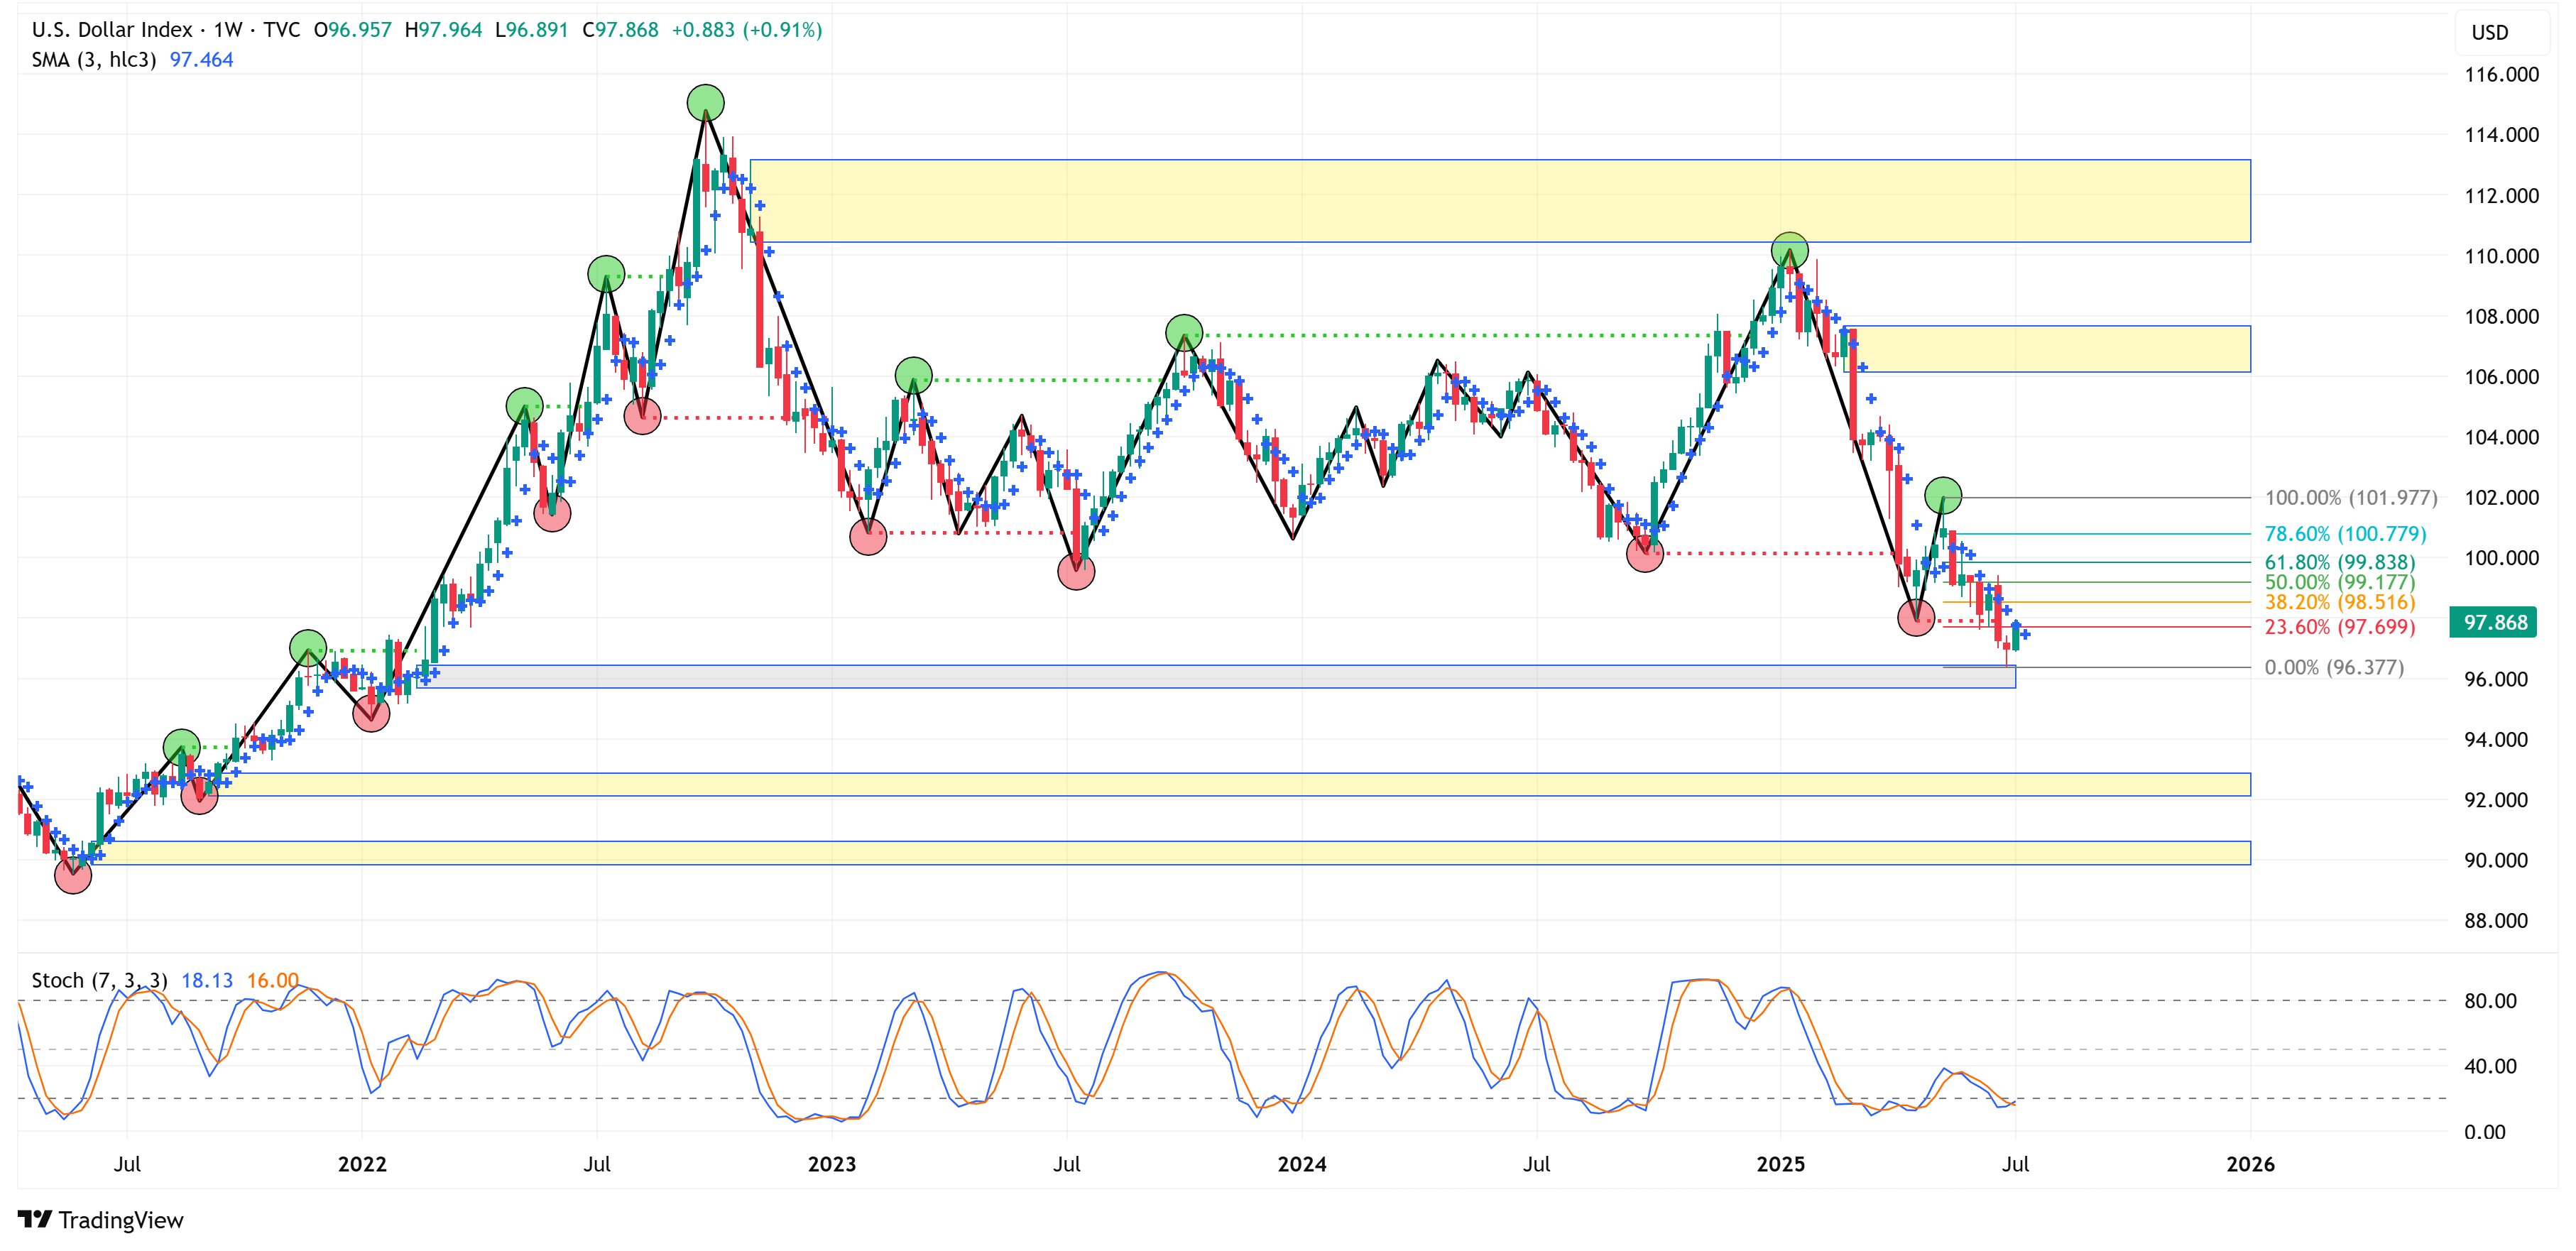
US Dollar (DXY)
📉 Trend = ⬇️ / 🎯 Target = 96.377 / 🛑 Stop Loss = 101.977
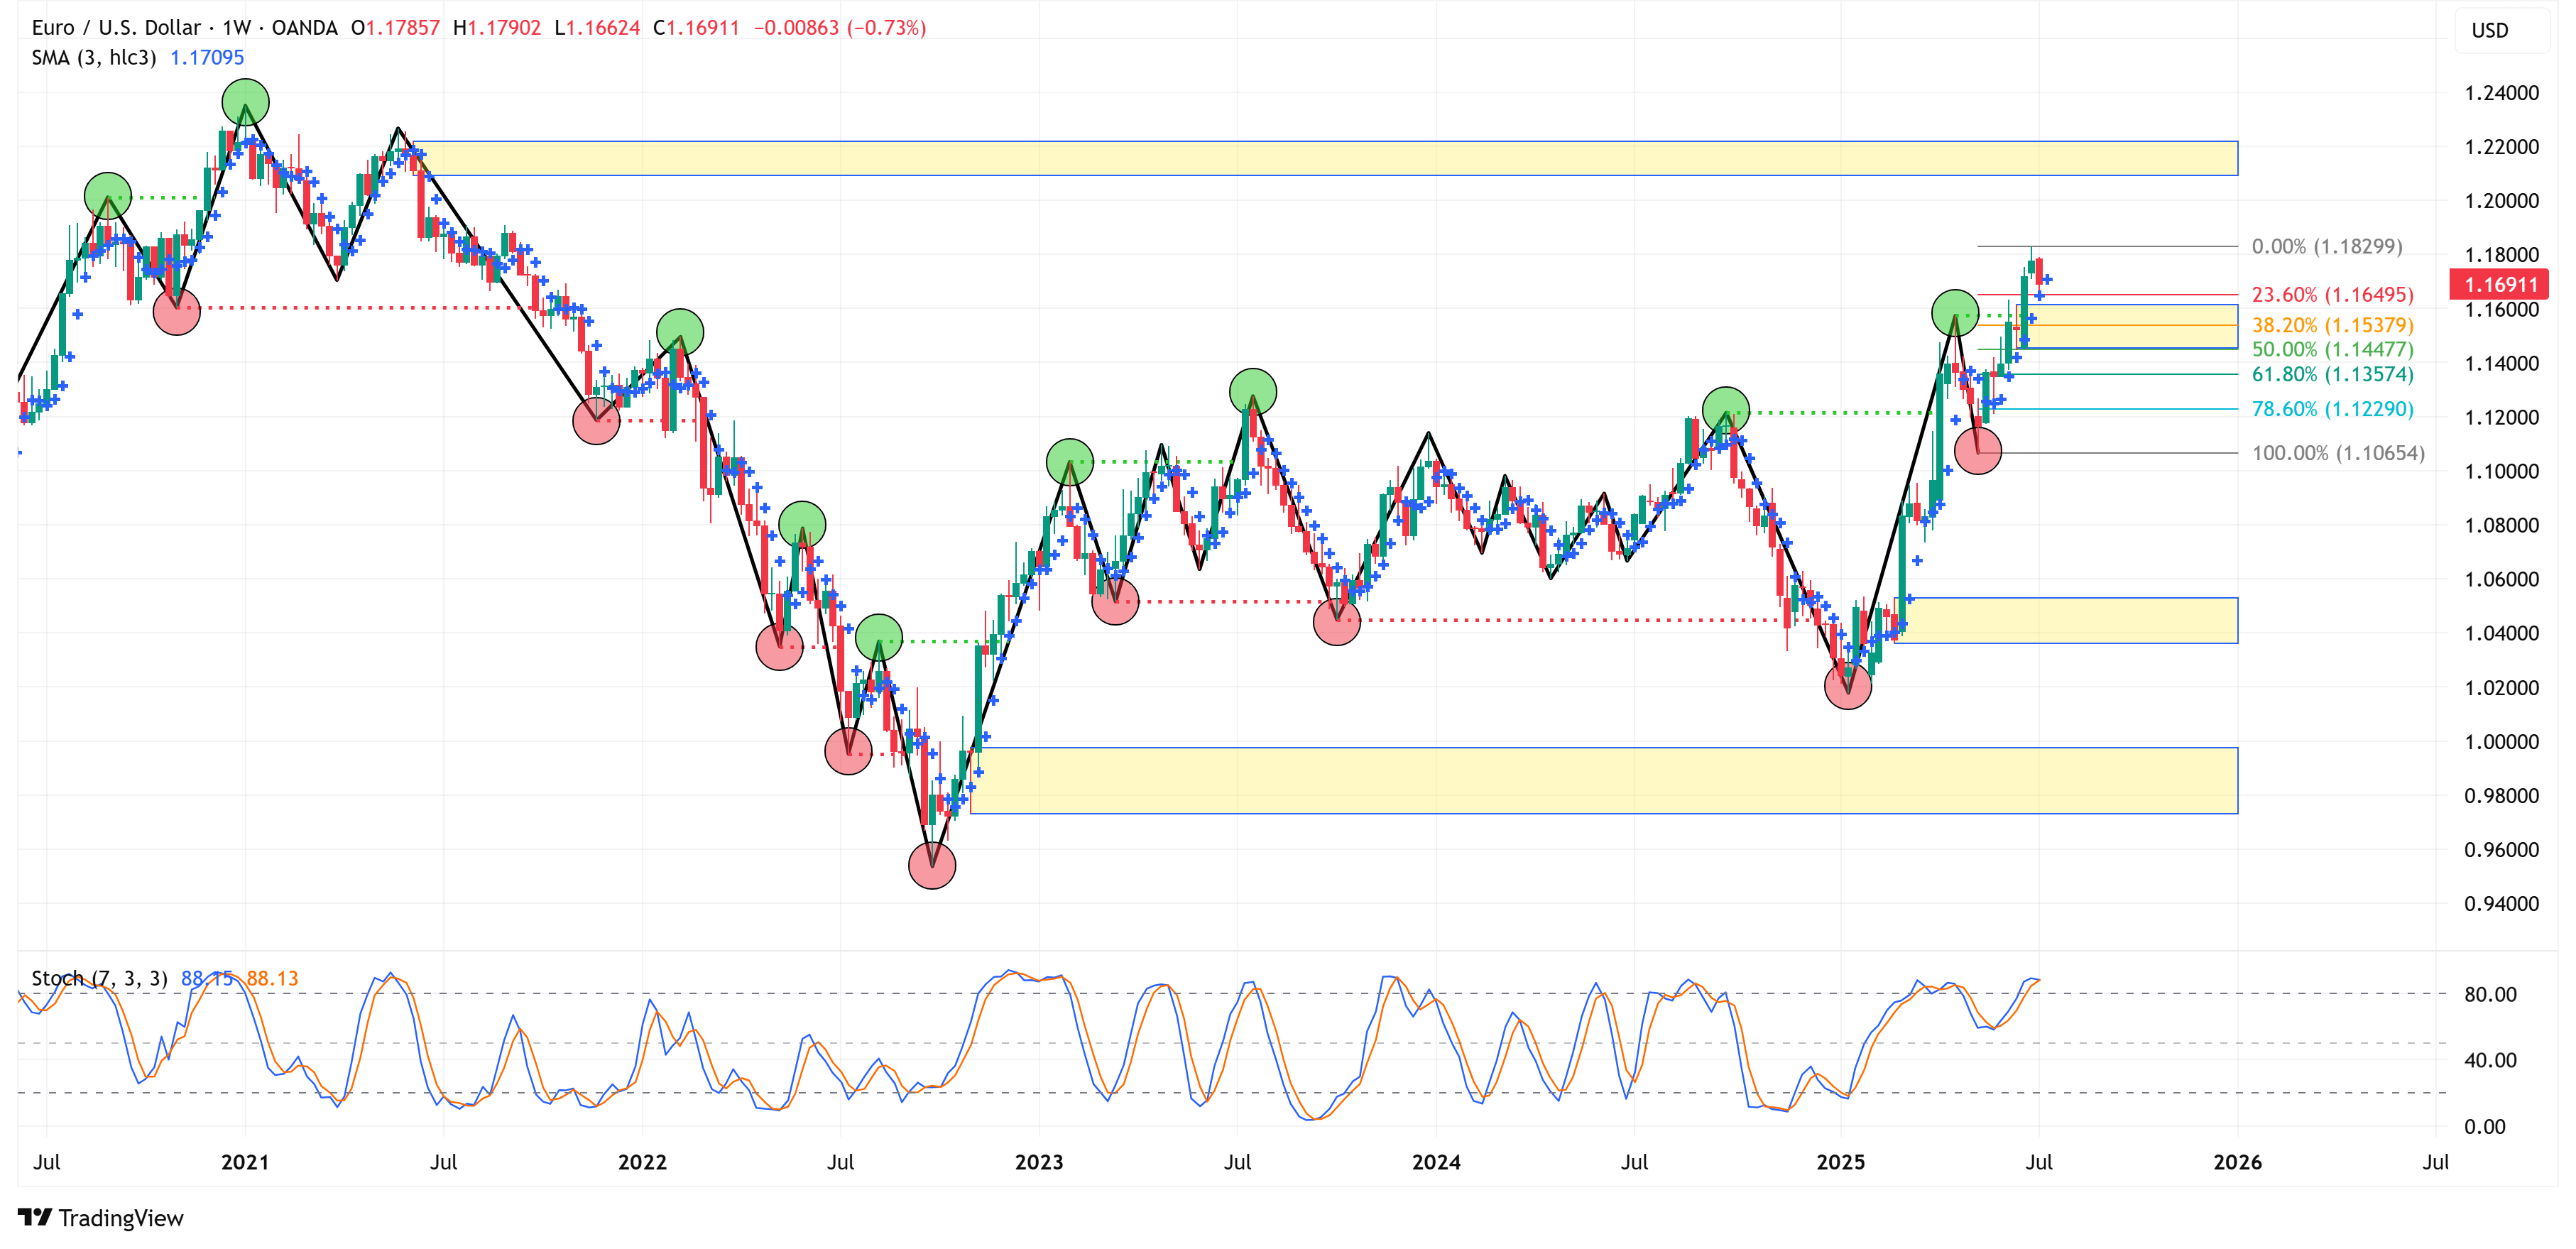
Euro (EUR/USD)
📈 Trend = ⬆️ / 🎯 Target = 1.18299 / 🛑 Stop Loss = 1.10654
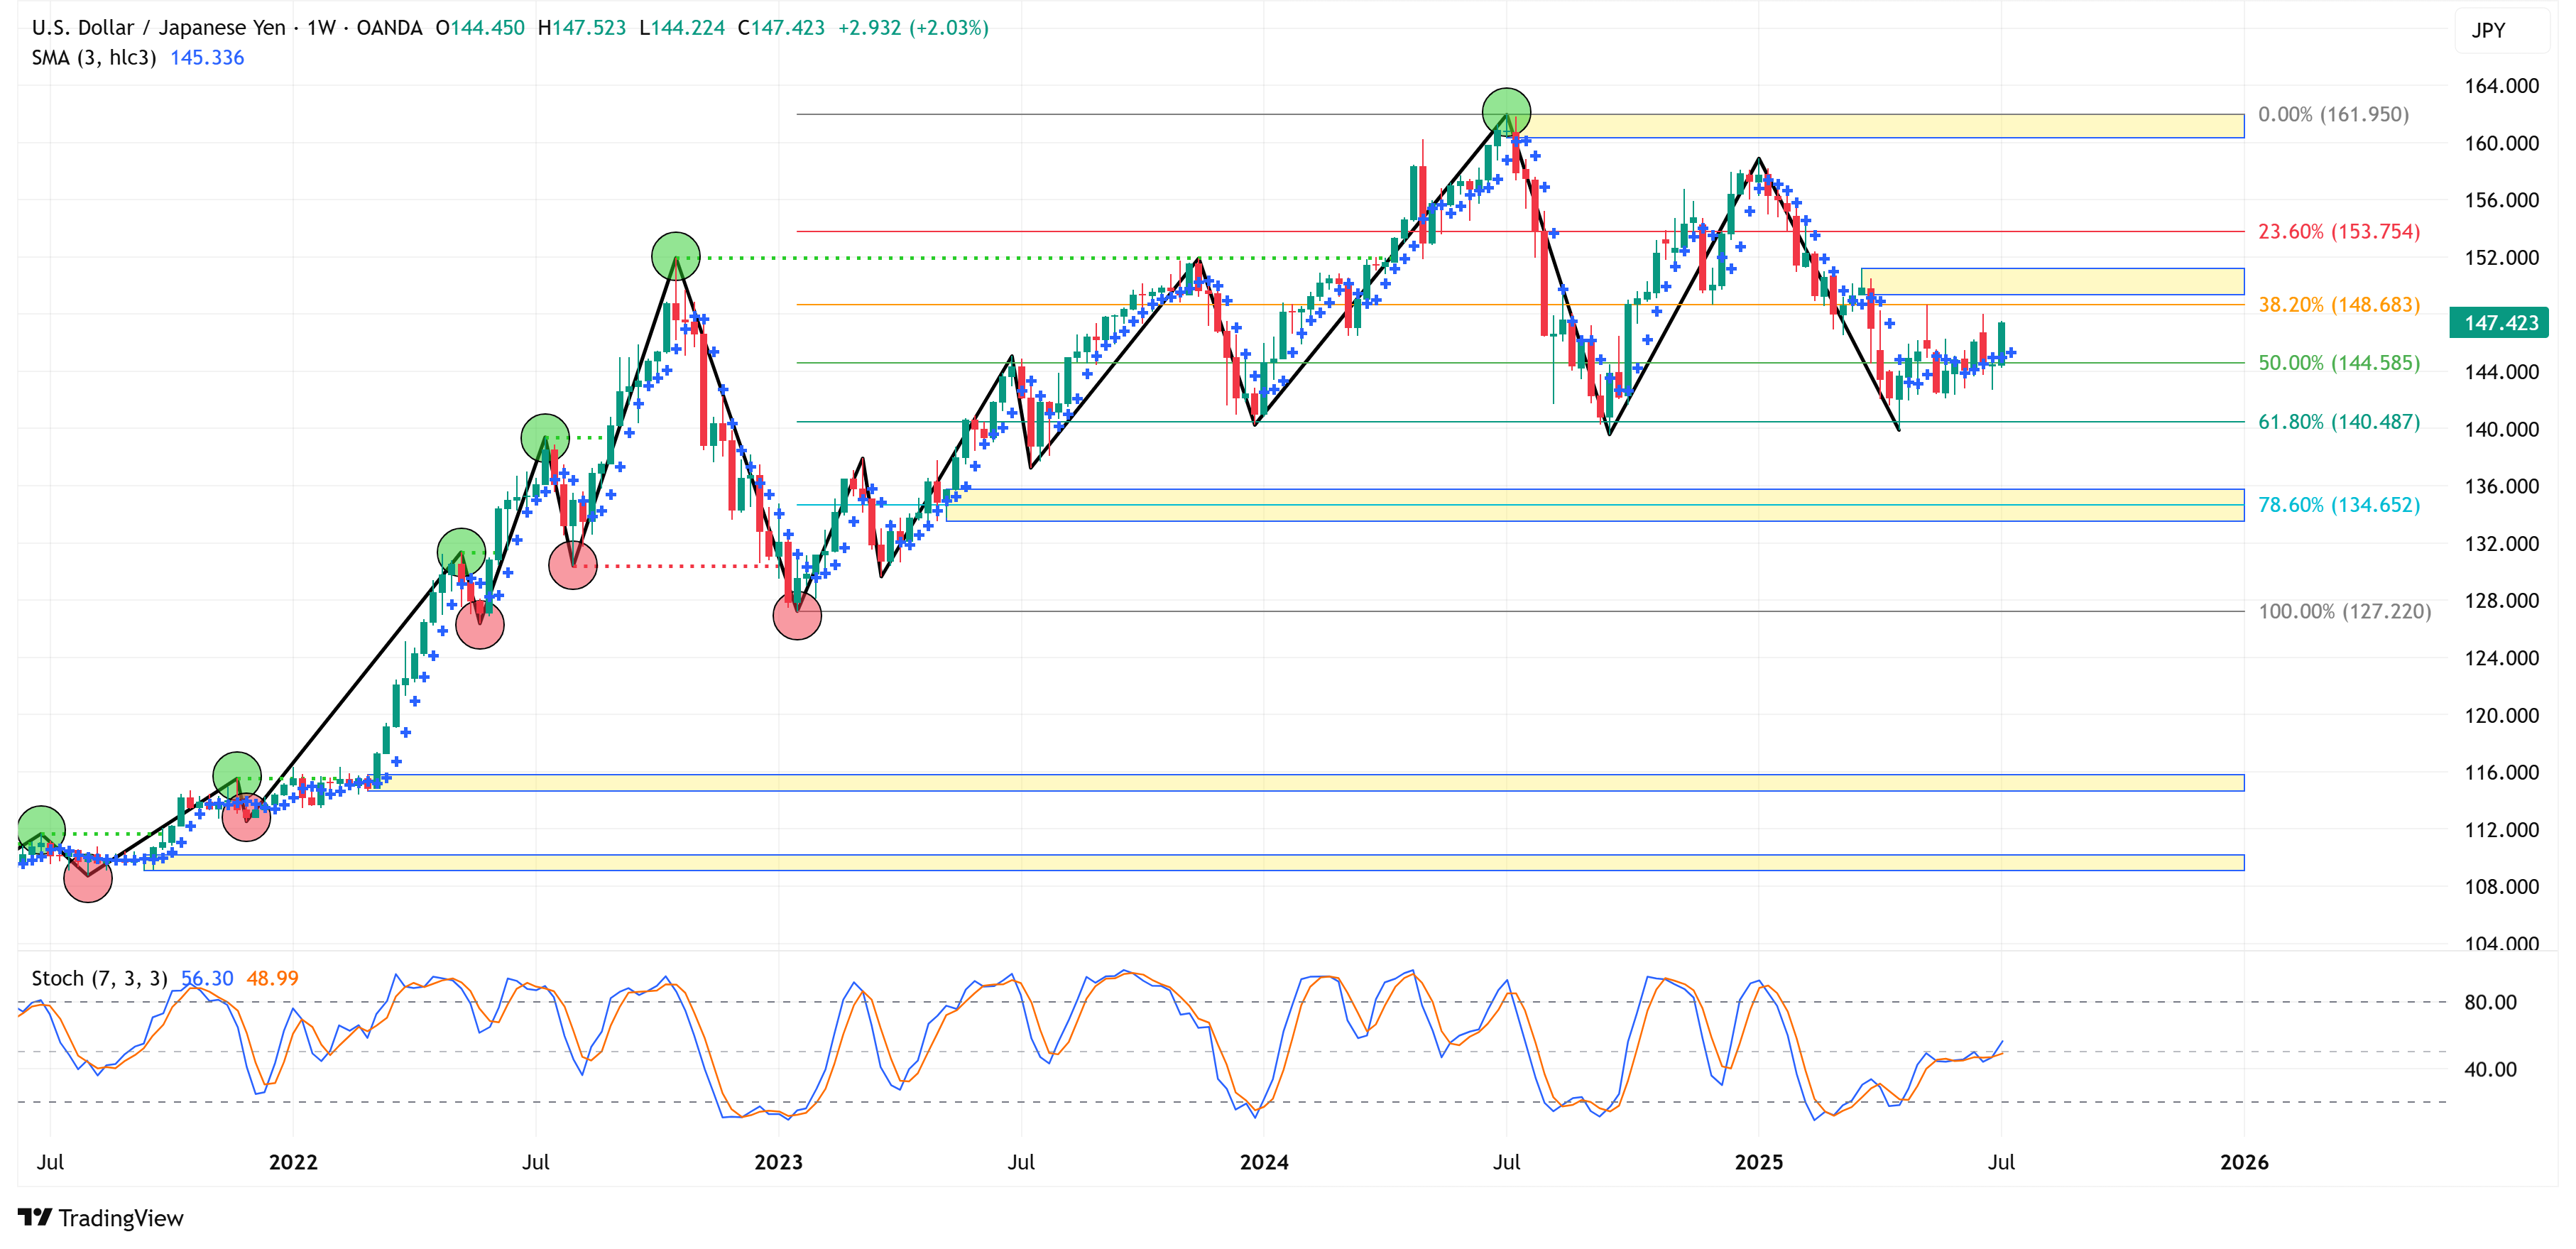
Japanese Yen (USD/JPY)
📈 Trend = ⬆️ / 🎯 Target = 161.950 / 🛑 Stop Loss = 127.220
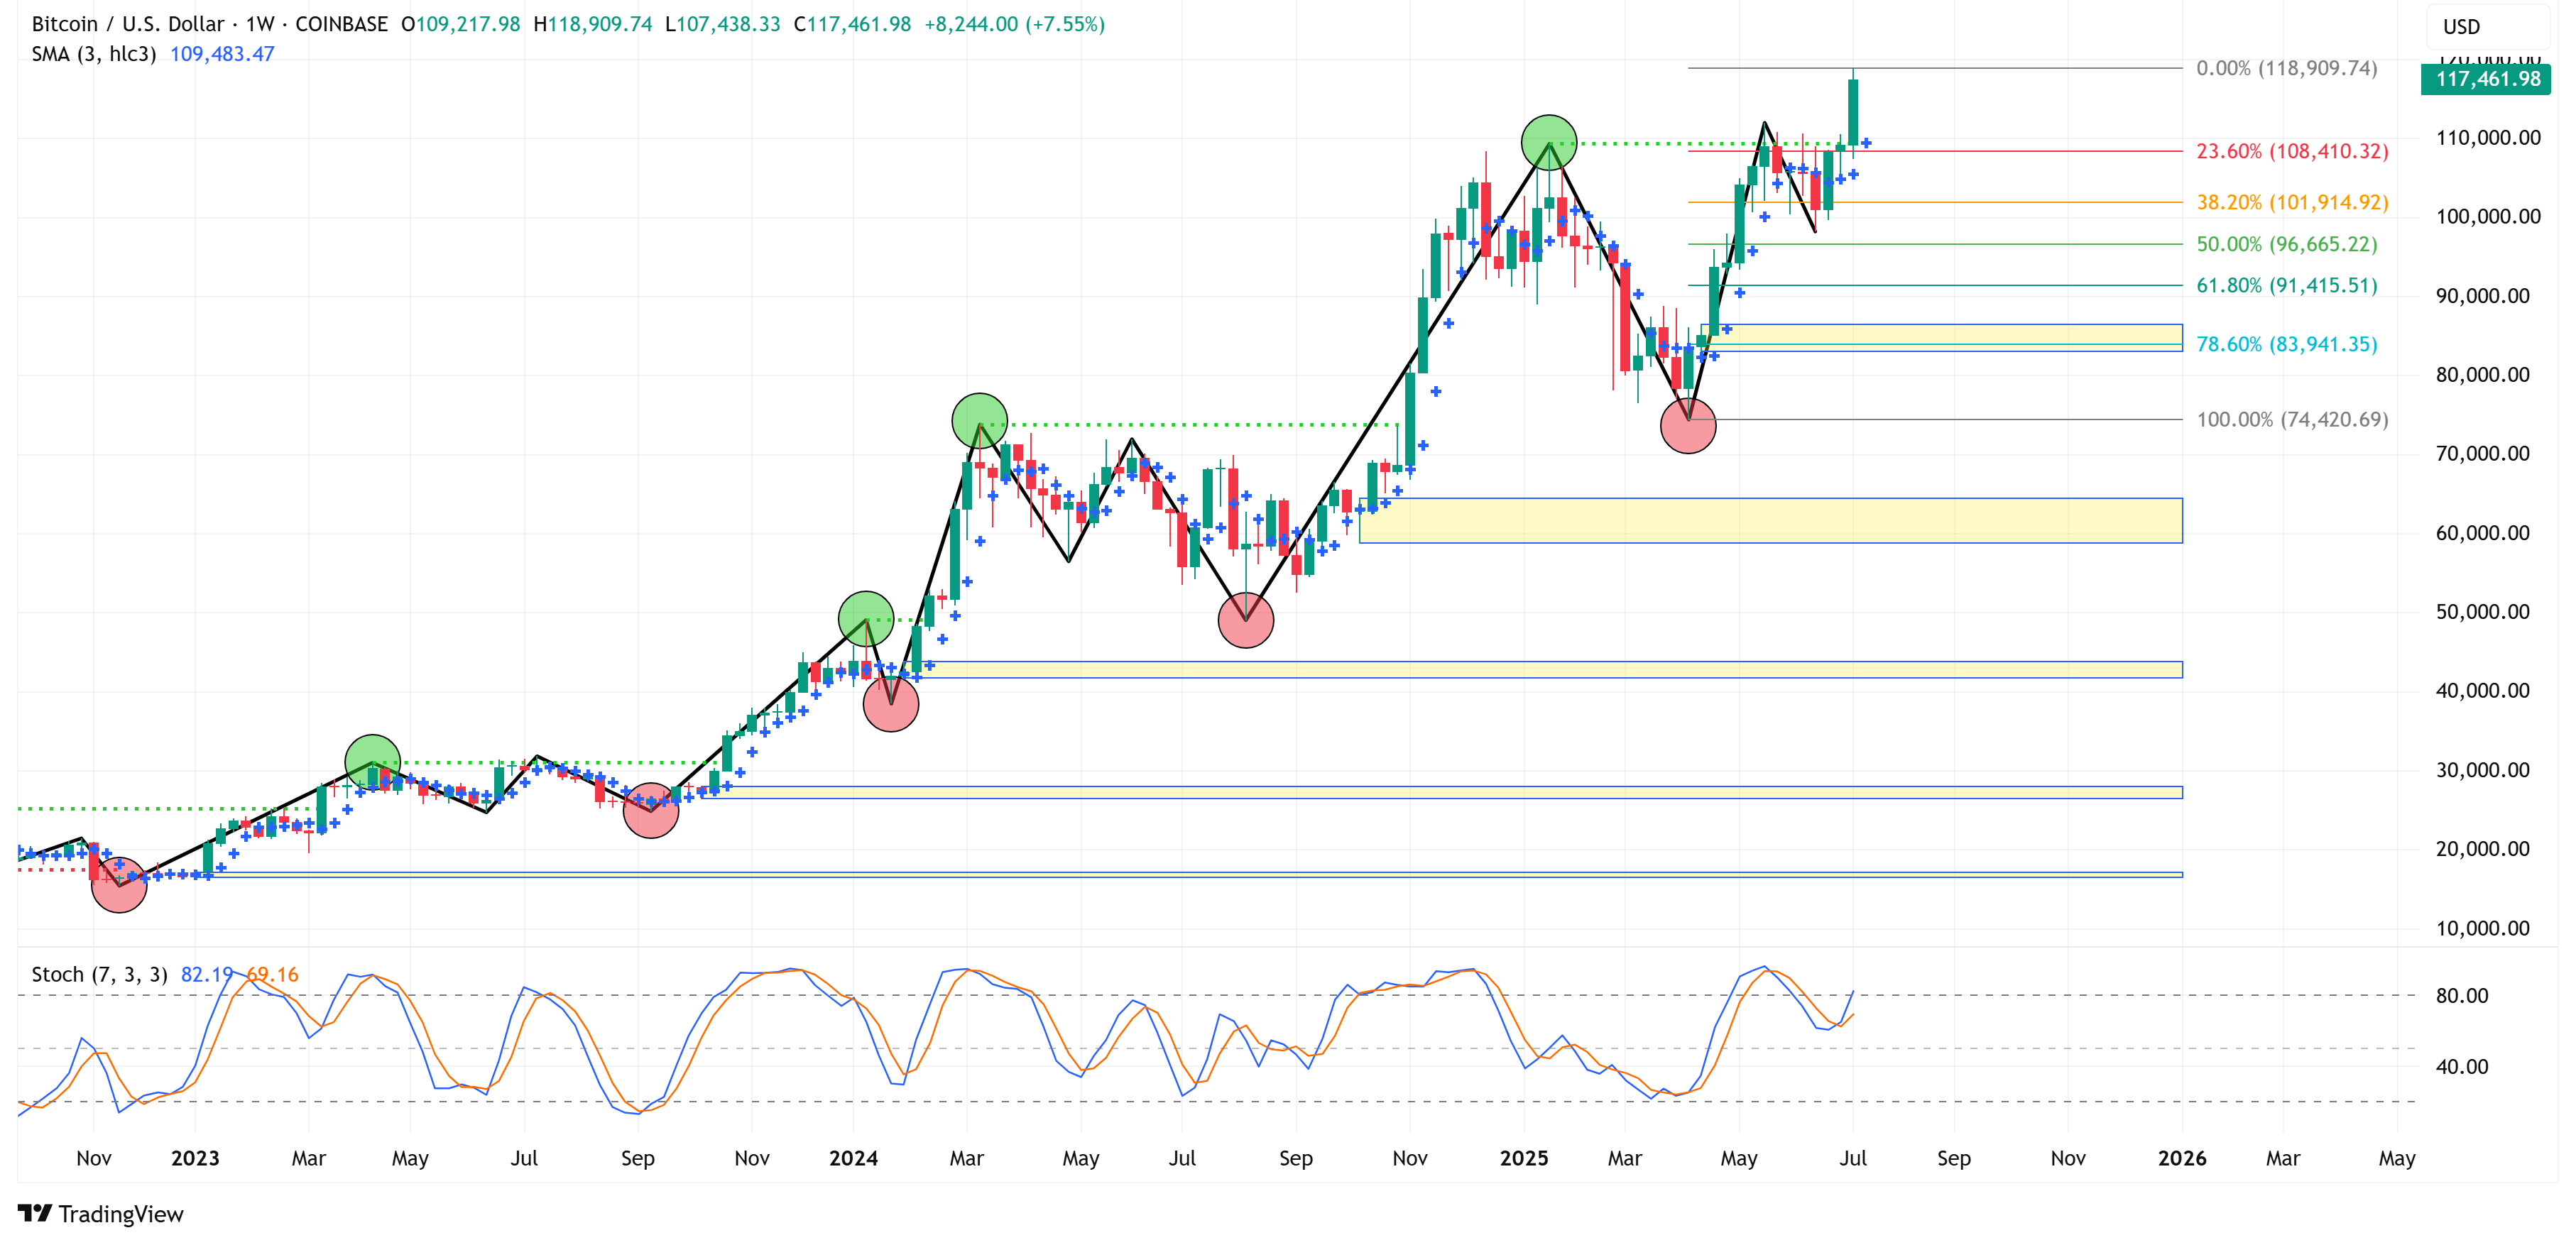
Bitcoin
📈 Trend = ⬆️ / 🎯 Target = 118,909.74 / 🛑 Stop Loss = 74,420.69
Commodities:
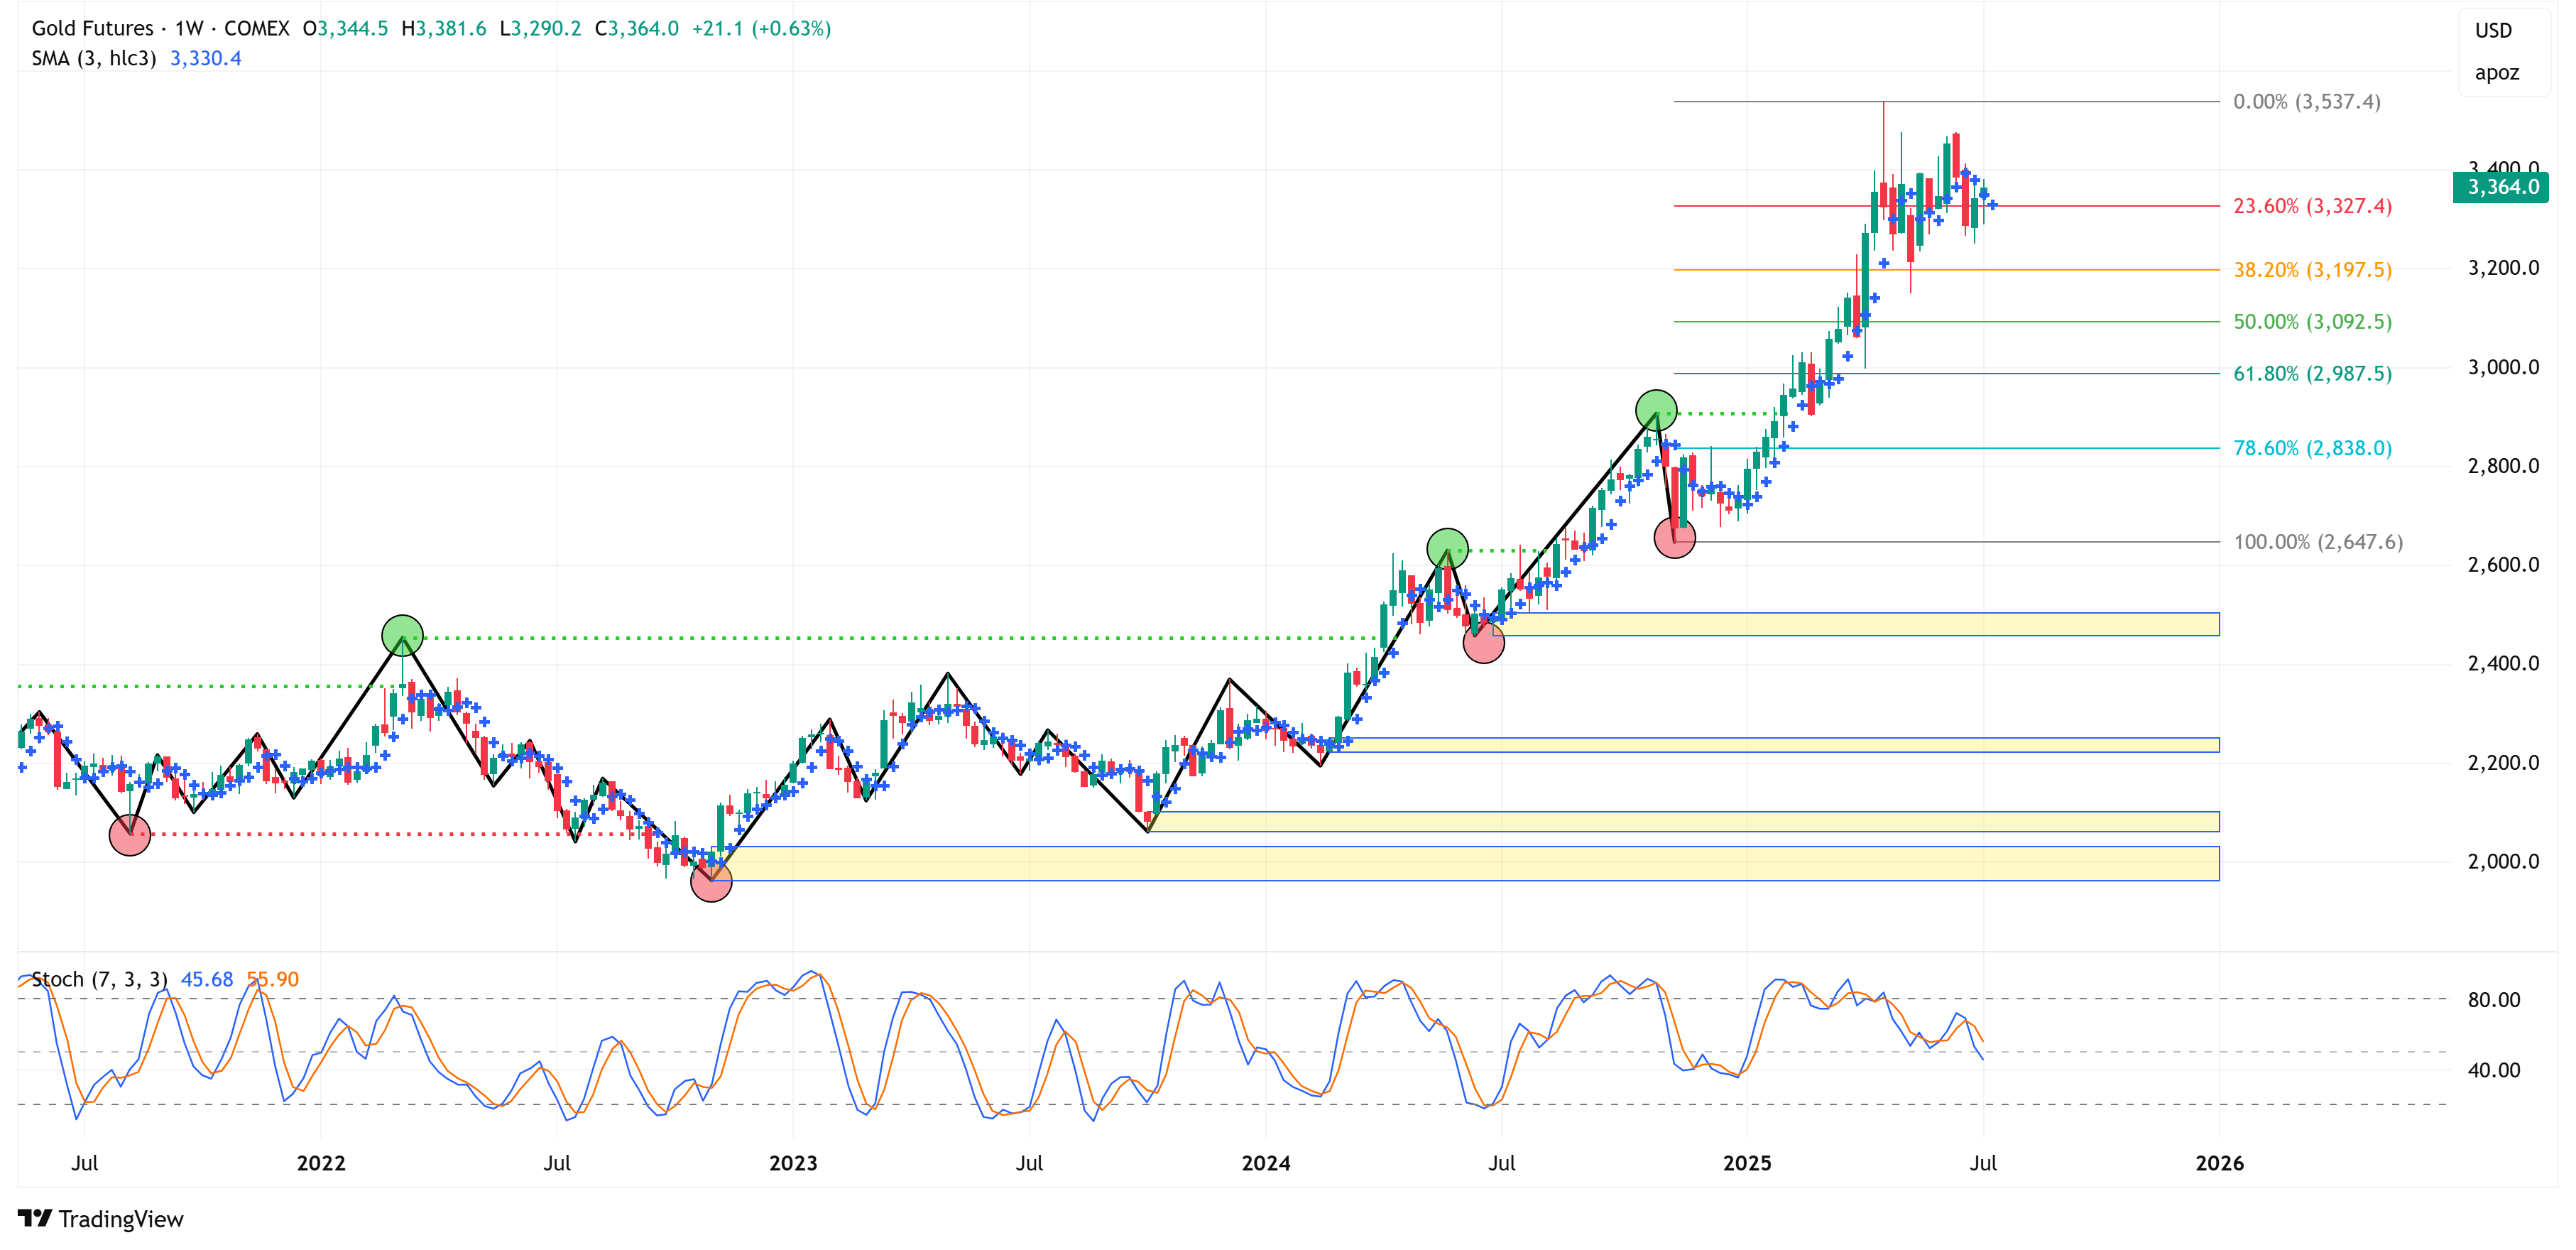
Gold
📈 Trend = ⬆️ / 🎯 Target = 3,537 / 🛑 Stop Loss = 2,648
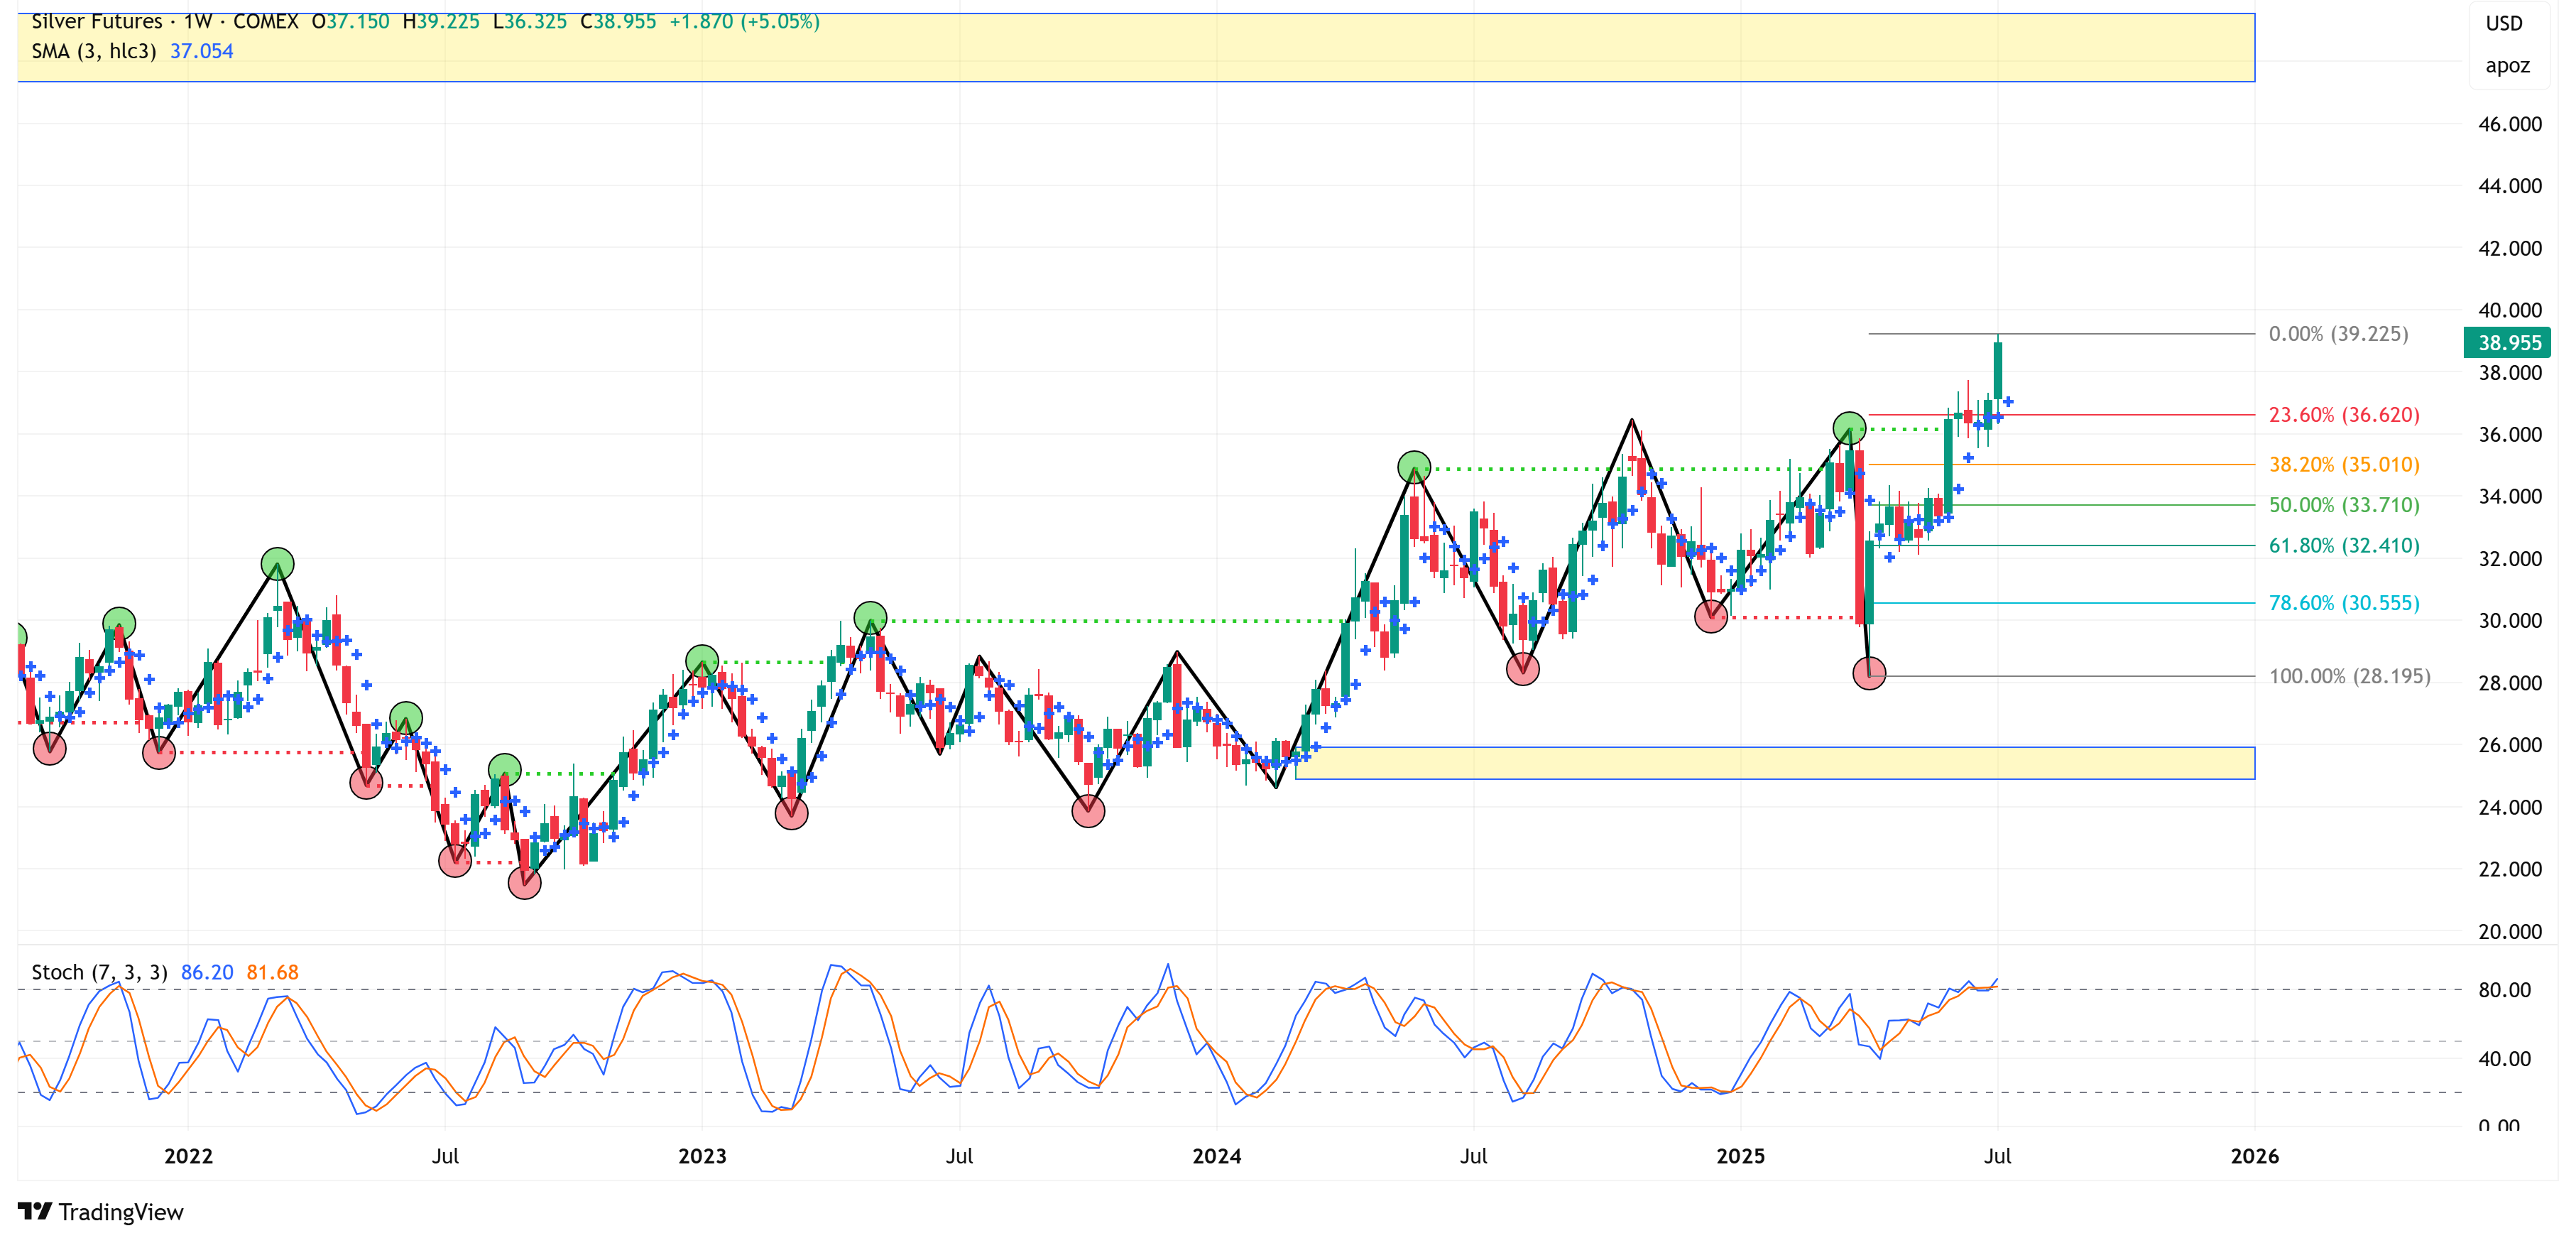
Silver
📈 Trend = ⬆️ / 🎯 Target = 39.23 / 🛑 Stop Loss = 28.20
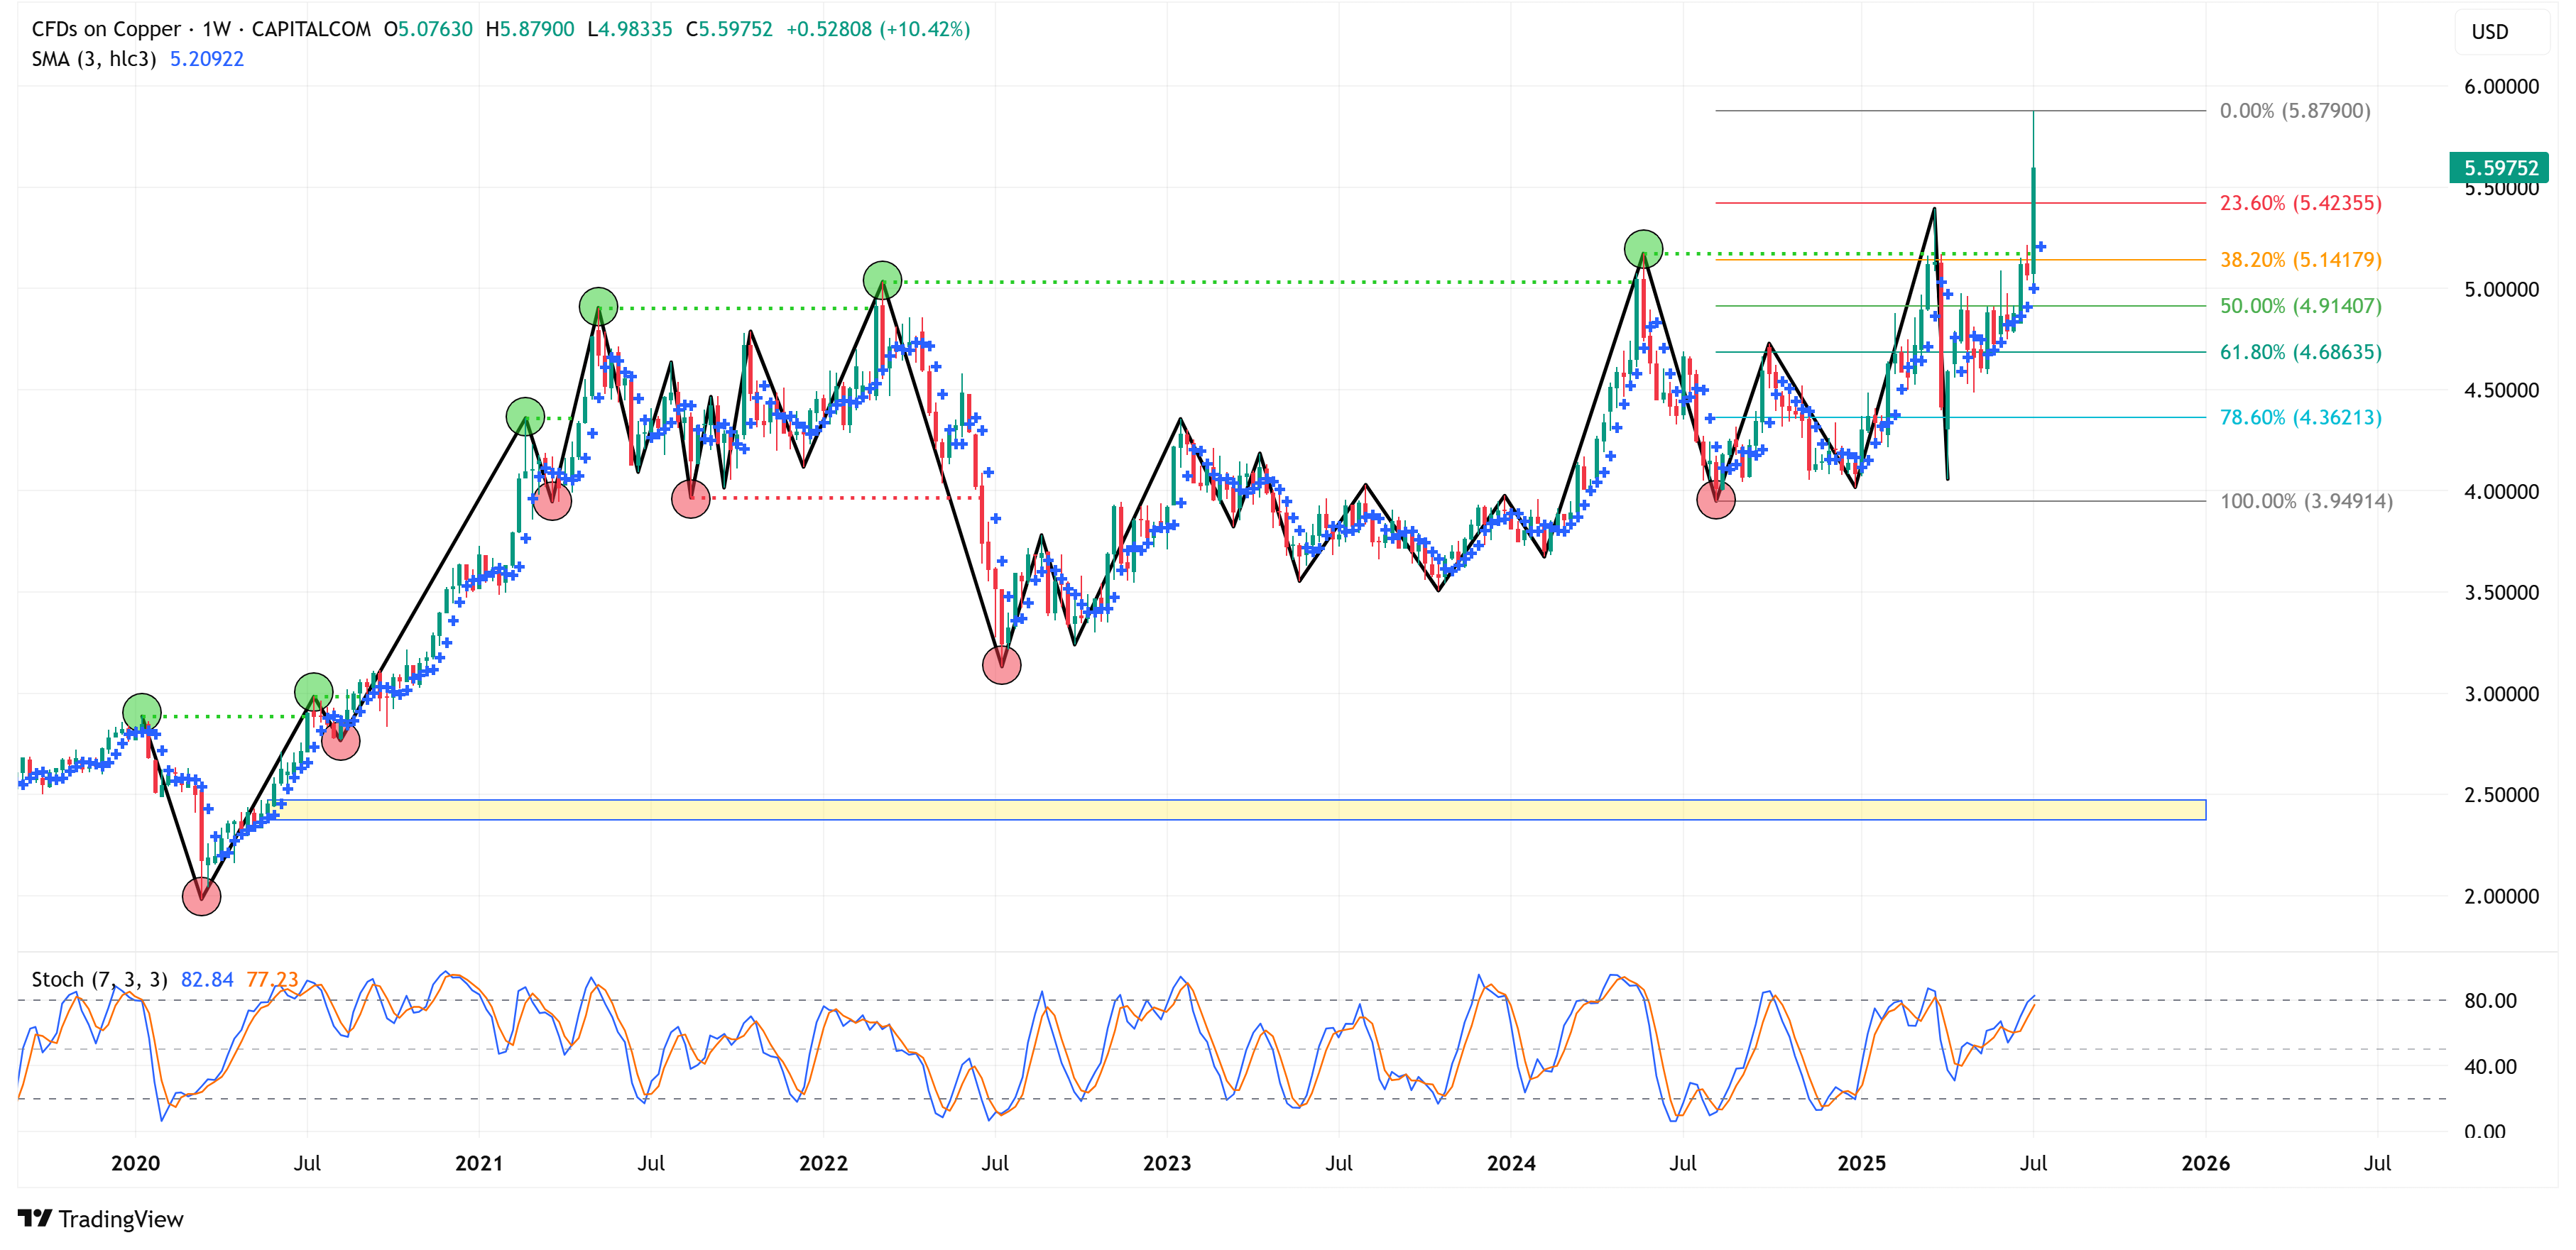
Copper
📈 Trend = ⬆️ / 🎯 Target = 5.879 / 🛑 Stop Loss = 3.949
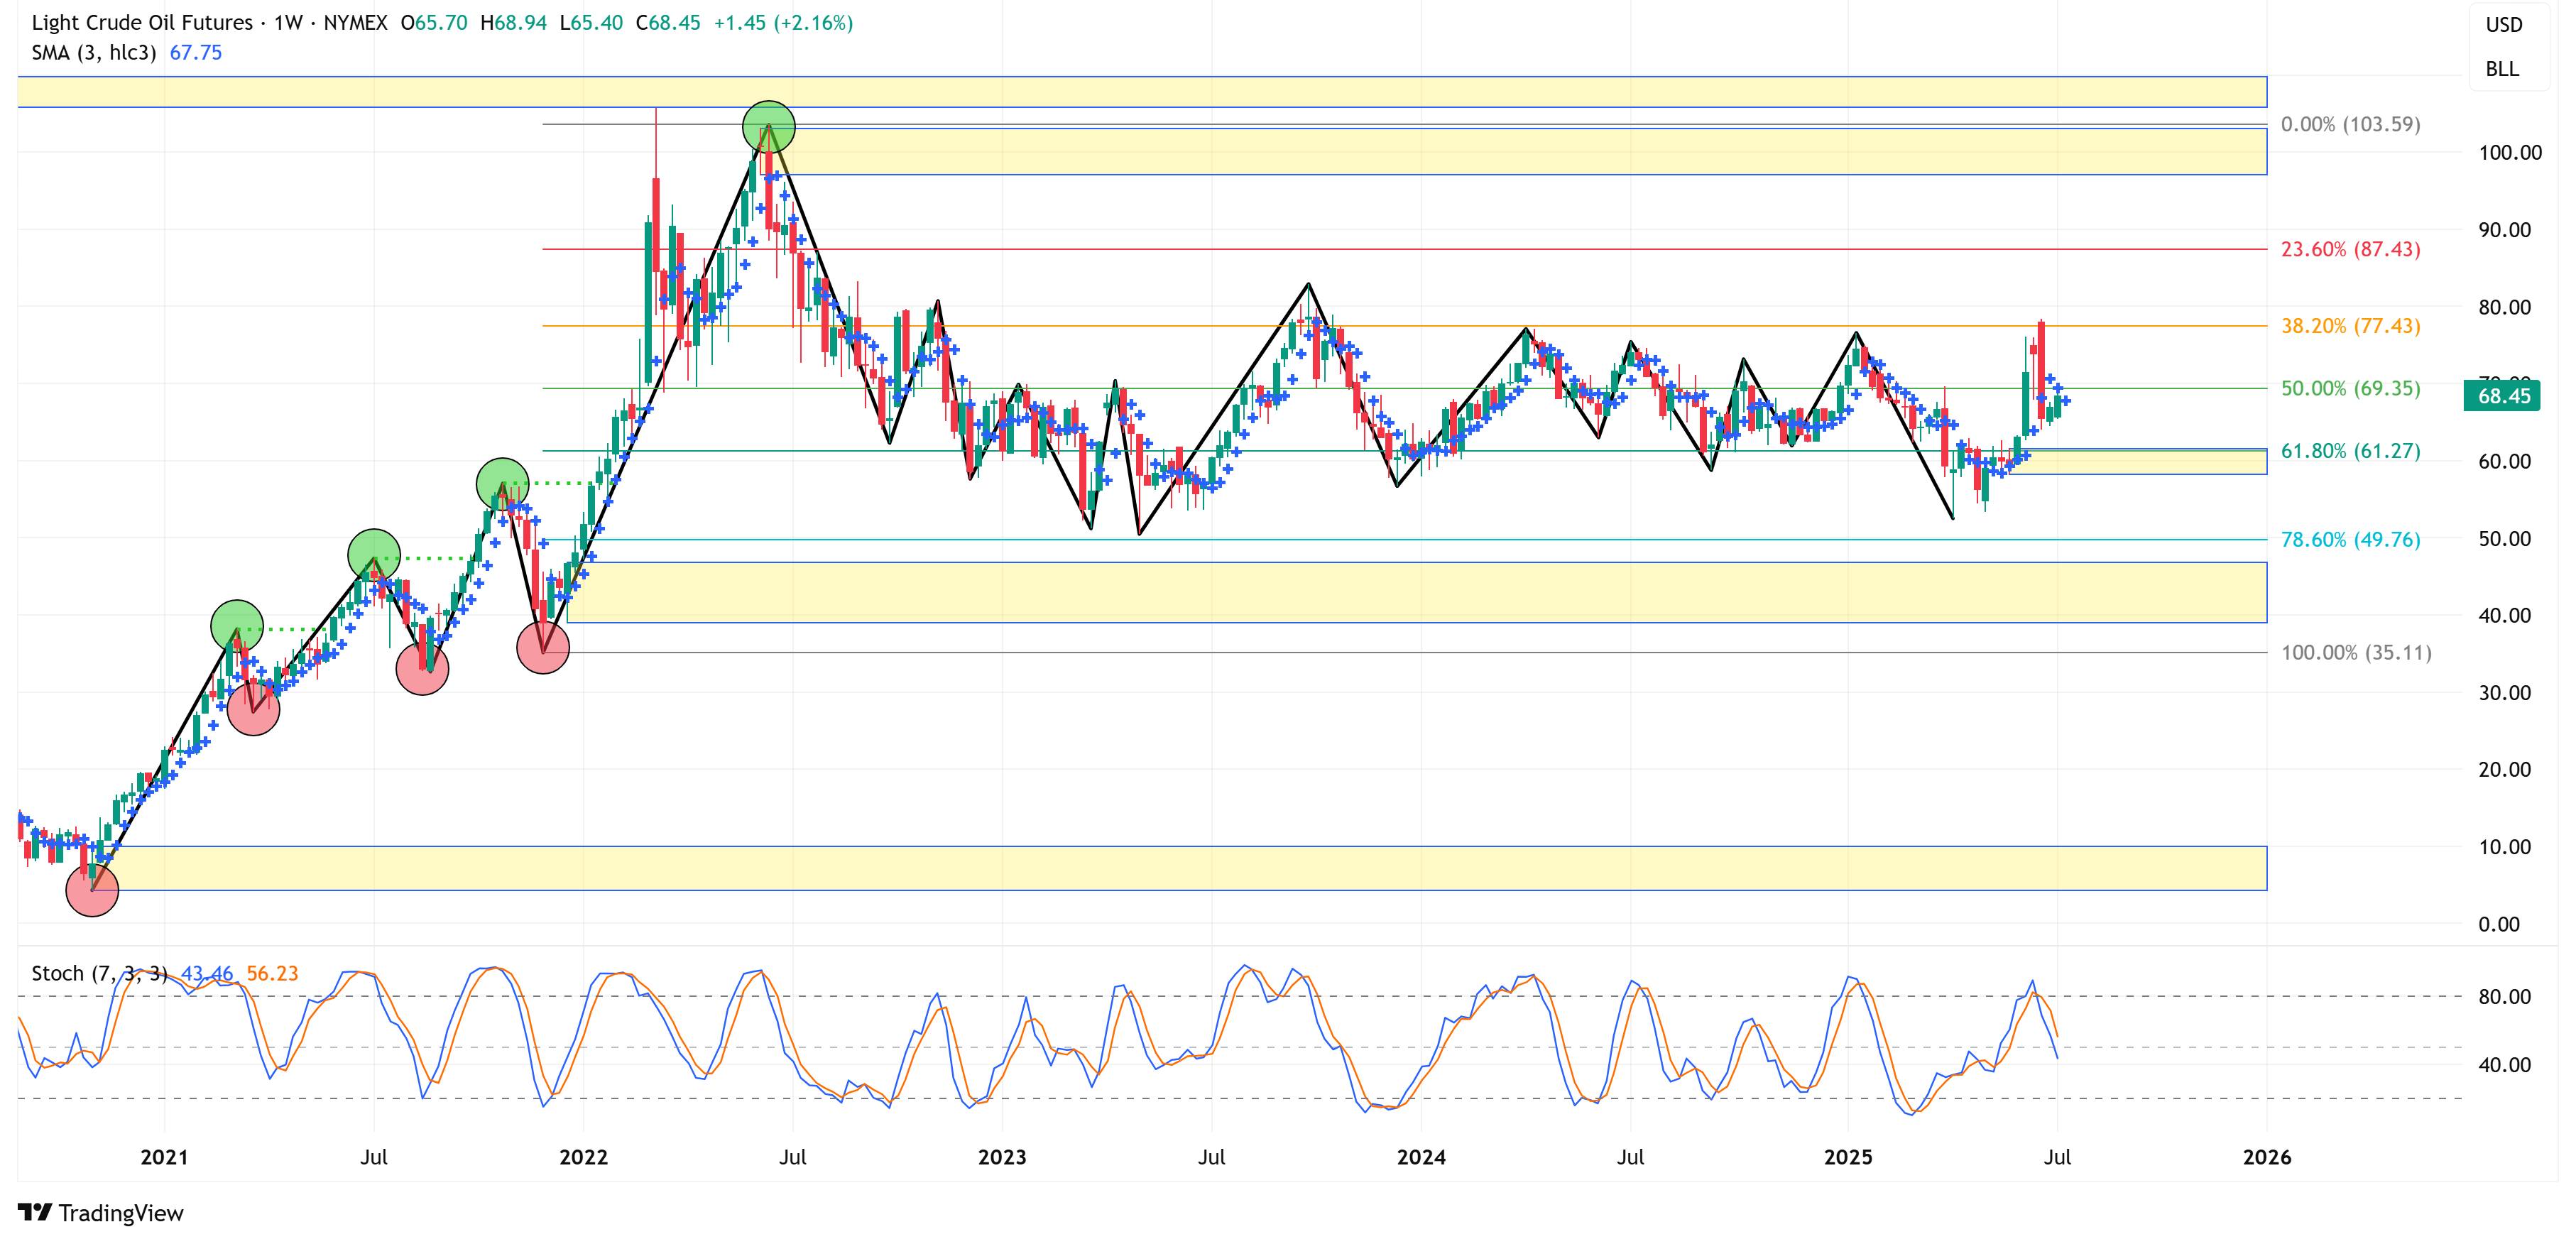
Crude
📈 Trend = ⬆️ / 🎯 Target = 103.59 / 🛑 Stop Loss = 35.11
Fixed Income:
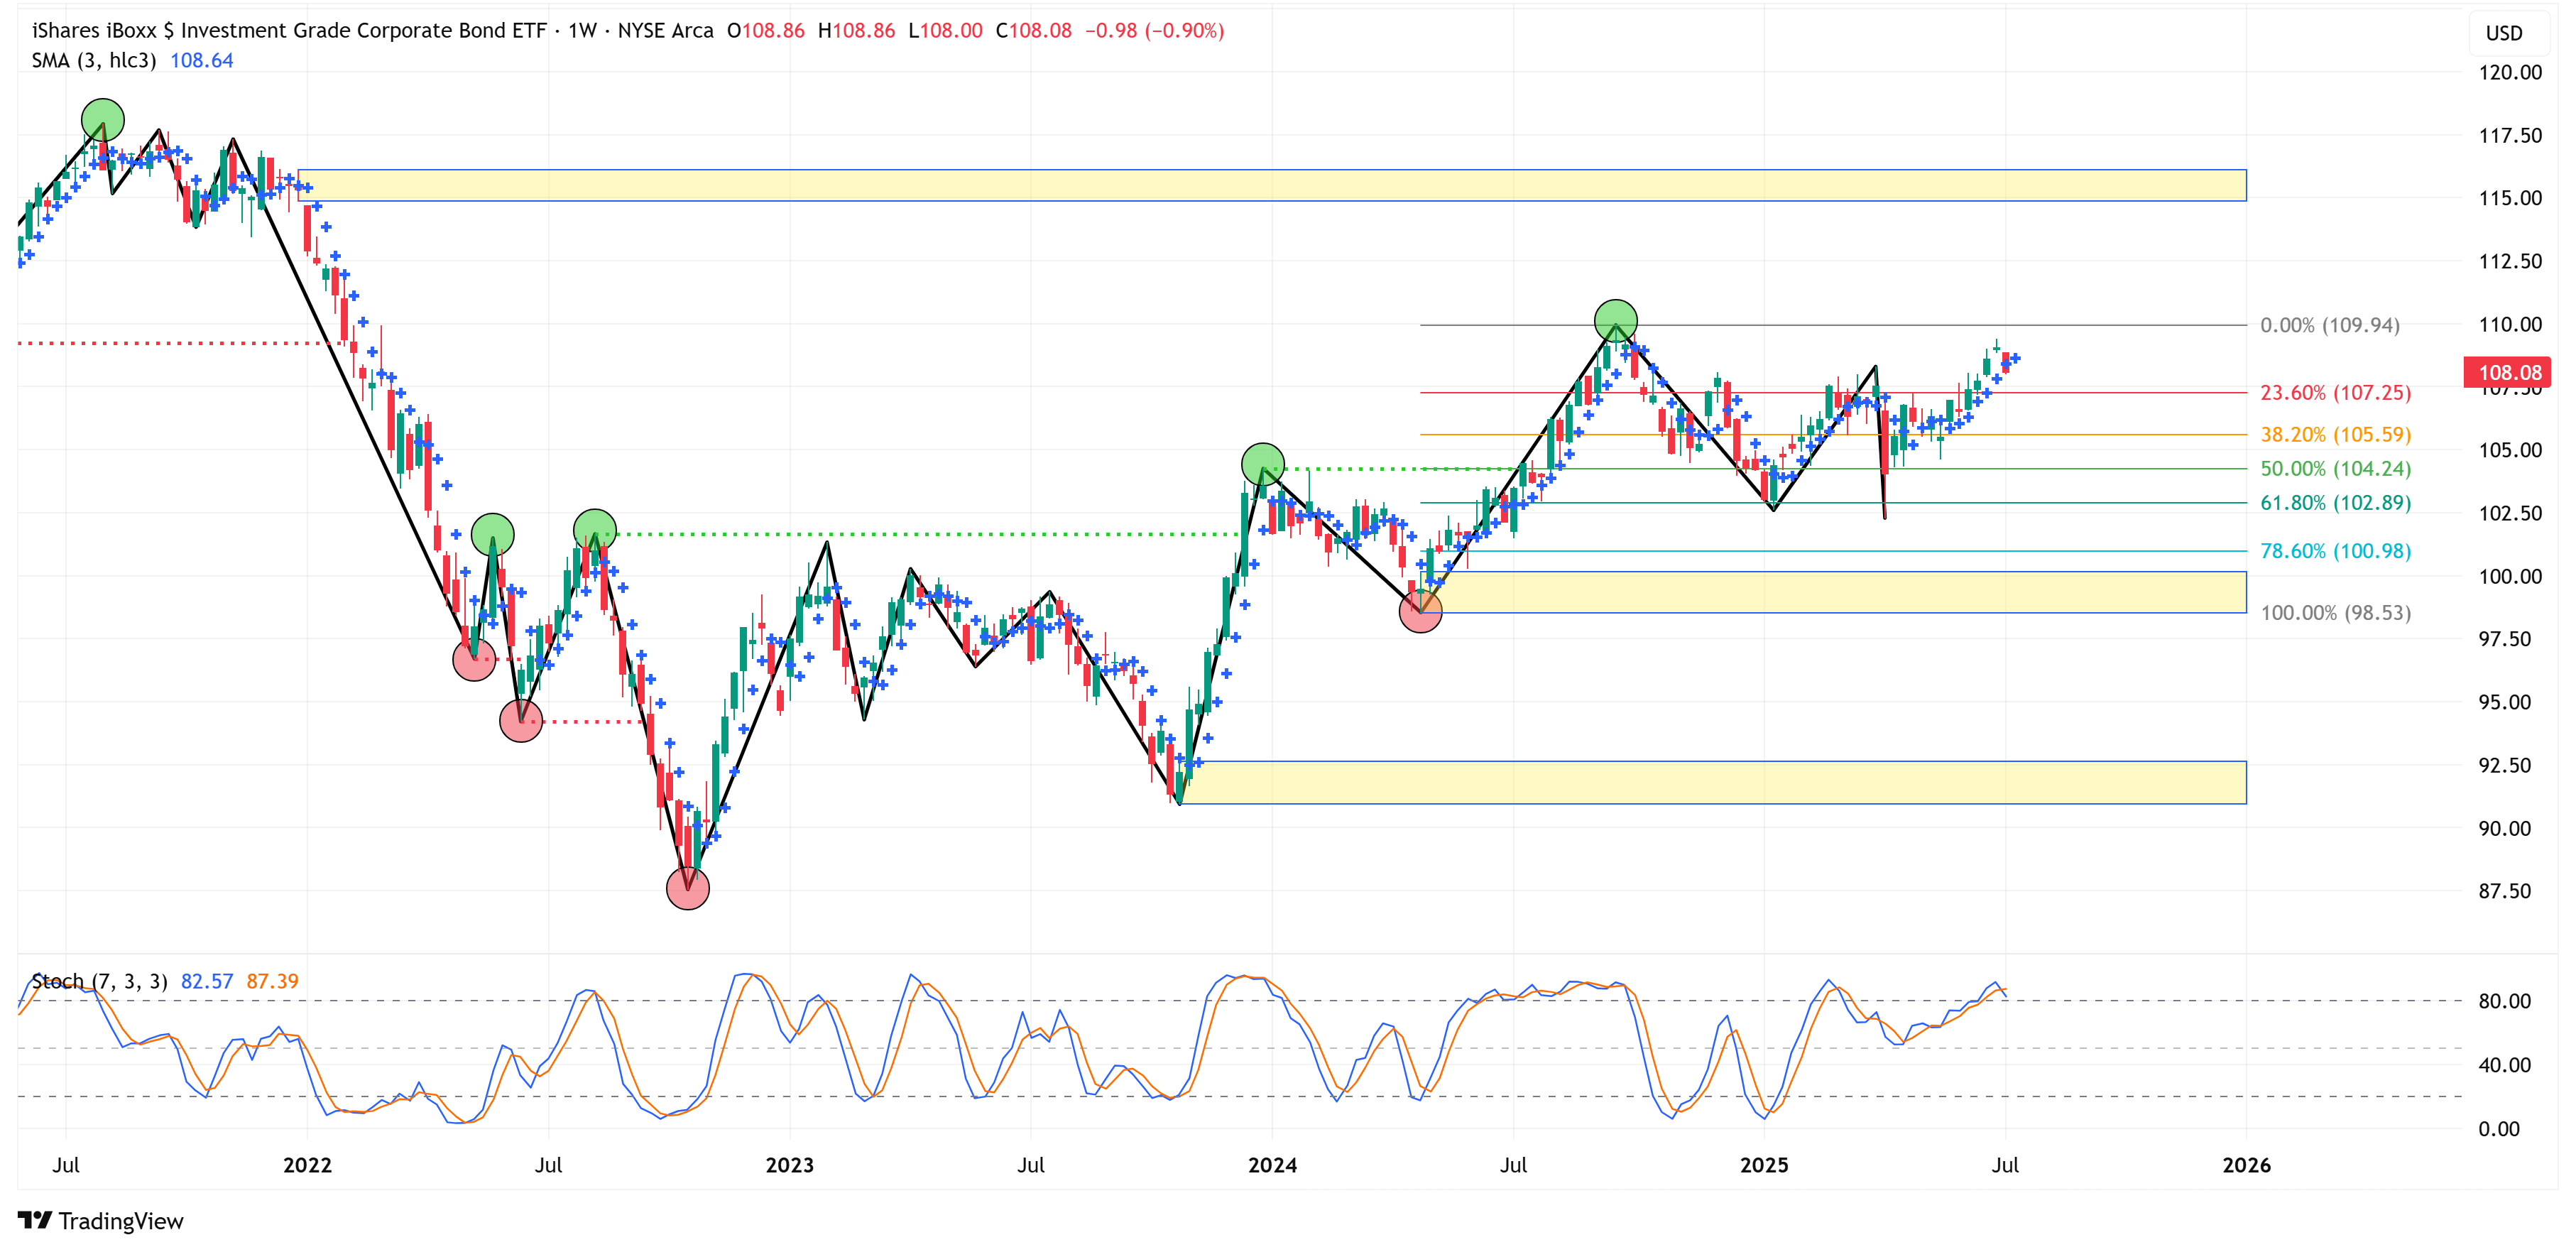
Investment Grade (LQD)
📈 Trend = ⬆️ / 🎯 Target = 109.94 / 🛑 Stop Loss = 98.53
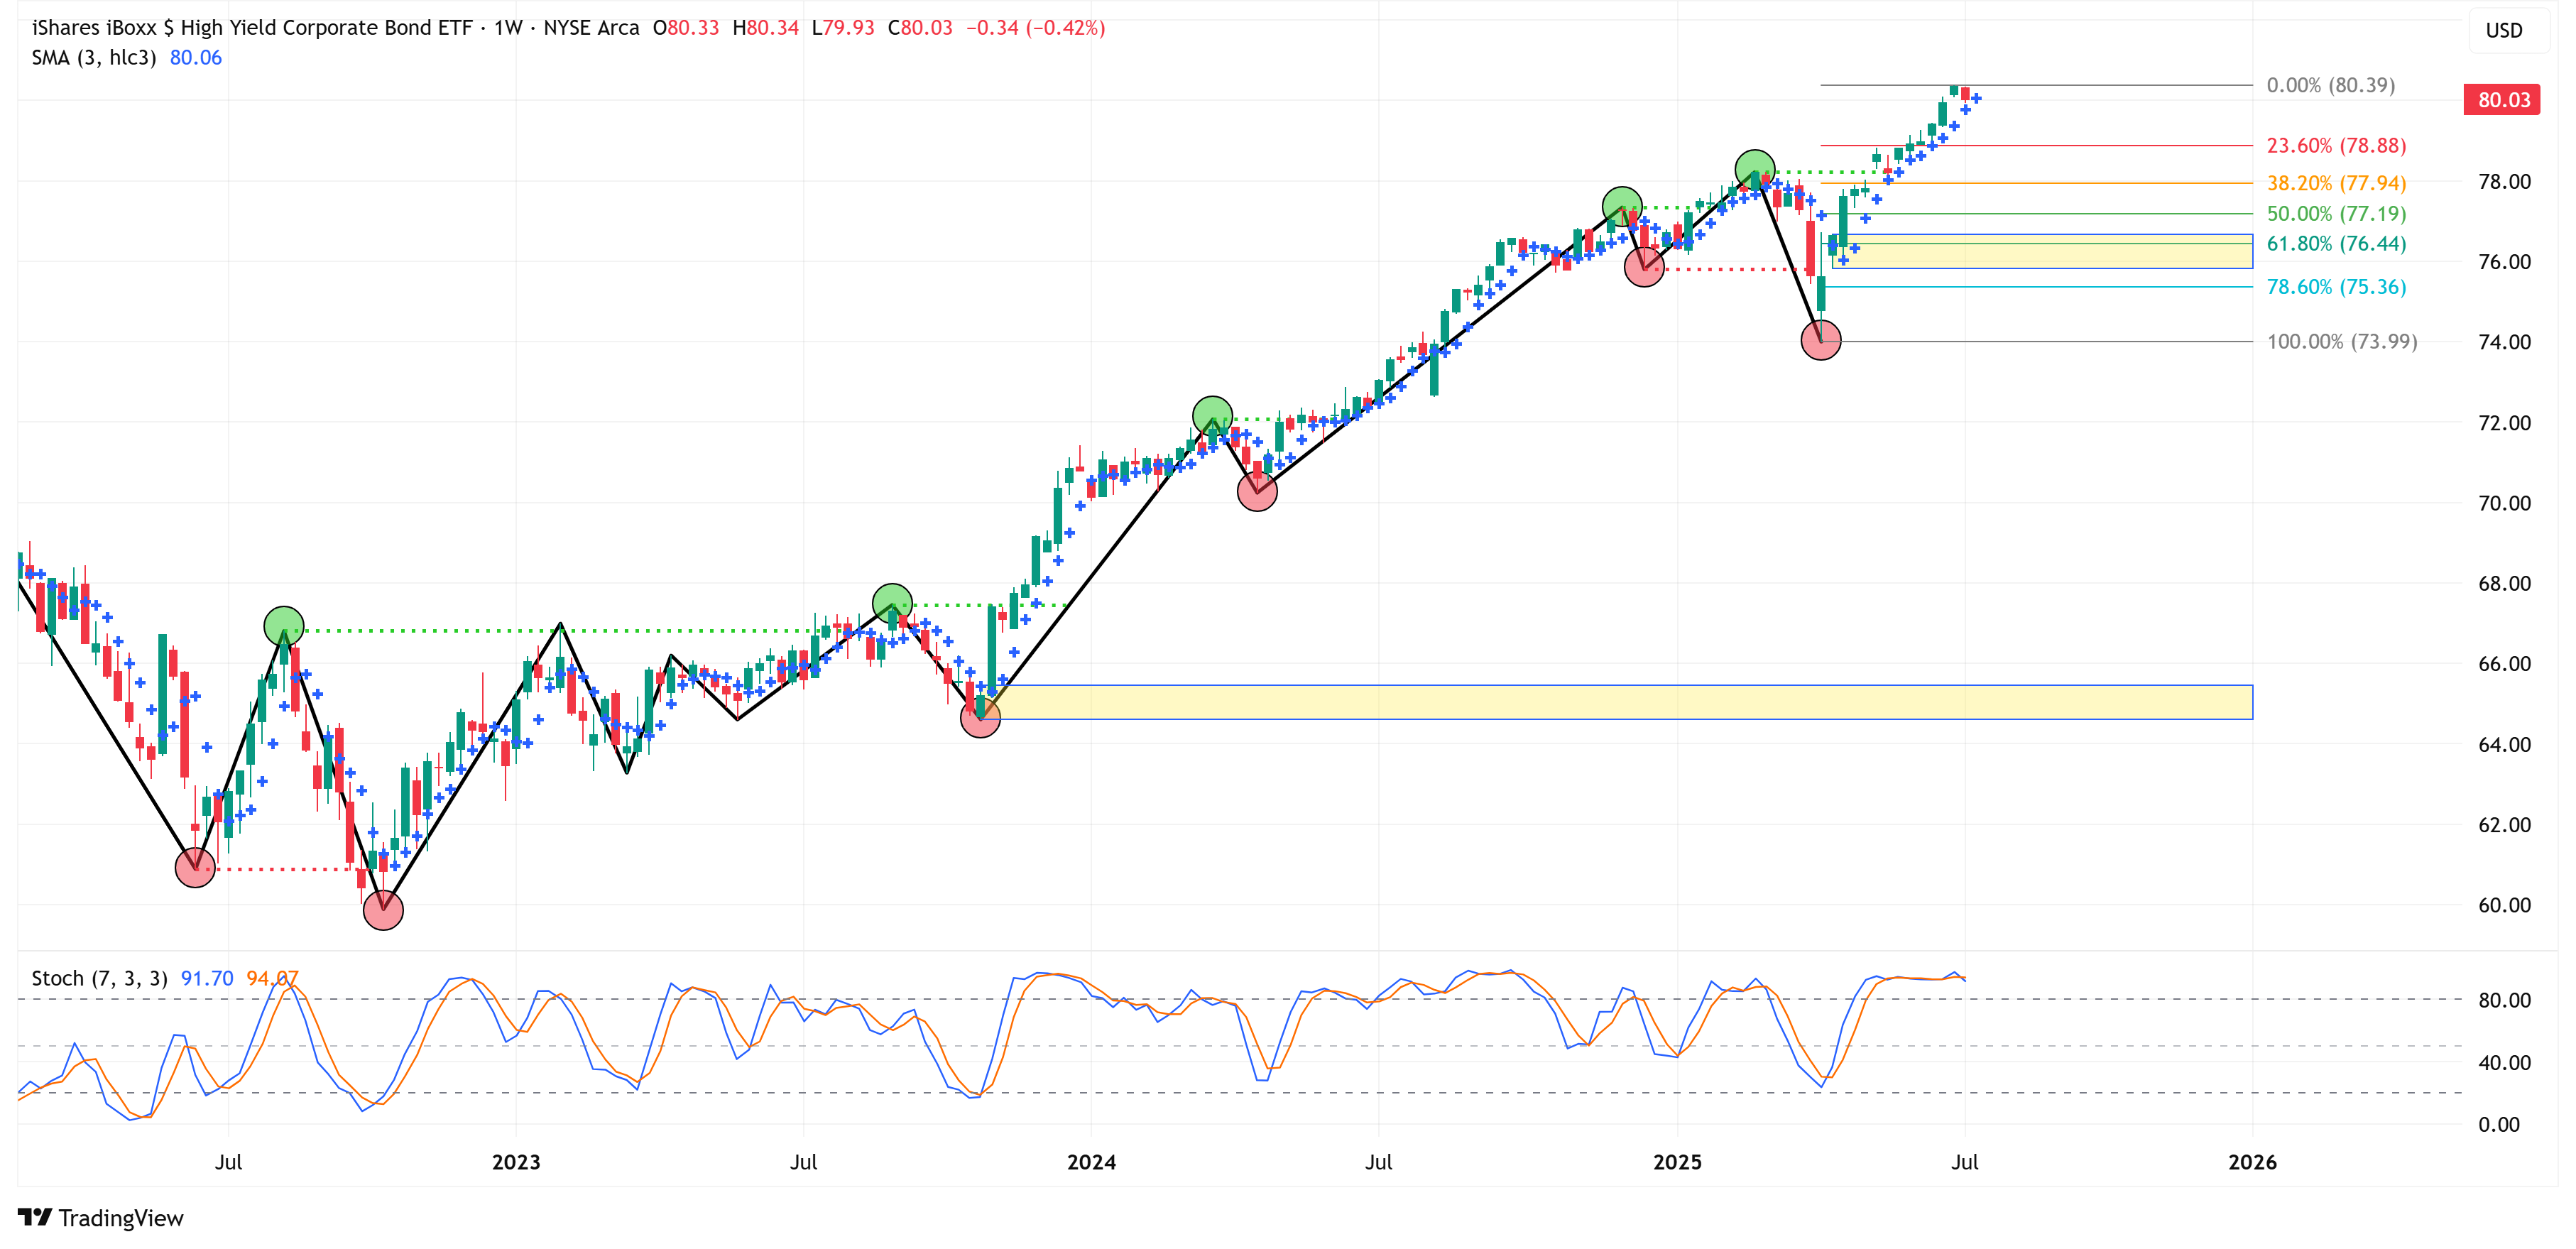
High Yield (HYG)
📈 Trend = ⬆️ / 🎯 Target = 80.39 / 🛑 Stop Loss = 73.99
Thank you, as always, for your continued support of this newsletter!
Let’s make it a great week!
Take care,
Jim Colquitt
The Weekly Chart Review is a publication of Skillman Grove Research.
All opinions and views expressed herein are based on our judgments as of the date of writing and are subject to change at any time.
The content of this newsletter is for educational purposes only and should not be construed as investment advice.
Investing involves risk, including loss of principal, and past performance may not be indicative of future results.
Do your research and, where appropriate, seek the advice and counsel of a reputable financial advisor.
Matthew 6:33